Identifying settlements involved in
Hungary’s transit traffic
Kincses, Áron and Tóth, Géza and Tömöri, Mihály and
Michalkó, Gábor
Hungarian Central Statistical Office, University of Nyíregyháza,
Budapesti Corvinus Egyetem
October 2016
Online at
https://mpra.ub.uni-muenchen.de/74508/
Identifying settlements involved in Hungary’s
transit traffic
Áron Kincses
Hungarian Central Statistical Office, Hungary
E-mail:
Géza Tóth
Hungarian Central Statistical Office, Hungary
E-mail:
Mihály Tömöri
University of Nyíregyháza, Hungary E-mail: [email protected]
Gábor Michalkó
MTA CSFK, Budapesti Corvinus Egyetem, Hungary E-mail: [email protected]
Keywords:
transit tourism, tourist spending, Hungary
As one of the transit countries in Europe, Hungary plays a significant role both in the east-west and north-south passenger traffic of the continent. Approximately one-third of foreigners (14 million) arriving yearly in Hungary travel through the country. A turnover like this can generate changes at the micro level in the everyday life of affected settlements and have social, economic, and physical impacts. In order to examine this, it is important to identify settlements involved in transit. The study introduces methodological approaches that can be applied to outline the crystallising points of transit tourism in Hungary. With the help of GIS-based delineation and the logit model the settlements involved in transit have been identified. The study concluded that settlements involved in transit traffic (1) are located at the intersections of roads enabling the shortest travel time between different border sections, (2) possess a motorway junction, and (3) are situated at the intersection of two main roads. Finally, it is shown that transit impacts the local economy of these settlements.
Introduction
to the Schengen Area, which provides transit without border control), accessibility of the European road networks and volume of international transit traffic present a significant challenge to regions involved in this phenomenon. Transit traffic does not necessarily appear in a hermetically sealed corridor (such as motorways intersecting borders), which is almost independent from the socio-geographic environment, but rather it frequently becomes part of the local milieu. The nature of transit traffic presupposes stopping occasionally (when the driver and passengers take rest), having a meal and filling the car with petrol, which takes place either at rest stops along motorways that provide appropriate infrastructure or in settlements, that is, in the local residents’ milieu. Therefore, transit is a contradictory phenomenon: it can be interpreted as a temporary traveling activity, which is fast and short between the place of departure and the destination. However, it also involves the use of the tourism infrastructure of affected regions with varying intensity.
Since 2014, the Hungarian Central Statistical Office has been measuring the travelling activity of foreigners not involved in freight transport, which gives us a relatively reliable picture of the characteristics of transit traffic at the macro level (HCSO 2013). We are aware that the proportion of transit passengers between 2004 and 2011 increased from 29% to 34%, their number exceeding 14 million. Their expenditure was 95 billion forints in 2011, which accounted for 8% of the expenditure of foreigners staying in Hungary. The figures speak for themselves: a turnover like this can generate changes at the micro level in the everyday life of affected settlements and have social, economic and physical impacts (Puczkó–Rátz 1998). In order to examine these changes and impacts, it is important to identify the settlements involved in transit traffic, that is, review the towns and villages where the demand of transit passengers is realised (presumably due to their location and infra- and suprastructure facilities).
The present study seeks to identify methodological approaches that can be applied to outline the crystallising points of transit traffic in Hungary and identify settlements where the characteristics of invisible tourism related to transit traffic can be investigated. In addition, the possibilities and limitations of quantifying the economic impacts of transit are examined in settlements involved in the phenomenon. Although the study examines the phenomenon of transit traffic primarily at the level of settlements, we should not forget that impacts (due to the multiplier effect) appear on the whole economy.
Theoretical background
Transit traffic, viewed from the perspective of transportation geography, focuses primarily on road and rail freight transport. Some studies focus on the infrastructure and its development (Hall et al. 1991, Erdősi 2005, Fromhold–Eisebith 2007) and the logistics (Kerschner–Petrovitsch 1998) of transit traffic, whereas others deal with costs (Kraus 1991, Fielding 1995, Bulis–Skapars 2013), environmental issues (Kalas 1992) and geopolitical aspects (Fleischer 2007, Ruppert 2007). Researchers are more interested in urban transit (Viton 1992, Knowles 2012) than the characteristics of international cross-border freight transportation.
Studies related to migration make up a significant group within the literature on transit, which discuss the characteristics of legal and illegal traffic. Although works dealing with the relationship between transit and legal migration primarily focus on the load of the transportation infrastructure of regions functioning as corridors (Williams–Baláz 2009), in case of the illegal migration flows of refugees (Dacyl 2002), health care (Castañeda 2011) and various socio-economic questions (DeMaria Harney 2011) are in the forefront.
Tourism researchers pay surprisingly little attention to transit-related issues, which is probably due to the statistical approach of the notion (Próbáld 2002). Studies that realise the touristic aspects of the behaviour of transit passengers or the role of the infra- and suprastructure created for the fulfilment of their demands are hard to find. This research theme primarily appears in studies discussing the tourism of former socialist countries in East-Central Europe and Southeast Europe, wherein the flows of guest workers to Western Europe are also highlighted (Bakic 1988, Johnson 1995, Baláz–Mitsutake 1998). Microstates with special geographical locations are also involved in international transit, among which Gibraltar has an outstanding position in passenger traffic arriving from Spain and heading towards North Africa (Seekings 1993). Transit plays a decisive role in not only land transport but also air transport; for example, retail establishments located in transit areas of airports play a role in passing transit passengers’ time and motivating their spending (Achen–Klein 2002). Researchers are also interested in measuring transit traffic; although it cannot replace classical traffic counts, useful additional information can still be gathered by registering the spatial and temporal characteristics of phone calls (Ma et al. 2013). Finally, the special touristic behaviour of travellers using recreation vehicles is still an unknown area in the relationship between tourism and transit (Green 1978).
Transit as crypto-mobility
and Hungary. Besides the east-west and north-south freight transport, the role of the cross-border flow of the workforce and demand for tourism in the Mediterranean region is becoming more important. Consequently, transit is East-Central Europe’s special characteristic feature, as countries in the region experience a continuous increase in the volume of transit traffic due to the enlargement of the Schengen Area and development of the road network. EU professionals have also realised the touristic aspects of the phenomenon, and, among other things, they emphasise the need for the measurement of transit. Article 5 of the new EU Regulation1 says the
following with the aim to renew the methodology of tourism statistics:
‘…the growing importance of short trips and same-day visits contributing substantially in many regions or countries to the income from tourism […] means that the production of tourism statistics should be adapted.’
Thus, the former interpretation of tourism, which supposes an overnight stay, should be widened, whereby trips lasting for less than 24 hours, such as excursions (shopping and visiting friends and relatives) realised chiefly in border regions and transit should also be taken into account. As the paradigm of tourism (Michalkó 2012) excludes the discussion of the demand and supply stemming from the needs of participants in freight transport under the aegis of tourism, freight traffic should be disregarded. Nevertheless, it should be noted that road corridors for freight traffic contain numerous infra- and suprastructure facilities that truck drivers also use. Thus, petrol stations with complex services, accommodation and catering establishments along the roads not only fulfil the demand of passengers but also freight traffic. Therefore, an examination should be conducted in this context as well, even though the demand from freight traffic is not regarded as part of tourism expenditure.
If transit appearing in passenger traffic is discussed under tourism, then it is presupposed that it has (as in the case of conventional tourism mobility) important crystallising points. However, while a stay at a registered accommodation establishment is included in tourism statistics, services used during non-conventional tourism mobility rarely appear in databases (suitable for spatial and temporal comparisons). Therefore, in order to explore the geographical aspects of transit, a methodological apparatus needs to be created, which takes into account the special characteristic features of the phenomenon and is based on a statistically measurable fact. This is a serious challenge, as crypto-mobility, that is, a quasi-invisible travelling activity should be made visible. In order to achieve this goal, we should start with special characteristic features of transit that grab the moment of that stops occurring due to any reason. Buying fuel and shopping in retail establishments certainly belong to this category, and we should also not forget about visiting tourist attractions and, in some cases, staying in accommodation establishments.
1 Regulation (EU) No 692/2011 of the European Parliament and the Council of 6 July 2011, concerning
It is strange, but staying in accommodation establishments makes it possible to detect crypto-mobility. As there are no statistics on the number of visits to settlements, reliable estimates of the number of visitors arriving in settlements can only be made by considering the number of overnight guests in registered accommodation establishments. This is particularly true of points of the tourism space that do not possess infrastructure (e.g. spas or museums) that would enable the counting of visitors. In these settlements, the number of visitors can only be deduced from the turnover of registered accommodation establishments. During the creation of the methodological apparatus, we should start with the special crypto-mobile characteristic feature that supposes that more intensive transit activity can be detected in settlements where some transit passengers stay in accommodation establishments. The hypothesis can also be formulated, as transit will be more intensive where some transit passengers stay a night; that is, peak points will mark the group of settlements involved in the phenomenon.
Methodological advances
Identifying settlements involved in transit using GIS techniques
The first step of the investigation was to identify the group of settlements that could be involved in transit. During the identification process, GIS techniques were applied. The following aspects were taken into account during the identification process:
a) If a transit passenger enters Hungary at any border crossing point, then he/she leaves the country at a border section other from which he/she arrived.
b) Based on the nature of transit, it is presupposed that transit passengers choose the route that offers the shortest travel time between the point of entrance and exit
Based on these conditions, the shortest travel times among all the border-crossing points2 of Hungary were calculated. Settlements along each route were sorted and
summed up. (It was suggested that not only settlements along roads but also neighbouring settlements could profit from transit. However, this phenomenon was regarded as exceptional and/or isolated; therefore, the original framework of the identification was considered to be adequate.) Based on the selection process, 956 out of the 3,152 settlements in Hungary were involved in the investigation; in other words, these settlements were regarded as potential crystallising points of transit. Further investigation was conducted among these settlements.
2 These include all border-crossing points included in the questionnaire applied by the HCSO called ‘Foreigners’
Exploring the role of tourism by expert judgement
The 956 settlements included in the study were categorised into three groups based on the expert’s judgement3 of the role of their tourist attractions. The first group
comprised settlements with international and national tourist attractions; the second group contained regional attractions; and the third group included settlements without significant tourist attractions.
Figure 1
Settlements included in the study based on their tourist attractions
Source: Edited by the authors.
3 We recognise that the introduction of the methodology of expert judgement for the evaluation of tourist
attractions would significantly exceed the scope of the present study; therefore, at this point, only the most important cornerstones of the evaluation process are presented. During the work, we started with the recommendations of the methodological manual (compiled by Gábor Michalkó and Tamara Rátz) for the systematic cataloguing and assessment of Hungary’s tourist attractions published in 2006 under the coordination of the Hungarian Tourism Ltd. The following factors were used for categorising tourist attractions: regulations (e.g. Act CXII of 2000 on the Adoption of the Spatial Plan of Lake Balaton Resort and the Lake Balaton Regional Development Rules), official databases (e.g. the OGYFI register of the National Public Health and Medical Officer Service), surveys and registers of the HCSO (e.g. number of guest nights and supply of spa and wellness hotels), ratings published by professional organizations (e.g. list of rated festivals by the Hungarian Festival Association) and websites of settlements. For instance, settlements were given international and national ratings if the guest turnover requiring accommodation was dominated by foreign demand and if they possessed the highest rankings in databases (e.g. settlements along the shore of Lake Balaton, spas, wellness hotels, and top-rated festivals). Other towns and villages were grouped into the category of settlements with regional tourist attractions that possessed lower rankings in the reviewed sources (e.g. towns located further away from Lake Balaton, settlements without a spa, but having medical water for bathing, festivals with good rankings). Settlements that were not included in the reviewed databases and did not identify tourist attractions on their homepages were grouped into the category of settlements without significant tourist attractions.
Road types
Motorways, dual carriageways Main roads
Categories
Settlements not involved in transit Settlements with international and national tourist attractions Settlements with regional tourist attractions
First, we wanted to find whether there are anomalies in which the tourism activity of a settlement significantly differs from its role deduced from the settlement’s tourist attractions.4 In order to analyse this, the revenues of accommodation establishments
of affected settlements were reviewed according to the categories of tourist attractions. Revenues between 2008 and 2011 are shown in Table 1.
Table 1
Number of settlements included in the study according to revenues and categories of tourist attractions
(number of settlements)
Category/revenues
(HUF) million 0–5 million5–25 million25–50 50–100 million 100–1000 million
Above 1000 million Sum total 1 (without significant tourist
attraction) 584 71 29 6 3 1 694
2 (regional
attraction) 45 25 17 17 31 5 140
3 (national or international
attraction) 14 7 12 7 53 29 122
Sum total 643 103 58 30 87 35 956
Source: Calculations by the authors.
The strength of the stochastic correlation between qualitative and quantitative variables is measured by association indices (Cramer 1946, Everitt 2002).
In this case, the independence of variables (X and Y) is measured by the following:
,
where pij=P(X=xi, Y=yj), i=1,2,….I, and j=1,2,…, J.
By the normalisation of Φ2, we get the following statistics (Davenport et al. 1991):
Pearson’s correlation:
Cramér's V:
4 When a settlement possesses international, national, or regional tourist attractions, then it is logical that the
volume and structure of guest turnover generated by it is different. However, when there is no attraction worth visiting, overnight guests staying in registered accommodation establishments use the primary tourism suprastructure of the settlement for other purposes. In our assumption, this activity is linked to transit.
= = ⋅ ⋅ − = Ψ I 1 i J 1According to our calculations based on the above theory P=0.35, T=0.21. In other words, only a moderate stochastic relationship has been found between the tourist attraction and the revenue. That is, it has been shown that there is no functional relationship between the role of tourist attractions and tourist revenues. In fact, only a loose stochastic relationship can be found.
Identifying settlements affected by transit
In most cases at the level of settlements, tourist attractions and revenues are proportional to each other, but significant anomalies can be observed (Table 2). Two directions of the differences between the variables above can be distinguished. In the first case, the tourist attraction is much greater than the revenue (blue colour), while in the second case, revenues are significantly higher than the tourist attractions (red colour). In this study, the latter group is dealt with in detail.
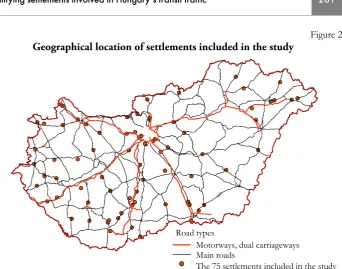
Seventy-five settlements have been found (Table 2 shows settlements without significant tourist attractions, where the revenue of accommodation establishments was over 25 million forints and settlements with a regional tourist attraction, where the above revenue was over 100 million forints), where unambiguously more revenue is realised than would be logical according to the paradigms of tourism (Michalkó 2012) based on the role of tourist attractions. Consequently, a group of settlements has been identified wherein a different behaviour can be observed as compared to conventional tourism.
Table 2
Grouping of settlements included in the study
Category/revenue (HUF) million0–5 million5–25 million25–50 50–100 million 100–1000
million
Above 1000 million
Sum total
1 (without significant
attraction) 584 71 29 6 3 1 694
2 (regional attraction) 45 25 17 17 31 5 140
3 (national or international
attractions) 14 7 12 7 53 29 122
Sum total 643 103 58 30 87 35 956
Figure 2
Geographical location of settlements included in the study
Source: Cdited by the authors.
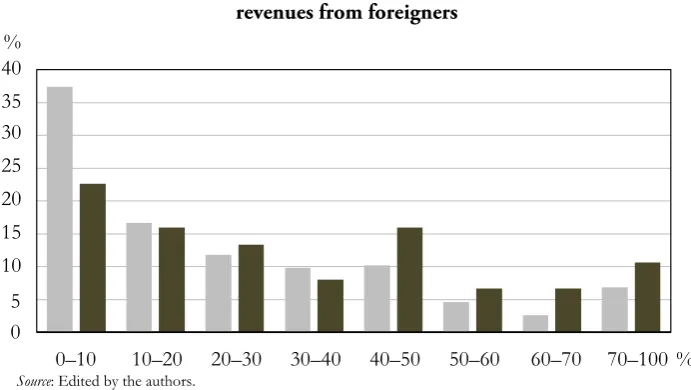
In order to successfully evaluate the special tourism geographic features of the 75 settlements involved in transit, all the settlements (956) included in the study were categorised into two groups. While one group (group 2) comprised the above 75 settlements, the other (group 1) contained the remaining 881 settlements. After that, the proportion of revenues from foreigners related to the potential transit passengers was examined (Table 3).
Table 3
Number of settlement groups according to the proportion of revenues from foreigners
Proportion of revenues from foreigners, %
Group
Total 1 2
0– 10 114 17 131
11– 20 51 12 63
21– 30 36 10 46
31– 40 30 6 36
41– 50 31 12 43
51– 60 14 5 19
61– 70 8 5 13
71–100 21 8 29
No revenue 576 0 576
Total 881 75 956
Source: Calculations by the authors.
Road types
Motorways, dual carriageways Main roads
[image:10.595.119.479.526.701.2]In the case of settlements belonging to the second group, proportions of revenues from foreigners are significantly higher. The percentage distribution of the two groups of settlements according to the proportions of revenues from foreigners shows that in some cases, revenues from foreigners are independent of the settlement’s tourist attractions. The reasons behind overnight stays can be traced back to other factors.
Figure 3
Percentage of settlements belonging to separate groups according to revenues from foreigners
Source: Edited by the authors.
Examining the probability of transit tourism with the logit model
With the help of the logit model, this part of the study further examines settlements that have been identified in the previous chapter as the crystallising points of transit tourism. Here, our aim was to identify qualities, properties and locations of settlements that may make transit tourism relevant and characteristics that increase the probability of transit tourism in a particular settlement.
Introduction of the logit model
In some examinations, the target variable is binary, that is, it has two possible values, such as survival or death, success or failure, etc. In these cases, it is almost natural to assume that the explanatory variables play a role in the probability of the result; therefore, the probability of the event can be regarded as the dependent variable. The basic idea of the logit model is the use of logit value of the probability as a dependent variable (Cramer 2003). The logit transformation maps the interval between 0 and 1 between negative and positive infinity. Its formula is the following:
logit (Y ) = ln ( Y / (1–Y ) ).
0 5 10 15 20 25 30 35 40
0–10 10–20 20–30 30–40 40–50 50–60 60–70
%
Thus, the regression equation is as follows: logit (Y) = β0+ β1X1+ β2X2+…..+ βrXr+ε
The notion of the odds ratio brings us closer to the understanding of the use of the logit models. The odds are defined as the quotient of two complementary probabilities. The odds ratio is the ratio of two odds. That is, it shows how the probability of an event would change if group A possessed the properties of group B. The exponential exponents of slopes in the above equation are the odds ratios (Cramer 2003).
Settlements involved in transit as reflected by the logit model
In this case, the binary target variable applies to transit tourism. The value is zero if the phenomenon is not detectable in the settlement and one where it is present (75 identified settlements). Naturally, we are aware that transit tourism in Hungary may not only be detectable in settlements identified in this study; however, the distinction between the two groups of settlements is still considered relevant, as impacts are much stronger in the case of the 75 settlements identified than in the rest of the settlements. The table below shows independent variables that try to explain the presence or absence of transit tourism at the settlement-level with the help of the logit model. It has been assumed that these are indicators in the official statistical practice that indicate the presence of the most important services, which play a major role in satisfying the demand induced by transit (i.e. the presence of a railway station is considered relevant and not transit going through the settlement). On the other hand, sets of indicators that indicate the presence of demand and services induced by freight traffic have also been included in the study. Lastly, it is important to examine the distance of settlements that are potentially involved in transit from some settlements playing a prominent role.
Table 4
Set of variables included in the study
The presence of an industrial park (yes–no), 2012
Capacity of public accommodation establishments (number of bed-places), 2011 Presence of a railway station (yes–no), 2011
Presence of a petrol station (yes–no), 2011
Number of active enterprises with 50–249 employees (including legal forms bound to transform and ceasing legal forms, during the year according to business demography), 2010 Number of active enterprises with 250–499 employees (including legal forms bound to transform and ceasing legal forms, during the year according to business demography), 2010 Number of active enterprises with 500 or more employees (including legal forms bound to transform and ceasing legal forms, during the year according to business demography), 2010 Distance from the district seat, 2012
Distance from the county seat, 2012
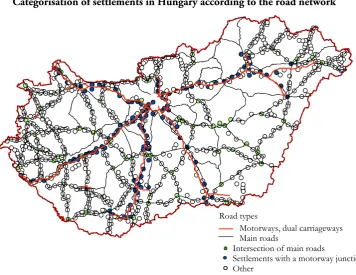
All of the above variables and their subclasses have been built in the model. According to our logit model, it can be concluded that the presence of petrol and railway stations and the proximity of county seats do not increase the odds of transit tourism in a settlement. Transit tourism does not depend directly on these variables, nor does it depend on other variables listed in the table. It has been found that the economic and demographic characteristics of settlements do not have a significant impact on the crystallising points of transit tourism. Therefore, it is assumed that the geographical position or location may play a greater role in transit tourism. After all, there is a strong correlation between the spatial distribution of settlements involved in transit tourism (Table 4.) and road junctions. The following figure shows different categories of settlements: category 1. presence of a motorway junction in the settlement, that is, a main road intersecting the motorway; category 2. intersection of main roads; and category 0. all other settlements (without special location in terms of road transport).
Figure 4
Categorisation of settlements in Hungary according to the road network
Source: Edited by the authors.
Table 1, which shows the categorisation of settlements included in the study according to revenues and tourist attractions, has been split up according to the above categories of intersections (settlements having a motorway junction, settlements
Road types
Motorways, dual carriageways Main roads
Intersection of main roads
where main roads intersect and settlements without special location in terms of road transport):
Table 5
Settlements with a motorway junction according to the categories of tourist attractions and revenues of accommodation establishments
Category/revenue,
million HUF 0–5 6–25 26–50 51–100 101–1000 1001+ Total
1 (without significant
attraction) 47 5 5 4 2 1 64
2 (regional attraction) 9 1 1 1 7 2 21
3 (national or international
attraction) 4 2 18 14 38
Total 60 6 8 5 27 17 123
Source: Edited by the authors.
Table 6
Settlements located at intersections of main roads according to the categories of tourist attractions and revenues of accommodation establishments
Category/revenue,
million HUF 0–5 6–25 26–50 51–100 101–1000 1001+ Total
1 (without significant
attraction) 14 5 2 – 1 – 22
2 (regional attraction) 4 2 3 2 9 2 22
3 (national or international
attraction) 2 1 1 9 9 22
Total 20 8 6 2 19 11 66
[image:14.595.113.489.567.704.2]Source: Edited by the authors.
Table 7
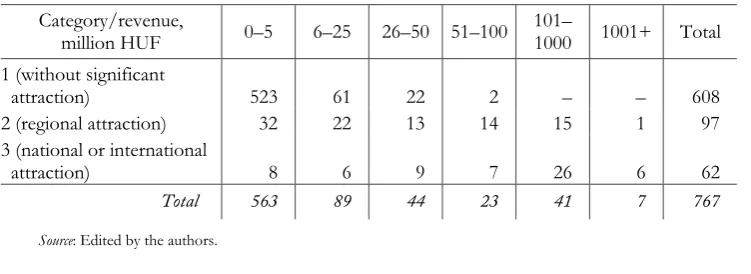
Settlements without special location in terms of road transport according to the categories of tourist attractions and revenues of accommodation establishments
Category/revenue,
million HUF 0–5 6–25 26–50 51–100 101–1000 1001+ Total
1 (without significant
attraction) 523 61 22 2 – – 608
2 (regional attraction) 32 22 13 14 15 1 97
3 (national or international
attraction) 8 6 9 7 26 6 62
Total 563 89 44 23 41 7 767
This means that invisible tourism can be detected in 5.2% of the settlements belonging to category 0 (without special location in terms of road transport), while this figure is 17.1% for category 1 (motorway junction) and 21.2% for category 2 (intersection of main roads).
Our logit model has been modified according to these findings, so that only two variables are used to explain the presence or absence of invisible tourism in a particular settlement. One of the variables is the above-mentioned node character (the value is 1 if there is a motorway junction in the settlement, that is, a main road intersects the motorway or the settlement, while the value is zero in all other cases), and the other is the distance from the Austrian border (the range between the minimum and maximum values was divided into five equal parts, and settlements were given values from 1 to 5 on a ratio scale), as this direction is assumed to be the greatest in volume because of Europe’s east-west divide and flow of guest workers.
Variables selected for the model are significant, but the explanatory power of the model is not too strong. This is indicated by Nagelkerke’s R2 and Cox and Snell’s R2
[image:15.595.144.444.390.427.2](Cramer 2003).
Table 8
Tests of the fit of the logit model
Test Cox and Snell’s R2 Nagelkerke’s R2
Value 0.061 0.136
Source: Edited by the authors.
The results of the model are summarised in the following table, where exp(B) is the partial odds ratio, whereas the Wald column is suitable for testing the Wald statistics.
Table 9
Results of the logit model
Variables B Wald Exp(B)
Distance from the Austrian
border 0.271 6.451 1.311
Node character 1.851 51.057 6.366
Source: Edited by the authors.
In the output of the logistic regression, the Wald statistics, which are analogous with the t-test of linear regression, have also been indicated.
According to our results (Table 9.), the node character of the road network has a partial odds ratio of 6.366. That is, if the distance from the Austrian border is kept constant, then the odds of invisible tourism increase by 6.4 times on average if a settlement is located on an intersection.
[image:15.595.109.484.493.567.2]are changed in none of the settlements), then with the increase in the variable of the distance from the Austrian border, the odds of invisible tourism increase by 31% on average.
The Austrian neighbourhood or the proximity of Austria alone increases transit tourism only slightly in these settlements. That is, when persons travel through Austria, it is likely that they will not stay in Hungary, or if they do, then they do not stay only near the border where accommodation is presumably more expensive.
The distance from the Austrian border was replaced in our logit model with the distances from the Slovenian, Croatian, Serbian, Romanian, Ukrainian and Slovak borders. In these cases, the presence or absence of invisible tourism in a settlement is also explained by two variables. One of the variables is the distance from the above countries, while the other is the previous node character. The distances of borders are also measured on a ratio scale. The range between the minimum and maximum values was divided into five equal parts, and settlements were given values from 1 to 5.
The explanatory power of the models is still poor (Appendix 1). Based on these results (see below), it can be stated that, regardless of the models, the odds of transit tourism increase by 5.7–6.3 times when the settlement is situated at a junction of roads. In addition, the distance from the Austrian border has the strongest explanatory power. The proximity of other borders has poor explanatory power (Appendix 2.). The reason for this is probably that Hungary is linked to Germany and Austria (the most important countries for Hungary within the EU in terms of trade) through this border, and transit traffic from and to these countries is significant. On the other hand, Romanians and Bulgarians, who make up one-third and 9% of the transit traffic in Hungary, also cross this border section (HCSO 2013). Their main purpose is to work in Western Europe. As a result, the significance of this border section is increased by the transit traffic of both Hungarians and other nations.
Effects of transit traffic on regional development
In the following part of the study, we examine whether the phenomenon of transit can have a detectable effect on the level of development and processes of settlements. According to our hypothesis, it naturally can; however, the degree of the impact depends on several factors. It must be noted that transit depends on, first, the level of development of the neighbourhood of the settlement and, second, the level of development of the particular settlement. In our opinion, the impact of transit tourism on the level of development of a particular settlement is much more limited when the settlement is located in a developed neighbourhood and is relatively developed, as opposed to the degree of the economic impact on relatively underdeveloped settlements located in peripheral neighbourhoods.
The Local Moran statistics are suitable for showing areas that are similar to or different from their neighbours. The bigger the Local Moran I value, the closer the spatial similarity. However, in case of negative values, we may conclude that the spatial distribution of the variables is close to a random distribution. Concerning the Local Moran I, calculations were performed in order to get the per capita income for 2012. During our work, the results of the Local Moran statistics were compared with the initial data in order to examine whether the high degree of similarity was caused by the concentration of the high or low values of the variable (Moran Scatterplots). First, the standardised values of the observation units were plotted on the horizontal axis of the graph, whereas the corresponding standardised Local Moran's I values (average neighbour values) were plotted on the y-axis. The scatterplot places the municipalities into four groups according to their location in the particular quarters of the plane:
1. High–high: area units with a high value, where the neighbourhood also has a high value.
2. High–low: area units with high value, where the neighbourhood has a low value. 3. Low–low: area units with low value, where the neighbourhood also has a low
value.
4. Low–high: area units with low value in which the neighbourhood has a high value.
The odd-numbered groups show a positive autocorrelation, while the even-numbered groups a negative one.
Calculations were made using the GeoDa software. The neighbourhood was defined by using Euclidean distance. The threshold distance was set to a minimal distance, which ensured that each municipality had at least one neighbour. The Local Moran's I calculations were performed by using the EB rates module, as this module is able to perform calculations on specific data with regard to the differences in the orders of magnitude of territorial units. The event variable was the per capita income, while the base variable was the population of the municipalities. This was necessary in order to resolve the problem of huge differences in the order of magnitude of Hungarian settlements and ensure the accuracy of the calculation.
The colouring (representing the economic power) of the 75 settlements was done according to the per capita income level as a percentage of the rural average. The figure shows that the settlements included in the study are located in different regions and have different economic conditions; therefore, the role of transit tourism in their economy varies from settlement to settlement.
Figure 5
Local similarity of the per capita income and level of development of the selected settlements, 2012
Source: Edited by the authors.
The rest of the study focuses on the question of whether the impact of transit can be confirmed and/or quantified in the level of development of the settlements potentially involved in transit. This was examined using a shift-share analysis. The literature on this method is quite substantial, and there are also numerous works in the field of tourism (Houston 1967, Stevens–Craig 1980, Selting–Loveridge 1992, Andrikopolous–Carvalho 1990, Fuchs–Rijken–Peters–Weiermair 2000, Sirakaya– Choi–Var 2002, Toh–Khan–Lim 2004, Yasin–Alavi–Sobral–Lisboa 2004). Our research was based on these works; therefore, detailed description of the method and introduction of different approaches are not included in this paper.
The aim of our shift-share analysis was to examine to what extent the industrial output of a particular settlement determines the per capita income conditions in the year2012 (which can be regarded as the level of development of settlements) and
what role do other local factors play, which are only connected to geographical location.
During the shift-share analysis, data were grouped according to two dimensions. The first is the geographical dimension. In this case, the already used categorisations were applied. The first group comprised settlements that are potentially not involved in transit: they do not belong to the group of identified settlements. All settlements belonging to the following groups are potentially involved in transit; therefore, they are not mentioned here again. The second group included settlements that do not possess significant tourist attractions. The third included settlements that do not possess significant tourist attractions, but due to some reasons described earlier in this paper, are probably involved in transit. Settlements in the fourth group possess regional tourist attractions but are not involved in transit. The fifth group contained settlements that possess regional tourist attractions and are involved in transit. Finally, settlements with national or regional tourist attractions were placed in the sixth group.
The second dimension was created according to the industrial output of a particular settlement. The figures of per capita business tax were examined, and settlements were categorised into five groups based on the most significant brake points of the data series.
The research question during the investigation was the following: to what extent do the economic (industrial) output and other local factors (some of them including the potential role of transit) explain the level of development of settlements?
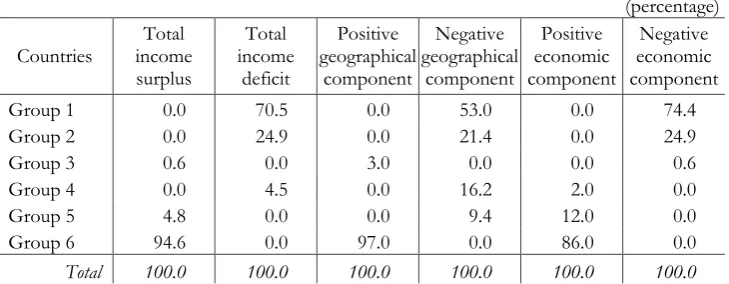
In Table 10, all income surplus columns have a value of 100 for groups of settlements that are more developed than the national average, whereas they have a value of –100 if settlements are less developed. The income surplus/deficit can be divided into two parts. The geographical component refers to the degree of the role of local processes connected to the groups of settlements in the total income surplus or deficit. The economic component refers to the extent of the role of the local industry in the level of development.
Table 10
Components of income surplus or deficit, 2012
(percentage)
Groups of settlements surplus/deficit Total income Geographical Economic
Group 1 –100 –28 –72
Group 2 –100 –31 –69
Group 3 100 169 –69
Group 4 –100 –131 31
Group 5 100 –72 172
In general, it can be concluded that the role of the economic component is somewhat more important than that of the geographical one, as the absolute values of the economic component are bigger than those of the geographical component in case of the three groups. However, the case is the opposite in groups 3 and 5, which are the most interesting to our research. In the group of settlements that do not possess tourist attractions but are involved in transit (Group 3), the level of development in comparison with the national average is primarily due to the geographical location, that is, their involvement in transit. On the other hand, in case of settlements that possess regional tourist attractions and are involved in transit (Group 5), the relatively higher level of development (although they are less developed than the national average) is not due to the geographical location but the economic conditions.
Table 11
Components of changes in expenditure, 2012
(percentage)
Countries income Total
surplus
Total income
deficit
Positive geographical
component
Negative geographical
component
Positive economic component
Negative economic component
Group 1 0.0 70.5 0.0 53.0 0.0 74.4
Group 2 0.0 24.9 0.0 21.4 0.0 24.9
Group 3 0.6 0.0 3.0 0.0 0.0 0.6
Group 4 0.0 4.5 0.0 16.2 2.0 0.0
Group 5 4.8 0.0 0.0 9.4 12.0 0.0
Group 6 94.6 0.0 97.0 0.0 86.0 0.0
Total 100.0 100.0 100.0 100.0 100.0 100.0
Table 11 shows the above-mentioned facts in detail. It can be seen how small the income surplus of Group 3 is in national comparison and how small is the contribution of transit tourism to this surplus. In contrast, our initial hypothesis proved to be true, as the contribution of transit to the local economic conditions and processes can clearly be detected; therefore, its role may not only be important in Hungary but also in settlements with similar economic conditions located in other countries.
Conclusions
providers build their business on transit traffic. In order to eliminate these towns and villages from destinations involved in traditional tourism, factors that reliably indicate the probability of the presence of transit tourism should be explored.
The study took two methodological approaches. First, a GIS-based delineation was made, and groups created by this method were examined according to their statistical characteristics. Settlements involved in transit were identified partly with the help of this model and the logit model, which took into account additional features. It was presupposed that a foreign transit passenger also stays in a settlement, where no significant tourist attraction can be found; therefore, in this case, their stay is due to the favourable location of the settlement. Thus, when the percentage of guest nights spent by foreigners is above average in a settlement situated at the intersection of the shortest routes between border-crossing points, despite the fact that there is no significant tourist attraction, then the presence of transit can be presumed. Seventy-five settlements were identified that satisfied the above criteria; therefore, further examinations were carried out among these settlements.
With the help of the logit model, we sought factors that influence or presume the presence of transit traffic coupled with an overnight stay in a settlement. We concluded that obvious objects, such as a border-crossing point or petrol station, play only a minor role in generating transit coupled with an overnight stay. However, a transport hub situated at the intersection of a main road and a motorway or two main roads has a significant impact on overnight stays. When a settlement has a motorway junction or is situated at an intersection of main roads, the probability of its involvement in transit increases by 17.1% and 21.2%, respectively. Among the factors contributing to the interruption of a transit trip, the proximity of the border plays a minimal role. Only in the case of the Austrian border section, we detected that the distance between the intersection and the border is inversely proportionate to the probability of an overnight stay; consequently, the demand for accommodation establishments suitable for the interruption of transit increases near the Austrian border.
In sum, it can be concluded that in the transit traffic of foreigners arriving in Hungary, a prominent role is played by settlements that
– are located at the intersections of roads, enabling the shortest travel time
between different border sections;
– possess a motorway junction; and
– are situated at the intersection of two main roads.
The proximity of borders can stimulate the interruption of a transit trip more strongly than the average only in the case of the Austrian border; therefore, the odds of settlements located in the affected zone to become a part of transit traffic are higher.
It seems probable that behind these results, an important psychological factor of the nature of transit can be found: intersections and transport hubs are seen as prominent stations during the trip, representing the fulfilment of the desire to reach a place, the completion of a stage (deserved rest) and a place for preparing for the next stage. Naturally, psychological factors mingle with rational ones, which can be observed in the involvement of settlements near the border between Hungary and Austria, as transit passengers prefer to stay at Hungarian accommodation establishments due to the more favourable price-quality ratios.
Acknowledgements
This research was supported by the Hungarian Scientific Research Fund under the OTKA K 100953 project (Invisible tourism in Hungary) and by the János Bolyai Research Scholarship of the Hungarian Academy of Sciences.
REFERENCES
ACHEN,M.–KLEIN,K. (2002): Retail trade in transit areas: introduction to a new field of
research Die Erde 133 (1): 19–36.
ANDRIKOPOLOUS,A.–BROX,J.–CARVALHO,E. (1990): Shift-share analysis and the potential
for predicting regional growth patterns: some evidence for the region of Quebec,
Canada Growth and Change 21(1): 1–10.
ANSELIN,L. (1995): Local indicators of spatial association – LISA Geographical Analysis 27(2):
93–115.
BAKIC, O (1988): Yugoslavian tourism: strategic planning of destination product Tourism
Management 9 (2): 145–151.
BALÁZ, V.–MITSUTAKE, M. (1998): Japanese tourists in transition countries of Central
Europe: present behaviour and future trends Tourism Management 19 (5): 433–443.
BULIS,A.–SKAPARS,R. (2013): Development of international freight transit in Latvia Procedia
– Social and Behavioral Sciences 99 (6): 57–64.
CASTAÑEDA, X.–RUIZ RUELAS, M.–FELT,E.–SCHENKER, M. (2011): Health of Migrants:
Working Towards a Better Future Infectious Disease Clinics of North America 25 (2):
421–433.
CRAMER,H. (1946): Mathematical Methods of Statistics Princeton University Press, Princeton.
CRAMER,J.S. (2003): Logit Models from Economics and Other Fields Cambridge University Press,
Cambridge.
DACYL, J. (2002): International responses to refugee flow from the former Yugoslavia
Migration 36–38: 75–110.
DAVENPORT,E.–EL-SANHURY,N. (1991). Phi/Phimax: Review and Synthesis Educational and
Psychological Measurement 51 (4): 821–828.
DE BORGER, B.–COURCELLE, CH.–SWYSEN, D. (2004): Optimal pricing of transport
externalities in an international environment: some empirical results based on a
DEMARIA HARNEY, N. (2011): Accounting for African migrants in Naples, Italy Critical
Perspectives on Accounting 22 (7): 644–653.
ERDŐSI,F. (2005): Oroszország nemzetközi közlekedési infrastuktúráinak kényszerei, globális
és regionális szerepei Tér és Társadalom 19 (1): 1–20.
EVERITT, B. S. (2002) The Cambridge Dictionary of Statistics Cambridge University Press,
Cambridge.
FIELDING,G. (1995): Congestion pricing and the future of transit Journal of Transport Geography
3 (4): 239–246.
Fleischer T. (2007): Transzeurópai folyosók: a meglévők hosszabbítgatása vagy egy
összeurópai hálózat kialakítása? In. GLATZ,F. (szerk.): Balkán és Magyarország: váltás
a külpolitikai gondolkodásban pp. 365–379., MTA Társadalomkutató Központ Európa Intézet, Budapest.
FROMHOLD-EISEBITH, M. (2007): Konfliktfeld Alpentransit : Grenzen der
Verkehrsentwicklung am Beispiel Österreichs und der Schweitz Geographische
Rundschau 59 (5): 36–42.
FUCHS, M.–RIJKEN, L.–PETERS, M.–WEIERMAIR, K. (2000): Modelling Asian incoming
tourism: a shift-share approach Asia Pacific Journal of Tourism Research 5 (2): 1–10.
GREEN,F. (1978): Recreation vehicles Annals of Tourism Research 5 (4): 429–439.
HALL, P.–LANDIS, J.–CERVERO, R. (1991): Transit joint development in the USA: An
inventory and policy assessment Environment and Planning: C. Government and Policy.
9 (4): 431–452.
HOUSTON,D.B. (1967): The shift and share analysis of regional growth: a critique Southern
Economic Journal 33(4): 577–581.
JOHNSON,M. (1995): Czech and Slovak tourism: patterns, problems and prospects Tourism
Management 16 (1): 21–28.
KALAS, GY. (1992): A déli tranzitautópálya csak alibi. Javaslat a déli tranzitautópálya
hatásvizsgálataihoz, megvalósíthatósági tanulmány ÖKO – Ökológia, környezet-
gazdálkodás, társadalom 3 (2): 30–38.
KERSCHNER, H.–PETROVITSCH, H. (1998): Alpentransit auf der Schiene - das Beispiel
Brennerachse Geographische Rundschau 50 (10): 580–586.
KNOWLES,R. (2012): Transit oriented development in Copenhagen, Denmark: from the
Finger Plan to Ørestad Journal of Transport Geography 22 (5): 251–261.
KRAUS,M. (1991): Discomfort externalities and marginal cost transit fares Journal of Urban
Economics 29 (2): 249–259.
KSH (2013): Jelentés a turizmus 2012. évi teljesítményéről KSH, Budapest.
LETTRICH,E. (1970): Ausztria In: MAROSI S.–SÁRFALVI B. (szerk.) Európa Gondolat Kiadó,
Budapest.
MA,X.–WU,Y.–WANG,Y.–CHEN,F.–LIU,J. (2013): Mining smart card data for transit riders’
travel patterns Transportation Research Part C 36 (11): 1–12.
MICHALKÓ,G. (2012): Turizmológia Akadémiai Kiadó, Budapest.
PRÓBÁLD, Á. (szerk.) (2002): Proceedings of the Sixth International Forum on Tourism Statistics
RUPPERT,L. (2007): Az EU délkeleti irányú közlekedésének Magyarországot érintő hatásai In.
GLATZ, F. (szerk.) Balkán és Magyarország: váltás a külpolitikai gondolkodásban pp.
357–363, MTA Társadalomkutató Központ Európa Intézet, Budapest.
SEEKINGS,J. (1993): Gibraltar: developing tourism in a political impasse Tourism Management
14 (1): 61–67.
SELTING, A. C.–LOVERIDGE, S. (1992): A Summary of the Literature on Shift-Share Analysis
Department of Agricultural and Applied Economics University of Minnesota College of Agriculture St. Paul, Minnesota USA.
SIRAKAYA,E.–CHOI,H.S.–VAR,T. (2002): Shift-share analysis in tourism: examination of
tourism development change in a region Tourism Economics 8 (3): 303–324.
STEVENS,B.H.–MOORE,C.L. (1980): A critical review of the literature on shift-share as a
forecasting technique Journal of Regional Science 20(4): 419–437.
TOH,R.S.–KHAN,H.–LIM,L.-L. (2004): Two-stage shift-share analyses of tourism arrivals
and arrivals by purpose of visit: the Singapore experience Journal of Travel Research
43(1): 57–66.
VITON,P. (1992): Consolidations of scale and scope of urban transit Regional Science and Urban
Economics 22 (1): 25–50.
WILLIAMS, A–BALÁZ, V. (2009): Low-cost carriers, economies of flows and regional
externalities Regional Studies 43 (5): 677–691.
YASIN, M.–ALAVI, J.–SOBRAL, F.–LISBOA, J. (2004). A shift-share analysis approach to
understanding the dynamic of the Portuguese tourism market Journal of Travel and
Appendix 1
Countries Cox and Snell’s R2 Nagelkerke’s R2
Austria 0,061 0,136
Croatia 0,056 0,123
Romania 0,054 0,120
Serbia 0,057 0,126
Slovakia 0,054 0,119
Slovenia 0,054 0,119
Ukraine 0,054 0,119
Total 0,070 0,154
Appendix 2
Variables B Wald Exp(B)
Distance from the Croatian
border 1,821 50,313 6,180
Character –0,133 1,578 0,875
Distance from the Romanian
border 1,807 49,179 6,089
Character –0,060 0,354 0,942
Distance from the Serbian
border 1,739 44,599 5,691
Character –0,183 2,892 0,833
Distance from the Slovak
border 1,833 49,932 6,256
Character 0,030 0,074 1,030
Distance from the Slovenian
border 1,823 50,570 6,190
Character –0,008 0,007 0,992
Distance from the Ukrainian
border 1,833 50,498 6,251