Quantitative Relation between Mn and S for Mechanical Properties
of Flake Graphite Cast Iron
+1Toshitake Kanno
+2and Ilgoo Kang
Kimura Chuzosho Co., Ltd., Sunto-gun, Shizuoka 411-0905, Japan
We investigated the effects of Mn and S on the mechanical properties offlake graphite cast iron in detail, specifically, hardness, tensile strength, elongation, impact value, deflection, and transverse load. We also investigated the cause. With increasing Mn amount for a constant S content, a transition point appears for each mechanical property. That is, hardness, tensile strength and transverse load become the smallest, and elongation, impact value and deflection become the largest. The mechanical properties offlake graphite are determined by the intervention of four actions; MnS nucleation action, interfacial energy action of soluble S, action of soluble S and soluble Mn to eutectic solidification temperature and pearlitization action of soluble S and soluble Mn. These four actions are thought to be negated by the formation MnS, resulting in the presence of the transition points. In addition, Mn and S amount showing the transition point demonstrate the best type A graphite shape. With increasing Mn amount for various S content, many transition points appear. When these points are connected, a new transition point appears near S0.03%and Mn0.32%. Excellent mechanical properties are seen at this new transition point. That is, hardness and tensile strength become the highest, and elongation and impact value which conflict with these properties also become the highest. At this new transition point (0.03%S, 0.32%Mn), MnS just starts to form ([S]©[Mn]=0.01), and soluble S is the highest. Here, [S] means soluble S and [Mn] soluble Mn. Consequently, inflake graphite cast iron, the best excellent properties are obtained at S0.03%and Mn0.32%, which is just before MnS formation. [doi:10.2320/matertrans.F-M2014831]
(Received May 7, 2014; Accepted August 1, 2014; Published October 25, 2014)
Keywords: cast iron, mechanical properties, manganese, sulfur, MnS, soluble manganese, soluble sulfur, transition point
1. Introduction
The effect of sulfur (S) in flake graphite cast iron has been discussed from four kinds of viewpoint as follows; (a) viewpoint of graphite nucleation,13) (b) viewpoint of mechanical property,1,4) (c) viewpoint of interfacial energy between growing graphite and liquid,59) (d) viewpoint of eutectic solidification temperature.1012)
With the viewpoint of graphite nucleation, Horie studied on gray cast iron,1)Horie2)and Igarashi3)studied on ductile iron. Both studies confirm that there is sulfide at the core of the graphite. Therefore, if sulfur amount decreases extremely, graphite nucleation ability becomes lower in gray cast iron and in ductile iron.
Nakae discusses from the viewpoint of mechanical property.4) According to Nakae’s study, the Relative Hard-ness becomes the smallest on the following equation condition; Mn% =1.7©S% +0.3. (Here, Relative Hard-ness was suggested factor by Patterson13)that it should be the smallest in the best material.) Horie reported that chill depth becomes the smallest on the following equation condition; Ce(added amount)% =2©S(base iron)%.1)
The effect of sulfur (S) which has been discussed from the viewpoint of interfacial energy between growing graphite and liquid is as follows. In the case of extremely high S amount in gray cast iron, S segregates on the interface between solid and liquid, and hinders the eutectic cell growth, so graphite shape becomes undesirable one. In the case of optimum S amount, as S adheres to the graphite prism plane and the interfacial energy between growing graphite and liquid decreases, so graphite tip sticks into melt and grows easily during the eutectic cell growth. Therefore, graphite branching
decreases and type A graphite forms. In the case of extremely low S amount, as the interfacial energy between growing graphite and liquid increases, austenite grows easily during the eutectic cell growth. Therefore, graphite branching happens easily and type D graphite forms.8,9) From these results, it can be inferred that there is an optimum amount of Mn and S in gray cast iron.
Kanno discusses from the viewpoint of eutectic solid-ification temperature.1012) According to Kanno’s study, in almost all the cases, graphite eutectic temperature (TEG), cementite eutectic temperature (TEC) and the difference between them (DTE) change linearly with increasing the amount of element. However, in the case of S or sulfide forming elements such as Mn or RE, they do not change the temperatures linearly but show a transition point.
As mentioned above, there are many studies on the interaction between S and sulfide forming elements. How-ever, as for the effect on the mechanical property, there is only one study, that is Nakae’s study.4) In this paper, we investigated the effects of Mn and S on the mechanical properties of gray cast iron in detail, specifically, hardness, tensile strength, elongation, impact value, deflection and transverse load. We also investigated the optimum amount of Mn and S in gray cast iron.
2. Experimental Procedure
Table 1 shows the target chemical compositions of this experiment. The basic composition is as follow: C3.2%, Si1.7%, Mn0.75%, P0.07%, S0.05%. By using 3000 Hz induction furnace, we made 50 kg cast iron melt. Withfixing the S content of the melt as 0.010%, 0.020%, 0.025%, 0.030%, 0.050%, 0.100%, 0.200%, 0.300%, we changed Mn content respectively. After holding the melt at 1400°C in the furnace, with inoculating 0.2% simultaneously, we poured the melt into the following test piece (T.P); (a) diameter +1This Paper was Originally Published in Japanese in J. JFS85(2013) 414
419.
+2Corresponding author, E-mail: kanno@kimuragrp.co.jp
30©high 300 mm T.P for tensile test, (b) diameter 30©high 600 mm T.P for transverse test, (c) T.P for Emission Spectrochemical Analysis.
With diameter 30©high 300 mm T.P, we did tensile test, Brinell hardness test and Sharpy impact test (Non-Notch). In the tensile test, in order to measure elongation value precisely, we attached strain gauge to the tensile T.P (Diameter 20 mm, Parallel length 20 mm), as shown in Fig. 1(a). With diameter 30©high 600 mm T.P, we did transverse test, and measured transverse load and deflection. 3. Experimental Results
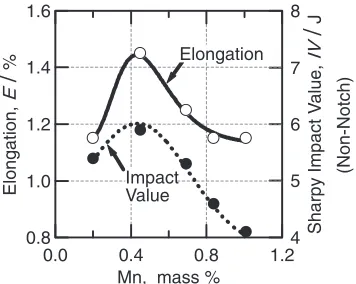
Figures 2³4 show the relationship between Mn% and mechanical properties (hardness, tensile strength, elongation, impact value, deflection and transverse load) for S0.05 samples.
[image:2.595.51.274.68.488.2]In all the graphs, a transition point appears on 0.45%Mn. Tensile strength and transverse load which are generally in proportion to hardness become the smallest at this transition point. To the contrary, elongation, impact value and deflection which are generally in inverse proportion to hardness become the largest.
[image:2.595.335.517.74.213.2]Figure 5 shows the relationship between Mn% and microstructure for S0.05 sample of diameter 30©high 300 mm T.P. Here, [S%] means a soluble S amount calculated with eq. (5) (discussed later in Sec. 4.1). In the case of 0.2% Mn (a), due to the high [S%], the eutectic cell growth is hindered, so graphite shape becomes bad. To explain clearly this phenomenon, the microstructure for 0.30%Mn and 0.3%S is shown in Fig. 6.12) Due to the extremely high [S%], the eutectic cell growth is hindered and graphite grows in a large curve. In addition, as the eutectic cell growth is hindered, much steadite are seen between eutectic cells and micro-shrinkages are also seen, in spite of common amount Table 1 Target chemical composition (mass%).
Sample
No. C Si Mn P S
S0.01 3.2 1.7 0.05³0.90 0.07 0.01
S0.02 3.2 1.7 0.05³0.90 0.07 0.02
S0.025 3.2 1.7 0.05³1.00 0.07 0.025
S0.03 3.2 1.7 0.05³1.15 0.07 0.03
S0.05 3.2 1.7 0.20³1.00 0.07 0.05
S0.10 3.2 1.7 0.20³2.00 0.07 0.10
S0.20 3.2 1.7 0.20³2.00 0.07 0.20
S0.30 3.2 1.7 0.30³2.60 0.07 0.30
(a) Shape of tensile test piece and strain gauge position (unit: mm)
140000
120000
100000
80000
60000
40000
20000
0
Stress, N
1.5 1.0
0.5 0.0
Strain, %
Inoc. :0.3% TS: 340MPa
Inoc. :0.2% TS: 306MPa Inoc. :0.1% TS: 290MPa Inoc. :0%
TS: 260MPa
(b) Example of stress-strain curve (Inoc.: Inoculation, TS: Tensile strength)
Strain gauge
20
50
D 20 D 25
Fig. 1 Elongation measurement and example of measured results.
360
340
320
300
280 T
e
nsile strength,
TS
/
MPa
1.2 0.8
0.4 0.0
Mn, mass % 240
220
200
180
160
Brinell Hardness, HB (10/3000)
Tensile strength Hardness
Fig. 2 Relationship between Mn%and hardness and tensile strength for S0.05 samples.
10
8
6
4
2
0
Deflection,
D
/
mm
1.2 0.8 0.4 0.0
Mn, mass %
20000
18000
16000
14000
12000
10000
T
ransverse load,
TL
/
N
Deflection
Transverse load
Fig. 4 Relationship between Mn%and deflection and transverse load for S0.05 samples.
8
7
6
5
4 Sharpy Impact V
alue,
IV
/
J
1.2 0.8
0.4 0.0
Mn, mass % 1.6
1.4
1.2
1.0
0.8
Elongation,
E
/
%
(Non-Notch)
Elongation
Impact Value
[image:2.595.47.292.84.228.2] [image:2.595.340.518.262.404.2] [image:2.595.71.235.335.481.2] [image:2.595.349.507.452.595.2]of 0.07% P. In the case of 0.45% Mn (Fig. 5 (b)), graphite shape becomes A-type and graphite grows in a moderate curve. In the case of more Mn addition (Fig. 5 (c) and Fig. 5 (d)), graphite shape becomes E-type and D-type, and graphite becomes linear. From Fig. 5, it can be said that an optimum [S%] is necessary in gray cast iron.
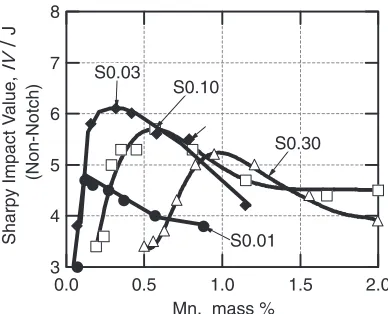
Figures 7³10 show the relationship between Mn% and mechanical properties (hardness, tensile strength, elongation and impact value) for various S content samples. Like as in Fig. 2³ in Fig. 4, some transition points appear with increasing Mn amount, in all the graphs. Hardness and tensile strength become the smallest at the transition point. To the contrary, elongation and impact value become the largest at the transition point. Focusing on the transition points, as S content increases, the transition point shifts to the right. The mechanical properties become good abruptly up to 0.03%S but become gradually bad if S content exceeds 0.03%.
Figure 11 shows the influence of Mn and S contents on tensile strength transition points, which are arranged from the data of Fig. 8. By connecting all the transition points, a new transition point appears near S0.03%, Mn0.032%. The same tendency is shown in all the mechanical properties, by connecting all the transition points.
As shown in Fig. 2³Fig. 4 and in Fig. 7³Fig. 10, if Mn content increases on a constant S content, a transition point appears. With increasing Mn amount for various S content, many transition points appear. By connecting all the transition points, a new transition point appears near S0.03%, Mn0.32%. At the new transition point, the graphite shape becomes the best type A. In addition, hardness and tensile strength become the highest, and elongation and impact value which conflict with these properties also (a) 0.20%Mn, HB229 ([S%]=0.050%) (b) 0.45%Mn, HB208 ([S% ]=0.025%)
(c) 0.69%Mn, HB210 ([S%]=0.016%) (d) 0.84%Mn, HB217 ([S%]=0.013%)
100µm
Fig. 5 Relationship between Mn%and micro-structure for S0.05 sample ([S%]:Calculated soluble S using eq. (5)).
(a) 0.3%S, 0.3%Mn ([S%]=0.16%) (b) Matrix structure of (a)
100µm
Fig. 6 Relationship between Mn% and microstructure for 0.30%S12)
([S%]:Calculated soluble S using eq. (5)).
240
230
220
210
200
190
Brinell hardness, HB (10/3000)
2.0 1.5
1.0 0.5
0.0
Mn, mass % S0.30 S0.03
S0.01
S0.10
Fig. 7 Relationship between Mn%and hardness for various S samples.
1.6
1.4
1.2
1.0
0.8
Elongation,
E
/
%
2.0 1.5
1.0 0.5
0.0
Mn, mass % S0.10
S0.30 S0.01
S0.03
Fig. 9 Relationship between Mn%and elongation for various S samples.
340
320
300
280
260
T
ensile strength,
TS
/
MPa
2.0 1.5
1.0 0.5
0.0
Mn, mass %
S0.10
S0.30 S0.03
S0.01
[image:3.595.49.291.67.316.2] [image:3.595.330.520.71.227.2] [image:3.595.328.524.267.423.2] [image:3.595.334.519.473.630.2]become the highest. Because all the mechanical properties become excellent, we can consider that this transition point (0.03%S, 0.32%Mn) shows the most excellent combination between Mn and S content.
Figure 12 shows the relationship between Mn%and S%at the transition points. Up to 0.05%S, there is a relationship between Mn% and S% at the transition points, Mn(%)= 9.4S(%). If S exceeds 0.05%, there is a relationship between Mn% and S% at the transition points, Mn(%)=1.7S(%)+ 0.4. This relationship, Mn(%)=1.7S(%)+0.4, is nearly same as that of Nakae (Mn(%)=1.7S(%)+0.3) which was obtained from the viewpoint of mechanical property, and is also the same as that of Kanno (Mn(%)=1.7S(%)+0.4) which was obtained from the viewpoint of eutectic solid-ification temperature.10)
4. Discussions
As shown in Fig. 2³Fig. 4 and in Fig. 7³Fig. 10, if Mn content increases on a constant S, a transition point appears. With increasing Mn amount for various S compositions, many transition points appear. As shown in Fig. 11, by connecting all the transition points, a new transition point appears near S0.03%, Mn0.32%. It is thought that the transition point appears due to the interaction between [S] and [Mn]. The detail explanations are as follows.
4.1 Calculation method for [S%] and [Mn%]
Okada investigated, if in gray cast iron MnS forms or not on the microstructure. As shown in Fig. 13, Okada confirmed that MnS does not form on the condition of S%©Mn%< 0.01%.14) From this relationship, the critical point forming MnS becomes eq. (1) ([S%]©[Mn%]=0.01%). In addi-tion, there is a molecular ratio, Mn/S=1.71. From these relationships, eqs. (1) to (4) are obtained. From the eqs. (1) to (4), eq. (5) is obtained. From the eq. (5), we can calculate [S%].
½S% ½Mn% ¼0:01 ð1Þ ðMn% in MnSÞ ¼1:71 ðS% in MnSÞ ð2Þ ðTotal S%Þ ¼ ½S% þ ðS% in MnSÞ ð3Þ ðTotal Mn%Þ ¼ ½Mn% þ ðMn% in MnSÞ ð4Þ ½S%2 ððTotal S%Þ ðTotal Mn%Þ=1:71Þ
½S% 0:01=1:71¼0 ð5Þ However, in the range of [S%]©[M%]<0.01 where MnS does not form, the answer of [S%] does not exist in eq. (5). In that case, the total S amount equals to [S%] and the total Mn amount equals to [Mn%], ((Total S%)=[S%], (Total Mn%)=[Mn%]).
310
300
290
280
270
260
250
240
T
e
nsile strength,
TS
/
MPa
1.2 1.0 0.8 0.6 0.4 0.2 0.0
Mn, mass% S0.03
S0.05
S0.10
S0.30 S0.01
[image:4.595.324.530.71.273.2]S 0.025
Fig. 11 Influence of Mn and S contents at tensile strength transition points.
1.0
0.8
0.6
0.4
0.2
0.0
Mn, mass%
0.3 0.2
0.1 0.0
S, mass%
Mn (%) = 1.7×S (%)+0.4
Mn (%) = 9.4×S (%)
[image:4.595.73.266.277.437.2]Hardness Tensile strength Elongation
Fig. 12 Relationship between Mn%and S%at transition points.
1.0
0.8
0.6
0.4
0.2
0.0
Mn, mass %
0.4 0.2
0.0
S, mass%
MnS forming area
[Mn%] × [S%]=0.01
No MnS area
Fig. 13 Relationship between Mn and S forming MnS for 2.2%Si cast iron.14)
8
7
6
5
4
3
Sharpy Impact V
alue,
IV
/
J
2.0 1.5
1.0 0.5
0.0
Mn, mass %
(Non-Notch)
S0.10
S0.30
S0.01 S0.03
[image:4.595.328.524.311.465.2]4.2 Effect of [S%] and [Mn%] on the mechanical properties
Table 2 shows [S%] and [Mn%] with increasing Mn for S0.05 sample, which are calculated from eq. (5). Tensile strength and hardness are also shown, for reference. As Mn increases for a constant S content, [S%] decreases and [Mn%] increases reversely.
The tensile strength and the hardness are the highest in S0.05-1 specimen and S0.05-5 specimen. S0.05-1 specimen contains the highest [S%] as 0.050% and S0.05-5 specimen contains the highest [Mn%] as 0.94%. The remained T.Ps make valley shape data between S0.05-1 and S0.05-5. The reason of the appearance of a valley shape in the graph is considered as follows; (a) the effect of [S] is larger than that of [Mn] on the mechanical properties. (b) as [Mn] bonds with [S] and forms MnS, [S%] and [Mn%] change.
4.3 Optimum amount of S and Mn in gray cast iron Table 3 shows the calculated [S%] and [Mn%] with increasing Mn at transition points. Tensile strength and hardness are also shown, for reference. From Fig. 11 and Table 3, the transition point (S0.03%, Mn0.32%) among the transition points can be said as the most excellent composition, because hardness and tensile strength are high, as well as elongation and impact value which conflict with those properties are also the highest. In this composition, there is a relationship between [Mn%] and [S%], [Mn%]© [S%]=0.01%. That is, this composition is just before the MnS formation. In addition, this composition contains the highest [S%] within the range of not forming MnS. Therefore it can be concluded reversely that the optimum [S%] is 0.03% ([S%]=0.03%).
Consequently, in gray cast iron, the most excellent properties are obtained on S0.03% and Mn0.32%. This composition is the most excellent from the following three reasons. (a) It contains the optimum [S%] which has large influence on mechanical properties. (b) As it does not make MnS, we can make the best use of the influence of [S] and [Mn] on mechanical properties. (c) Hardness and tensile strength are high, as well as elongation and impact value are also the highest, which conflict with those properties. By the way, as the mechanical properties decrease abruptly under 0.03%S, careful selection is needed.
5. Conclusion
We investigated the effects of Mn and S on the mechanical properties of gray cast iron in detail, specifically, hardness, tensile strength, elongation, impact value, deflection and transverse load.
(1) With increasing Mn amount for a constant S content, a transition point appears on each mechanical property. Hardness, tensile strength and transverse load become the smallest at this transition point. Elongation, impact value and deflection become the largest. This transition point is caused by MnS formation.
[image:5.595.46.552.84.193.2](2) With increasing Mn amount for various S content, many transition points appear. When these points are connected, a new transition point appears near S0.03% and Mn0.32%. Excellent mechanical properties are seen, at this new transition point. That is, hardness and tensile strength become the highest, and elongation and impact value which conflict with these properties also become the highest. This transition point of transition Table 2 Change of calculated soluble [S%] and soluble [Mn%] with increasing Mn for S0.05 sample.
Ch. No.
Total Mn
%
Total S
%
Sol. [S%]
%
Sol. [Mn%]
%
[Mn]
©
[S]
Mn% in MnS
S% in MnS
MnS
%
Tensile Streng. MPa
Hardness HB
S0.05-1 0.2 0.050 0.050 0.200 0.010 0 0 ® 307 229
S0.05-2 0.45 0.050 0.025 0.407 0.010 0.043 0.025 0.068 290 208
S0.05-3 0.69 0.050 0.016 0.632 0.010 0.058 0.034 0.092 296 210
S0.05-4 0.84 0.050 0.013 0.777 0.010 0.063 0.037 0.100 300 217
[image:5.595.51.551.240.363.2]S0.05-5 1.01 0.050 0.011 0.943 0.010 0.067 0.039 0.106 301 229
Table 3 Change of calculated soluble [S%] and soluble [Mn%] with increasing Mn at transition points.
Ch. No.
Total Mn
Total S
Sol. [S%]
Sol. [Mn%]
[Mn]
©
[S]
Mn in MnS
S in MnS
MnS
%
Tensile strength MPa
Hardness HB
S0.01 0.12 0.010 0.010 0.12 0.001 0 0 ® 260 192
S0.025 0.24 0.025 0.025 0.24 0.006 0 0 ® 290 208
S0.03 0.32 0.030 0.030 0.32 0.010 0 0 ® 298 212
S0.05 0.45 0.050 0.025 0.41 0.010 0.043 0.025 0.068 290 208
S0.10 0.57 0.100 0.023 0.44 0.010 0.132 0.077 0.21 276 201
points is also caused by MnS formation.
(3) Up to 0.05%S, there is a relationship between Mn%and S% at the transition points, Mn(%)=9.4S(%). If S exceeds 0.05%, there is a relationship between Mn% and S% at the transition points, Mn(%)=1.7S(%)+ 0.4.
(4) In gray cast iron, the best excellent mechanical properties are obtained on S0.03% and Mn0.32%, which is just before the MnS formation. However, as the mechanical properties decrease abruptly under 0.03%S, careful selection is needed.
REFERENCES
1) H. Horie, Z. Yang, T. Kowata, S. Hiratsuka and X. Yuan:J. JFS63
(1991) 143148.
2) H. Horie, T. Kowata, K. Abe and A. Chida:J. JFS57(1985) 778783. 3) Y. Igarashi and S. Okada:J. JFS70(1998) 329335.
4) H. Nakae, H. Kiyosuke and S. Okada:J. JFS49(1977) 216221. 5) R. H. McSwain, C. E. Bates and W. D. Scott: AFS Intarnational Cast
Metals Journal (1976) 53.
6) R. H. McSwain and C. E. Bates:The Metallurgy of Cast Iron, (George Pub. Co., Switzerland, 1975) p. 423.
7) Y. Ueda and M. Takita:J. JFS50(1978) 617622.
8) H. Nakae and T. Yamauchi: J. Japan Inst. Metals58(1994) 3036. 9) T. Fujikawa, K. Nakamura, H. Sumimoto and S. Kiguchi:J. JFS70
(1998) 1420.
10) T. Kanno, I. Kang, T. Mizuki and H. Nakae:J. JFS73(2001) 441446. 11) T. Kanno, Y. You, M. Morinaka and H. Nakae:J. JFS70(1998) 465
470.
12) T. Kanno, M. Morinaka and H. Nakae:J. JFS74(2002) 305310. 13) W. Patterson: Giesserei46(1959) 289301.
![Fig. 6Relationship between Mn% and microstructure for 0.30%S12)([S%]:Calculated soluble S using eq](https://thumb-us.123doks.com/thumbv2/123dok_us/317602.530607/3.595.334.519.473.630/fig-relationship-mn-microstructure-s-calculated-soluble-using.webp)
![Table 3Change of calculated soluble [S%] and soluble [Mn%] with increasing Mn at transition points.](https://thumb-us.123doks.com/thumbv2/123dok_us/317602.530607/5.595.51.551.240.363/table-change-calculated-soluble-soluble-increasing-transition-points.webp)
