change. The corresponding parameters, such as area or perime-ter, were used as input for a supervised classification of a global platelet activation score and the distribution of the so-called pseudopodia. The latter are a striking sign of cell surface changes which is typically associated with the relevant activation of platelets. The results show that both phenotypes can be pre-dicted with a high accuracy in unknown samples, demonstrating the potential of the automated platelet characterisation for a wide range of clinical and scientific applications.
Index Terms—platelet activation, pseudopods, segmentation, supervised machine learning
I. INTRODUCTION
P
LATELETS are one of the main constituent of human blood and their concentration within the plasma is a standard parameter which is investigated in routine clinical exams. They are responsible for blood coagulation, wound healing and various pathological processes such as thrombus formation, which plays a mayor role in stroke and heart attacks. Platelets are highly dynamic objects that can react to external stimuli such as pressure, temperature change or chemical agents with a variety of different geometrical changes of their cell surface structure. However, not very much is known about the dynamics of this platelet shape change (PSC). Specifically, the dynamics of cell surface changes and/or the specific geometrical pattern formed un-der different conditions (either pathological states or as a response to external stimuli) has recently gained increasing interest in the scientific community [1]–[3].A characteristic sign of PSC is the formation of so-called pseudopodia, which appear like spikes of different length, thickness and shape that are attached to the cell body [4]. In order to quantify and characterise different PSC reactions to external stimuli and under pathological conditions, it would be highly desirable to know the distribution of the number of pseudopods in the blood sample being investigated. One
Manuscript received June 22, 2014; revised August 12, 2014.
H. Neeb is with the Department of Mathematics and Technology, University of Applied Sciences Koblenz, 53424 Remagen, Germany and the Insitute for Medical Engineering and Information Process-ing, University of Koblenz-Landau, 56070 Koblenz, Germany; e-mail: [email protected].
S. Grieger and K. Luxem are with the Department of Mathematics and Technology, University of Applied Sciences Koblenz, 53424 Remagen, Germany; e-mail: [email protected].
E. F. Strasser is with the Transfusion and Haemostaseology Depart-ment, University Hospital of Erlangen, 91054 Erlangen, Germany; e-mail: [email protected]
M. J. Kraus is with the Insitute for Medical Engineering and Information Processing, University of Koblenz-Landau, 56070 Koblenz, Germany; e-mail: [email protected]
associated with several drawbacks. First of all, segmentation algorithms of pseudopodia are prone to artefacts. Small or thin pseudopodia might easily be missed as their length could be too small to be accurately differentiated from natural variations of the cell surface structure. Furthermore, images acquired with different imaging modalities, e.g. dark field or phase contrast microscopy, result in different image contrasts and require an adaption of the algorithm. Even when using the same image modality, the contrast might change due to different foci of the microscope at independent investigations or different illuminations. As the pseudopodia are smaller and show at the same time a much larger variability in shape and position in comparison to the platelet body, their segmentation is much more complicated and prone to errors than the segmentation of a cell as a whole.
Therefore, the current work investigated if geometric fea-tures derived from the whole platelet segment (i.e. where no differentiation between cell body and pseudopodia was performed) could be used as a surrogate marker to reliably predict the distribution of the number of pseudopods in platelet enriched blood samples. Furthermore, a cell activa-tion score was defined which not just covers the number and shape of pseudopodia. Instead, the whole platelet structure including changes in the cell body was taken into account. Again, only simple geometric features of platelet shape such as area or perimeter were determined. For both phenotypes, pseudopodia distribution and platelet activation score, su-pervised machine learning algorithms were trained using the known association between geometric features and class information. The latter was obtained by manually evaluating a large representative sample of different platelet images. The current work demonstrates that a reliable prediction of both phenotypes is indeed feasible. This opens the door for a wide range of future quantitative studies of platelet shape change and its association with different external stimuli as well as pathological changes of the corresponding PSC.
II. METHODS
A. Sample preparation
Fig. 1. Original microscopic image from the ADP series (left). The corresponding image where the outlines (red lines) of the identified platelet segments were overlaid is shown on the right. The segments identified by the automated segmentation algorithm [3], [5] are labled by numbers #1 - #6.
at 37◦C for 30 minutes. The native untreated data were used for the determination of the number of pseudopods distribution (referred to asP D-data) whereas the ADP and TRAP datasets were used to define the activation score (AS -data). The latter datasets were used to predict the activation score as the platelet-enriched plasma was treated with two different agents which resulted in different degrees of platelet activation. Therefore, a wider range of activation patterns could be covered, resulting in a more reliable predictor especially for highly activated platelets.
B. Image segmentation and parameter definition
The platelet enriched samples were scanned with a light microscope (Laborlux; Wild Leitz GmbH, Wetzlar, Germany) equipped with a Canon 600 D reflex camera (Canon Inc., Tokyo, Japan). The magnification factor was 100 and the resulting images were stored in JPEG format for futher processing. A total of 350 images were acquired at dif-ferent spatial locations for each sample. The correspond-ing images were then processed to identify platelet seg-ments and determine their geometrical properties as de-scribed in [3] using the GROUP-IT open-source software toolkit (Gruenwald Remagen Open-Source Unified Platelet
Identification Tracker). GROUP-IT is available for free download at [5]. For the sake of completeness, the basis for the segmentation algorithm and the parameters which are determined for each segment are briefly described in the following.
At the initial step, a bias field was estimated by iteratively removing pixels with large grey values. The smoothed bias field was then subtracted from the original 8-bit greyscale images to remove low-frequency inhomogenities resulting e.g. from regional brightness variations. The resulting images were then deblurred by a deconvolution algorithm which employed a maximum-likelihood estimator of the image specific point-spread-function (PSF)1. The PSF corrected images were smoothed by an anisotropic diffusion filter in combination with a morphological opening operation. Using an adaptive threshold approach, the filtered images were segmented into disjunct binary segments. For each
1Here, the functiondeconvblindfrom MATLAB 2014a (The Mathworks
Inc.) was used.
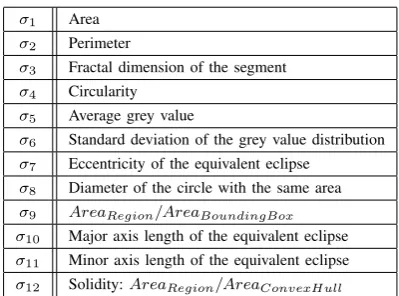
segment, the following twelve parameters were determined (see Table I): the segment area (σ1); the segment perimeter
(σ2); the fractal dimension of the segment border (σ3);
the circularity (σ4); the average grey value (σ5) and the
corresponding standard deviation (σ6); the eccentricity of an
ellipse which has the same second moments as the segment (σ7); the diameter of a circle with the same area as the
segment (σ8); the ratio between the area of the region and
the area of its bounding box (σ9); the major (σ10) and
minor (σ11) axis length of the equivalent eclipse and the
solidity (σ12). The latter is defined by the ratio between
the segment area and the area of the convex hull which corresponds to the current segment. The parameters were finally used to remove any remaining non-platelet segments from the images, resulting e.g. from erythrocytes, leucocytes or microparticles. The complete description of the algorithm including its performance on real datasets is detailed in [3].
TABLE I
PLATELETFEATURESUSEDFORCLASSIFICATION
σ1 Area σ2 Perimeter
σ3 Fractal dimension of the segment σ4 Circularity
σ5 Average grey value
σ6 Standard deviation of the grey value distribution σ7 Eccentricity of the equivalent eclipse
σ8 Diameter of the circle with the same area σ9 AreaRegion/AreaBoundingBox
σ10 Major axis length of the equivalent eclipse σ11 Minor axis length of the equivalent eclipse σ12 Solidity:AreaRegion/AreaConvexHull
C. Supervised classification
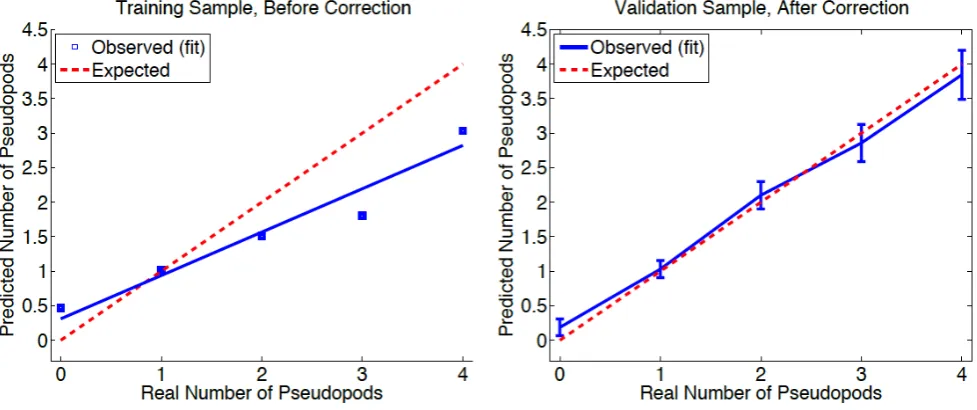
Fig. 2. Relation between the known number of pseudopods and the predicted average number of pseudopods for uncorrected data in the training sample (left). The corresponding distribution for the validation sample is shown on the left. As described in the text, a correction factor was defined based on the training dataset and applied the each datapoint. The consistency of the predicted and the known average number of pseudopods (red dotted line) becomes clearly evident.
the group average (either P D or AS) and dividing by the corresponding standard deviation. After normalisation,
≈ 99% of all data fall in the interval [−3,3] for normally distributed data.
1) Pseudopodia distribution: A random sample consisting of 996 segments was drawn from the P D-dataset and the number of pseudopods,NP seudo, was manually counted for each segment by an expert (MJK). Due to the small number of platelets with more than four pseudopods, the data were assigned to one of the following five groups: zero pseudopods (group 0), a single pseudopod (group 1), two pseudopods (group 2), three pseudopods (group 3) and four or more pseudopods (group 4). The group defines the class variable which is associated with the corresponding feature vector. As the 12-dimensional feature vector might contain vari-ables that do not add sufficient discrimination power, a preselection of the relevant variables was performed before training the supervised model. Specifically, each of the 212
possible independent combinations of the 12 parameters was selected and used to train a k-nearest-neighbour (kNN) model with k = 12. For each combination of the parameters, the prediction error was determined using a leave-one-out crossvalidation scheme [6]. Using the parameter combination that resulted in the smallest error rate, a training sample consisting of 489 samples was randomly obtained to train a kNN model withk= 12. The remaining 507 segments were used for model validation. I.e., the number of pseudopods was predicted for each segment contained in the validation sample and subsequently compared to the known number of pseudopods. However, it is important to notice that one is typically not interested in the accurate prediction of the number of pseudopods for a single platelet. Instead, the dis-tribution of the number of pseudopodia in the whole sample is of greater interest as this represents the information of the average platelet activation, resulting from either external stimuli or the pathological process investigated. Therefore, the average predicted number of pseudopods was determined
for each of the five groups. To avoid any systematic errors, the corresponding group averages were also calculated for the training sample and plotted against the known number of pseudopods in each group. As a linear relationship with a slopeb= 0.57and offseta= 0.32was observed between the two quantities, all datapoints were first corrected by scaling the corresponding predicted number of pseudopods for each segment by1/b=and subtractinga/b. Finally, the average number of predicted pseudopods was plotted against their real numbers in the validation dataset in order to validate the model predictions including the applied correction term.
2) Activation Score: A total of 659 platelet segments were randomly chosen from the AS dataset and manually assigned to one of the three groups: real platelets (RP), agglomerates of platelets (AGGLO) and none-platelets such as erythrocytes or lykocytes (N P). TheN P group was disre-garded from the further analysis as it did not contain platelet segments. For each segment in group RP and AGGLO, an activation score index AIT rue was defined manually by an expert (MJK). The score ranged between 0-100, where the lowest values were assigned to none-activated platelets whereas the value 100 was assigned to segments which showed the highest level of activation. The activation score was based on the morphological classification of platelet shape change as proposed by Rosenstein [7] and Allen [8]. Images of single platelets were assessed regarding their morphologic features of activation, i.e. number, length and width of pseudopodia and the formation of the granulomer and the hyalomer. The manual assignment was repeated independently three times and the average AIT rue was
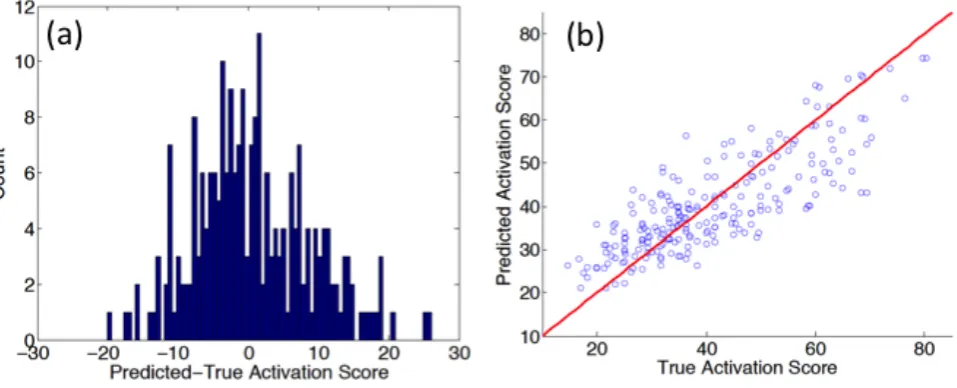
Fig. 3. Distribution of the difference between predicted and true activation score in the validation sample as predicted with the bilinear regression model (a). The corresponding scatter plot is shown in (b). The red line indicates points which fulfill the identityAIT rue=AIP redicted.
and predicted activation index was determined from which the average and median of |AIP redicted −AIT rue| was calculated.
III. RESULTS
Figure 1 (left) shows a single image from the stack of 350 images of the ADP series. The corresponding result from the automated segmentation which forms the basis for the definition of the 12-dimensional feature vector (see Table I) is shown on the right. In this image, a total of six segments where identified. One can easily recognise the pseudopodia formed by platelet #3 and, to a smaller extend, by platelet #2. Segment #6 consists of two adjacent platelets and therefore presents an agglomerate.
A. Pseudopodia distribution
The exhaustive search performed for the accurate predic-tion of the number of pseudopods revealed that the best pa-rameter combination consisted of {σ2, σ3, σ4, σ5, σ10, σ12}.
Results from the prediction of NP seudo in the training
sample using those six parameters are shown in Fig. 2 (left). As already described above, a linear relationship between the true and predicted values was observed. However, the fit of the distribution revealed a significant systematic deviation from the bisector so that all data points were appropriately corrected. Employing the correction factor extracted from the training sample, the points in the validation sample agree within the error bars with the expected behaviour (see Fig. 2 (right)). Specifically, the following average number of pseudopods were predicted for the five groups defined above, where the error bar indicates the corresponding error of the mean: 0.18±0.12(group 0); 1.03±0.12 (group 1);
2.10±0.19(group 2);2.86±0.27(group 3) and3.85±0.36
(group 4).
B. Activation Score
The stepwise regression approach of the training data resulted in two linear terms and one interaction term to
predict the activation score. Specifically,AIP redicted has to be calculated as
AIP redicted= 45.8 + 26.4σ2−8.3σ10+ 2.2σ6σ9, (1)
to obtain the lowest least-squared error rate in the training sample. The performance of Eq. 1 to correctly predict un-known samples is shown in Fig. 3. Here, the scatter between the known and the predicted activation score (right) as well as the distribution of the difference between both are shown (left). The difference is nearly Gaussian distributed which shows that possible remaining systematic deviations might be negligible. In contrast, the scatter between AIT rue and AIP redictedshows a small systematic deviation from a sym-metric distribution (Fig. 3 (right)). Points with smallAIT rue
are slightly overestimated whereas a small underestimation is observed for platelets with higher true activation score. However, on average the mean (median) absolute difference between the predicted and true activation score was 6.85 units (5.35 units).
IV. CONCLUSION
The activation of platelets is a highly dynamic process and an important parameter for the investigation of platelet function. Today, light absorption measurements of platelet enriched blood samples are one of the standard tools to determine platelet activation [10]. In essence, the increased platelet area results in an increase of the light absorption coefficient which is then measured and properly calibrated [11]. However, such techniques do not allow for a study of the heterogeneity of individual platelets, where different geometries which are formed under various conditions can not be investigated [12].
features measured for the individual segments could be used to predict (1) the number of pseudopods and (2) the platelet activation using supervised learning models. The latter was obtained from manually scoring the individual segments with respect to criteria published in the literature [7], [8]. It was shown that the pseudopodia distribution can be predicted with high accuracy if the learning model was adjusted to correct systematic errors. It is important to notice however, that only the training data were used to define the sys-tematic deviation between known and predicted number of pseudopods. The test sample was then employed to validate the supervised classifier including the correction term. We have demonstrated that this approach resulted in an unbiased and accurate measure of the pseudopodia distribution in an unknown sample.
The same applies to the prediction of the activation index, where the average absolute deviation between real and predicted value was only ≈ 6 units. However, a small systematic error in the predicted AI was observed, similar to the pseudopodia distribution. This should not pose severe problems as it can easily be corrected by scaling the data in the training sample appropriately. This should even further reduce the deviation between predicted and true activation score (see Fig. 3).
In summary, the current work has demonstrated that clinical phenotypes such as the number of pseudopodia and the platelet activation can reliably and automatically be predicted from simple measures of platelet geometry, including grey value information. This opens the door for a wide range of applications in future clinical studies on platelet function and dysfunction.
ACKNOWLEDGMENT
The authors would like to thank Lena Heinle for revising the article.
REFERENCES
[1] J. H. Hartwig, “The platelet: form and function,” Semin. Hematol., vol. 43, no. 1 Suppl 1, pp. 94–100, Jan 2006.
[2] M. J. Kraus, E. Strasser, and R. Eckstein, “A new method for measuring the dynamic shape change of platelets,” Transfus Med Hemother, vol. 37, pp. 306–310, 2010.
[3] M. J. Kraus, H. Neeb, and E. F. Strasser, “Fractal and Euclidean descriptors of platelet shape,”Platelets, Nov 2013.
[4] M. J. Kraus. (2014, June) Platelet timelaps video. [Online]. Available: http://platelets.praxis-geiselgasteig.de/pseudopodia.avi
[5] H. Neeb and M. J. Kraus. (2014, June) Gr¨unwald Remagen Opensource Unified Platelet-Identification Tracker (GROUP-IT). [Online]. Available: http ://platelets.praxis− geiselgasteig.de/groupit.zip
of its reversal by aggregation inhibitors,”J. Physiol. (Lond.), vol. 280, pp. 193–212, Jul 1978.