Effect of Resins and Membrane Permeation for
Improved Selectivity
O Edidiong, S Habiba and *E Gobina
Abstract—In this study, the esterification of lactic acid with ethanol catalysed by cation-exchange resin catalysts to produce ethyl lactate was carried out in a batch wise mode at 100 oC. The different catalysts used were amberlyst 36, amberlyst 16, dowex 50w8x and amberlyst 15. The surface of the resin catalysts was characterised using different analytical methods including Fourier transform infrared spectroscopy (FTIR), automated gas sorption analyser (Quantachrome 2013) respectively. The carrier gases used for the analysis of the esterification product were tested with a silica membrane before being employed for gas chromatography analysis. The different carrier gases tested were helium (He), nitrogen (N2), argon (Ar) and carbon dioxide (CO2). The experiments were carried out at the gauge pressure range of 0.10 – 1.00 bar at the temperature of 25 – 100 oC. The BET of the resin catalysts showed an increase in surface area after the esterification process. The BJH pore size of the catalysts exhibited a type IV isotherm in accordance with the mesoporous classification of the material. The FTIR results of the resin catalysts, exhibited different functional groups including C=O and C-H indicating carbonyl and alkyl functional groups.
Index Terms –Cation-exchange, esterification, gas transport, lactic acid, membrane, resin, selectivity.
I. INTRODUCTION
The dependence on oil for primary energy and production of synthetic chemicals has been on the rise for decades. However, this dependence has consequent negative impacts on the environment and climate change, which has led increase research for alternative sources of energy and chemicals from renewable origin. The generation of product through biotechnological processes makes it possible to discover and explore several chemical routes to obtain products with very low environmental impact and high yields [1]. Solvents are basic consumables in industries such as pharmaceutical, chemical and agriculture. They are manufactured from petrochemical feedstock obtained from natural gas and crude oil [2]. Studies have shown that the use
Manuscript received March 31, 2017; revised June 5, 2017
O. Edidiong is a research student with Centre for process Integration and Membrane Technology (CPIMT), School of Engineering, The Robert Gordon University Aberdeen, AB10 7GJ, United Kingdom. (e-mail:
S. Habiba is a research student with Centre for process Integration and Membrane Technology (CPIMT), School of Engineering, The Robert Gordon University Aberdeen, AB10 7GJ, United Kingdom. (e-mail:
E. Gobina is the Director of Centre for process Integration and Membrane Technology (CPIMT), School of Engineering, The Robert Gordon University Aberdeen, AB10 7GJ, United Kingdom. (aCorresponding
Author e-mail: [email protected]. Phone No.: +44(0)1224262348).
result in serious health and environmental problems. One of the major challenges faced by the petrochemical industry has of some petrochemical solvents may been the replacement of traditional petroleum-derived solvents [3]. It is therefore essential to develop new solvents with less toxic and hazardous characters [4]. The world demand of solvents is approaching 20 million tons per year, however, forecast have shown that this demand will increase in the upcoming years [3]. As a result of this, there is need for alternative solvent production from renewable sources. Ethyl lactate (EL) is one of the solvents in high demand in the chemical industry and it is a sustainable alternative organic solvent with advantages that include biodegradability, non-carcinogenic, non-corrosive and non-ozone depleting and is miscible with water and hydrocarbons. Because of its outstanding advantages, EL has been described by the U.S Environmental Protection Agency (EPA) as a ‘’green solvent’’ [5]. EL is therefore a suitable replacement for a number of hazardous organic solvents such as toluene, benzene and hexane. It is used in the different industries such as food, pharmaceutical, paint, adhesive, agriculture and petroleum refinery [6]. In addition to the energy efficiency, different types of renewable energy and carbon capture/storage as well as new technologies in the production of new solvents from biomass sources that could replace the petroleum-based solvents must be widely developed to reach the emission targets [7]. The industrial manufacture of esters by esterification of acid with alcohol was first performed in a continuous stirred tank reactor (CSTR) and later in a catalytic distillation column in the presence of cation-exchange resins [8].
Currently some studies have focused on the water-permeable membrane reactor which has the capability of enhancing reversible reactions including esterification reactions [9]. The simplest route to obtain an ester with high yield is through the direct esterification of acids with alcohol using homogeneous (mineral acid) and heterogeneous (cation exchange resin) catalysts. The use of heterogeneous catalysts has a number of inherent advantages over homogenous catalyst; (a) purity of products is higher since side reactions can be completely eliminated or are less significant, (b) they can avoid corrosive environment and (c) the catalysts can be removed easily from the reaction mixture by decantation or filtration process. Several varieties of solid catalysts can be used for esterification reactions with cation-exchange resins being the most commonly used solid acid catalysts in organic reactions. In heterogeneous catalysts, the forces active on the solid surface can distort the absorbed reactant molecules and alter the rate of reaction [10].
ester product takes place in a single column. Because of the combination of reaction and distillation in one single apparatus, suitable process control strategies have to be developed and applied to ensure safe and optimal operation. According to Jagadeeshbahu et al.[10], the heat of a reaction can be calculated based on van’t hoff equation. The van’t hoff equation gives information about the temperature dependence on the equilibrium constant. The reaction
enthalpy (heat of reaction, ∆Ho) and the reaction entropy
((∆So) can be obtained by plotting InK vs 1/T where the
slope of the line (-∆Ho/R) and the intercept on the ordinate
axis gives (∆So/R) can be obtained. If the slope is negative it
indicates that the reaction is an endothermic reaction. According to Lechatelier’s principle, an increase in the reaction temperature can shift the equilibrium system in the forward direction to ease the stress of additional heat. The shift in the forward direction leads to an increase in the ester production and a decrease in the reactant concentration.
The use of inorganic ceramic membrane to selectively eliminate water from the reaction product during esterification of lactic acid is yet another important application that has attracted a lot of attention. Materials such as zirconia, zeolite, metals, alumina and carbon can be used as commercially available porous inorganic membrane. Other materials that can be used for the manufacture of inorganic membranes include titania, tinoxide, cordierite and silicon nitride. Although inorganic membranes are generally expensive in contrast to their organic-polymeric counterparts, they have a lot of advantages in gas separation including well defined stable pore structure, chemical inertness and wear resistance [11]. The function of the membrane during esterification reaction is to selectively remove water from the reaction mixture which will result in an equilibrium shift thus, driving the reaction towards completion [8],[12]. Gas separation is a membrane process whereby a pressurized gas mixture interacts with the membrane on one side (high pressure side) with the other side kept under vacuum or at low pressure using a vacuum pump or an inert sweep gas. The driving force (i.e partial or total pressure) is a pressure difference across the membrane [13]. The transport mechanism through porous membranes can be explained using various transport mechanisms based on the membrane material and the average pore size. The different mechanisms of gas transport through porous membranes include Knudsen diffusion, poiseuille or viscous flow, capillary condensation, surface diffusion and molecular sieving [14]. Knudsen mechanism takes place when the mean free path of the diffusing gas molecules is greater than the pore size of the membrane [15]. In this mechanism, random collision occurs between the molecules of the gas and the pore wall than between each permeating gas molecules. In the capillary condensation mechanism of transport, partial condensation within the pores occurs as a result of low vapour pressure. The condensed feed component diffuses through the pores of the membrane blocking the other components resulting in separation [16]. Poiseuille flow also known as viscous flow occurs if the pore radius of the membrane is larger than the mean-free-path of the permeating gas molecule [17]. In this case more collision will take place between the permeating gas molecules (molecule-molecule collision) than between the molecule and the pore wall of the membrane. In surface diffusion, the adsorption of gas molecules are considered to
be adsorbed on the surface of the pore wall and move on the surface by jumping between the minimum potential energy generated on the membrane pore surface. For molecular sieving to occur, the membrane must have pore diameters which are roughly the same as those of the gas molecules for separation to take place [14].
II. EXPERIMENTAL
A. Membrane Preparation
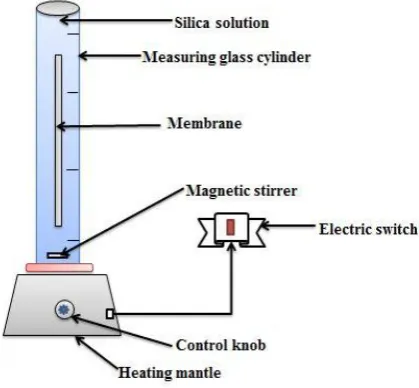
The membrane preparation was carried out based on a patented method [16]. The membrane support was prepared by sol gel dip-coating method. Prior to the permeation test, the membrane was weighed to determine the actual weight before and after modification. 545 mL of isopentane (Sigma Aldrich ≥ 99%) was measured into 1000 mL glass cylinder and 50 mL of silicon elastomer was added to the solution together with 5 mL of the curing agent. A magnetic stirrer was used to mix the three reagents and the mixture was allowed to stir for 30 minutes. The support was then dipped into the solution and allowed in the solution for 30 minutes and the support was taken out from the solution and dried in
the oven for 2 hrs at a constant temperature of 65 oC. Figure
[image:2.595.325.535.389.583.2]1 shows the schematic diagram of the dip-coating process.
Figure 1: Schematic diagram of the dip-coating process.
B. Carrier Gas Permeation with membrane
The permeability of the single gases with inorganic ceramic membrane was carried out using four different gases which serve as carrier gases for esterification reaction including
argon (Ar), helium (He), carbon dioxide (CO2) and nitrogen
(N2). The effective length of the support was measured to be
36.6 cm and the inner and outer radius was 7 and 10 mm respectively. The permeability experiment was carried out at the gauge pressure of between 0.10 -1.00 bar and
temperature of 25 -100 oC. The flow rate of the gases was
supplied by BOC, UK. Figure 2 shows the schematic diagram of the gas permeation setup.
Figure 2: Schematic diagram of gas permeation setup which consists of ; carrier gas cylinder (1), gas feed inlet (2), permeate pressure gauge (3), control valve (4), O-ring graphite seal (5), reactor (6), heating tape (7), temperature regulator (8), thermocouple (9), thermocouple box (10), reten-tate pressure gauge (11), flow meter (12) and fume cupboard (13).
C. Materials
An aqueous lactic acid 99.9 wt% and ethanol 99.9 wt% solutions were purchased from sigma-Aldrich, UK and were used as received without further purification. The catalysts used in the experiments were commercial solid cation-exchange resins also purchased from Sigma-Aldrich, UK. Helium gas (99.98 % purity) was used as carrier gas and was obtained from BOC, UK.
D. Catalyst cleaning
Prior to the esterification process, the fresh commercial cation-exchange resin was weighed into a 50 mL beaker and was rinsed with 2 mL of deionized water and 10 mL of ethanol. The catalysts were reweighed and oven dried
(carbolite oven) at 65 oC for 24 hrs to remove any impurities
and moisture completely before the esterification process.
E. Batch process Esterification
After the catalyst cleaning process, 30 mL of lactic acid with 5g of the resins was charged into the reactor and heated to
100 oC. After attaining the desired temperature, 50 mL of
ethanol which had been previously heated to 100 oC
separately was added to the mixture. The stirring and heating of the reaction mixture was achieved using a magnetic hot plate with a stirrer. The stirrer speed was adjusted to a frequency of about 400-800 rpm. The water from the reaction product was removed by connecting two
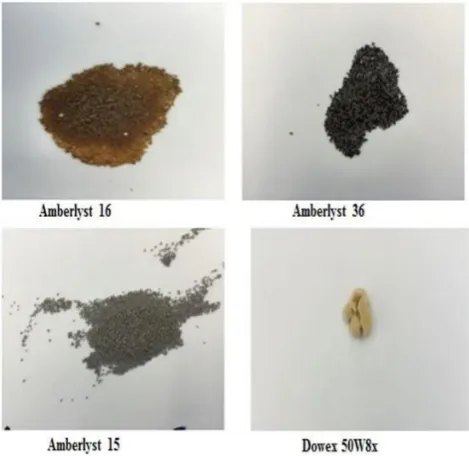
[image:3.595.56.290.89.319.2]vacuum pumps to the openings of the reactor. The inlet water flows through the pipe to flush the system while the out let water displace the waste water from the reaction system. About 1mL of the reaction product was withdrawn from the reactor simultaneously for the qualitative analysis with the GC-MS. Figure 3a and b shows the batch process esterification setup (3a) and the pictorial diagram of the cation exchange resins after esterification process (3b).
Figure 3a: Batch process esterification setup
Figure 3b: Pictorial diagram of the cation-exchange resin catalysts.
F. Catalyst and membrane Characterisation
[image:3.595.309.540.189.410.2] [image:3.595.306.541.457.685.2]the structural analysis of the resins. This method was used in order to determine the components with the strongest absorption strength on the surface of the resin catalysts. The scanning pattern was observed within the range of 4000 to
400 cm-1 with the resolution of 4 cm-1. The FTIR results
interpretation was done using the characteristic library spectra provided by the school of pharmacy life science,
Robert Gordon University, UK. The membrane
morphological characterisation was carried out using the Zeiss EVO LS10 scanning electron microscopy coupled with energy dispersive analysis of x-ray (SEM/EDAX). The total surface area and the average pore size distribution of both the catalysts and membranes were determined using Quantachrome 2013, automated gas sorption analyser at 77K. The BET and BJH models of the liquid nitrogen adsorption were used to describe the surface area and pore size of the catalysts respectively.
III. Result and Discussion
[image:4.595.308.547.47.205.2]A. Effect of flux on Gauge Pressure
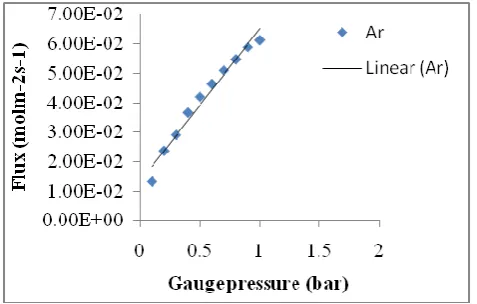
Figure. 4a-d shows the relationship between the flux (molm
-2
s-1) of the carrier gases and the gauge pressure (bar) at 60
o
C. From the results obtained in Figure.4a-d, it can been seen that the flux of the different gases exhibited a linear relationship with gauge pressure. It was also found that the
graph showed higher R2 values of up to 0.97 for Ar but falls
to 0.85 for CO2. It was observed that the flux of He and Ar
gases showed almost a similar R2 values although that of
helium gas was higher than that of the argon gas. However the two gases also have different molecular weight although
they both possess almost the same R2 values. It was also
observed that N2 gas showed a higher R2 value than CO2 gas
although it has a lower molecular weight in contrast to CO2.
From the result obtained, helium gas was suggested as the suitable carrier gas for the improved yield of ethyl lactate when coupled with gas chromatography.
Figure 4a: Flux of Ar carrier gas at the gauge pressure range of 0.10 – 1.00bar and 60 oC.
Figure 4b: Flux of N2 carrier gas at the gauge pressure range of 0.10 –
1.00bar and 60 oC.
Figure 4c: Flux of He carrier gas at the gauge pressure range of 0.10 – 1.00bar and 60 oC.
Figure 4d: Flux of CO2 carrier gases at the gauge pressure range of 0.10 –
1.00bar and 60 oC.
B. Selectivity Comparison at different Pressure Gauge
Table 1 and 2 shows the comparison between the theoretical
selectivity and the experimental selectivity of the He, Ar, N2
and CO2 that were used for the analysis. The selectivity of
the gases was compared at the gauge pressure of 0.4 bar
(Table 1) and 0.9 bar (Table 2) at the temperature of 60 oC.
From the result obtained, it was found that CO2
permselectivities over He, Ar and N2 with the membrane at
0.40 bar and the temperature range of 25 – 100 oC was
[image:4.595.307.547.245.398.2] [image:4.595.308.544.443.607.2] [image:4.595.46.285.577.729.2]good separation of the carrier gases at 0.40 bar in contract to the selectivity values at 0.90 bar. However, it was found that the experimental selectivity of argon gas with the membrane at 0.40 bar shows a drastic increase in contrast to the selectivity of argon at 0.90 bar which indicate a good separation of argon at this gauge pressure.
Table 1: Calculated experimental and theoretical selectivity
values of the different gas over CO2 at 0.40 bar for 3rd
dip-coated membrane.
Theoretical
selectivity Experimental selectivity
At 0.40 bar
Permeance ratio
25oC
60oC 80oC 100oC
He/CO2
0.3 CO2/He 0.502 0.755 0.831 0.613
Ar/CO2
0.95 CO2/Ar 0.606 1.219 1.318 0.899
N2/CO2
0.79 CO2/N2 0.915 0.966 0.983 0.833
Table 2: Calculated experimental and theoretical selectivity
values of Ar, He, and N2 over CO2 at 0.90 bar for 3rd
dip-coated membrane.
Theoretical
selectivity Experimental selectivity
At 0.40 bar
Permeance ratio
25oC
60oC
80oC 100oC
He/CO2
0.3 CO2/He
0.467 0.543 0.546 0.417
Ar/CO2
0.95 CO2/Ar 0.645
0.945 0.957 0.726
N2/CO2
0.79 CO2/N2 0.766
0.788 0.786 0.649
The permeance ratio of CO2 over Ar, He and N2 gas was
also plotted against the feed gauge pressure (bar) at 60 oC as
[image:5.595.305.553.267.502.2]shown in Figure 5. From the result obtained, it was found that the theoretical selectivity value of argon was higher than that of the experimental values suggesting Knudsen flow as the dominant mechanism of transport. Experimental error bars were determined on the graph to further confirm the accuracy of the result.
Figure 5: Permeance ratio of CO2 over Ar, He and N2 carrier gases.
C. FTIR of adsorption components
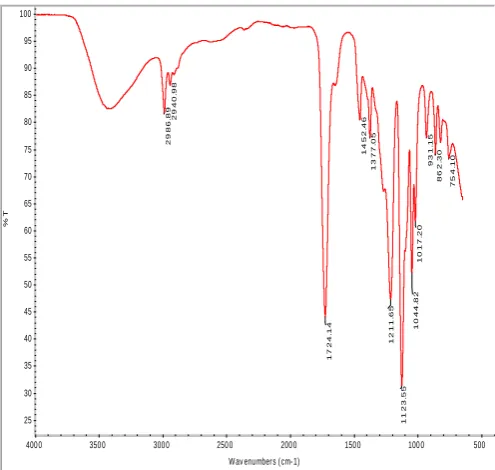
Figure 6 present the graph of the percentage transmittance
(T%) against the wave number (cm-1). From the result
obtained in Figure 6 it was found that the band at 2986.89
and 2910.98 cm-1 represents stretching vibration bond of
O-H hydroxyl functional group while the bond at 1724.14 corresponds to the C=O carbonyl functional group. However, the band at 1452.46, 1377.05, 1211.65 and
1123.55 cm-1 were attributed to the C-H alkyl functional
group. The bands between 1044.82 – 754.10 cm-1 were all
attributed to the C-H functional group. From the different structural functional groups that were obtained on the spectra, it was suggested that ethanol, water, lactic acid or ethyl lactate are the most adsorbed on the surface of the resin catalysts. 7 5 4 .1 0 8 6 2 .3 0 9 3 1 .1 5 1 0 1 7 .2 0 1 0 4 4 .8 2 1 1 2 3 .5 5 1 2 1 1 .6 5 1 3 7 7 .0 5 1 4 5 2 .4 6 1 7 2 4 .1 4 2 9 4 0 .9 8 2 9 8 6 .8 9 25 30 35 40 45 50 55 60 65 70 75 80 85 90 95 100 %T 500 1000 1500 2000 2500 3000 3500 4000
Wav enumbers (cm-1)
Figure 6: FTIR spectra of esterification reaction product catalysed by amberlyst 15 at 100 oC and the wavelength region of 500 – 4000cm -1.
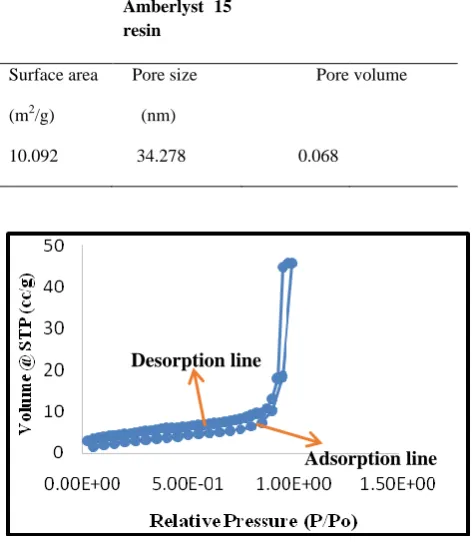
D. Liquid Nitrogen adsorption/desorption Results
Figure 7a presents the plots of the amount of gas adsorbed (volume at STP (cc/g) against the relative vapour pressure (P/Po) while Figure 7b shows the plots of cumulative pore volume (cc/g) against relative pressure (P/Po) of amberlyst
15 after esterification at 100 oC (7b). As shown, two lines
are explained in the curve, the upper line depicts the desorption line while the lower line depicts the adsorption line. From the results obtained in 7a, it was observed that the BET surface area of the amberlyst 15 showed a slight hysteresis loop on the curve which indicates that the curve was similar to the type IV isotherm and the amount of adsorption increases sharply at elevated relative pressure because of the capillary condensation that occurs in the mesoporous region. A similar result was obtained in our previous result for amberlyst 36 cation-exchange resin after
[image:5.595.45.290.369.482.2] [image:5.595.56.283.617.753.2]similar result where the BET curve for the cation-exchange resin demonstrated a type IV/V isotherm attributed to typical adsorption on the mesoporous material with hysteresis loop. It was also found that the plots from the multi points chosen at random gave a higher surface area of
10.092 m2/g as shown in Table 3. Although the resin
catalyst exhibited a high surface area, the pore size distribution of the catalyst was further described using the Barrette-Joyner-Halenda (BJH) method. The pore diameter of the resin was 34.278 nm with the pore volume of 0.068 are shown in Table 3, which was in accordance with the IUPAC classification of the material. However, other comparison will be made with amberlyst 16 and dowex 50W8x cation-exchange resin at the same reaction temperature.
Table 3: BET and BJH desorption summary for amberlyst 15 cation–exchange resin.
Amberlyst 15 resin
Surface area
(m2/g)
Pore size
(nm)
Pore volume
[image:6.595.47.285.298.571.2]
10.092 34.278 0.068
Figure 7a: BET surface area of amberlyst 15 at 100 oC
Figure 7b: BJH pore size distribution of amberlyst 15 at 100 oC.
IV. CONCLUSION
The characterisation of the resins and ordered silica membrane for improved selectivity of the esterification product have been studied using different analytical techniques including FTIR, auto sorption liquid nitrogen isothermal method and membrane reactor. The BJH pore size of the cation-exchange resin was in accordance with the IUPAC classification of the material. The BET surface area of the catalyst exhibited a type IV/V isotherm indicating a capillary condensation in the mesoporous region at 77K. The gas flow through the membrane was dominated by different mechanisms including viscous and Knudsen flow. The membrane exhibited a straight line dependence of flux
with gauge pressure with R2 value of up to 0.97. The
experimental selectivity of Ar/CO2 gas showed a higher
value of 1.318 at gauge pressure of 0.90 bar in contrast to the theoretical selectivity of 0.95. The order of the gas
viscosity with respect the gas permeance was He > N2 > Ar
> CO2. The FTIR of the resin catalyst exhibited different
functional group including C-H, C=O and O-H. The standard deviation with 5% error bar confirms the accuracy of the experimental results.
ACKNOWLEDGEMENTS
The Authors acknowledge the Centre for Process Integration and Membrane Technology (CPIMT) at RGU for providing the research infrastructure, School of Pharmacy and Life science for the SEM image and FTIR analysis. PTDF is also acknowledge for their financial support towards the research.
REFERENCE
[1] Lunelli BH, De Morais ER, Maciel MRW, Filho R. Process Intensification for Ethyl Lactate Production Using Reactive Distillation. Chem Eng Trans. 2011; 24:823-828.
[2] Aparicio S, Halajian S, Alcalde R, García B, Leal JM. Liquid structure of ethyl lactate, pure and water mixed, as seen by di-electric spectroscopy, solvatochromic and thermophysical studies. Chemical Physics Letters. 2008; 454(1):49-55. [3] Aparicio S, Alcalde R. The green solvent ethyl lactate: an
experimental and theoretical characterization. Green Chemi-stry. 2009; 11(1):65-78.
[4] Lomba L, Giner B, Zuriaga E, Gascón I, Lafuente C. Ther-mophysical properties of lactates. Thermochimica Acta. 2014; 575(0):305-312.
[5] Ugur Nigiz F, Durmaz Hilmioglu N. Green solvent synthesis from biomass based source by biocatalytic membrane reactor. International Journal of Energy Research. 2015.
[6] Vu DT, Lira CT, Asthana NS, Kolah AK, Miller DJ. Vapor-liquid equilibria in the systems ethyl lactate ethanol and ethyl lactate water. Journal of Chemical & Engineering Data. 2006; 51(4):1220-1225.
[7] de Paiva, Eduardo Jose Mendes, Sterchele S, Corazza ML, Murzin DY, Wypych F, Salmi T. Esterification of fatty acids with ethanol over layered zinc laurate and zinc stearate– Kinetic modeling. Fuel. 2015; 153:445-454.
S
[image:6.595.47.284.614.763.2][8] Zhang Y, Ma L, Yang J. Kinetics of esterification of lactic acid with ethanol catalyzed by cation-exchange resins. Reac-tive and Functional Polymers. 2004; 61(1):101-114.
[9] Yadav G, Kulkarni H. Ion-exchange resin catalysis in the synthesis of isopropyl lactate. Reactive and Functional Poly-mers. 2000; 44(2):153-165.
[10]JagadeeshBabu P, Sandesh K, Saidutta M. Kinetics of esteri-fication of acetic acid with methanol in the presence of ion exchange resin catalysts. Industrial & Engineering Chemistry Research. 2011; 50(12):7155-7160.
[11]Pereira CS, Silva VM, Rodrigues AE. Fixed bed adsorptive reactor for ethyl lactate synthesis: Experiments, modelling, and simulation. Separation Science and Technology. 2009; 44(12):2721-2749.
[12]Dassy S, Wiame H, Thyrion FC. Kinetics of the liquid phase synthesis and hydrolysis of butyl lactate catalysed by cation exchange resin. Journal of Chemical Technology and Bio-technology. 1994; 59(2):149-156.
[13]Delgado P, Sanz MT, Beltrán S. Kinetic study for esterifica-tion of lactic acid with ethanol and hydrolysis of ethyl lactate using an ion-exchange resin catalyst. Chemical Engineering Journal. 2007; 126(2):111-118.
[14]Mulder M. Basic Principles of Membrane Technology Second Edition. : Kluwer Academic Pub; 1996.
[15]Calvo JI, Bottino A, Capannelli G, Hernández A. Pore size distribution of ceramic UF membranes by liquid–liquid dis-placement porosimetry. Journal of Membrane Science. 2008; 310(1):531-538.
[16]Gobina, E. (2006). Apparatus and Method for separating gas-es. United State patent. Patent No.7,048,778B2.. Robert Gor-don University, Aberdeen, UK.
[17]Li H, Schygulla U, Hoffmann J, Niehoff P, Haas-Santo K, Dittmeyer R. Experimental and modeling study of gas trans-port through composite ceramic membranes. Chemical Engi-neering Science. 2013;
[18]Edidiong Okon, Habiba Shehu, Edward Gobina. Experimental Characterisation of Cation-exchange Resin for Biomass Green Solvent Production. International Journal of Scientific Engi-neering and Technology. 2016; 5(4); Pp 173 – 179.
[19]Miao S, Shanks BH. Mechanism of acetic acid esterification over sulfonic acid-functionalized mesoporous silica (2011). Journal of Catalysis. 279(1):136-143.