A new formulation of the external field effect in MOND and numerical
simulations of ultra-diffuse dwarf galaxies – application to NGC
1052-DF2 and NGC 1052-DF4
Hosein Haghi,
1‹Pavel Kroupa,
2,3Indranil Banik ,
2,4Xufen Wu ,
5,6Akram Hasani Zonoozi,
1,2Behnam Javanmardi ,
7,8Amir Ghari,
1Oliver M¨uller,
9J¨org Dabringhausen
2and Hongsheng Zhao
4,101Institute for Advanced Studies in Basic Sciences, Physics department, Gavazang road, Zanjan, 4513766731 Zanjan, Iran 2Helmholtz-Institut f¨ur Strahlen- und Kernphysik, University of Bonn, Nussallee 14-16, D-53115 Bonn, Germany
3Charles University, Faculty of Mathematics and Physics, Astronomical Institute, V Holeˇsoviˇck´ach 2, CZ-18000 Praha 8, Czech Republic 4Scottish Universities Physics Alliance, University of St Andrews, North Haugh, St Andrews, Fife KY16 9SS, UK
5CAS Key Laboratory for Research in Galaxies and Cosmology, Department of Astronomy, University of Science and Technology of China, Hefei, 230026, P R China
6School of Astronomy and Space Science, University of Science and Technology of China, Hefei 230026, China 7School of Astronomy, Institute for Research in Fundamental Sciences (IPM), PO Box 19395-5531, Tehran, Iran
8LESIA, Observatoire de Paris, Univ. PSL, CNRS, Sorbonne Univ., Univ. Paris Diderot, Sorbonne Paris Cit´e, 5 Place Jules Janssen, F-92195 Meudon, France 9Observatoire Astronomique de Strasbourg (ObAS), Universite de Strasbourg - CNRS, UMR, F-67000 Strasbourg, France
10Department of Physics and Astronomy, LaserLaB, Vrije Universiteit, De Boelelaan 1081, NL-1081 HV Amsterdam, the Netherlands
Accepted 2019 May 23. Received 2019 May 22; in original form 2019 April 5
A B S T R A C T
The ultra-diffuse dwarf galaxy NGC 1052-DF2 (DF2) has 10 (11) measured globular clusters (GCs) with a line-of-sight velocity dispersion ofσ =7.8−+52..22 km s−1(σ =10.6+3
.9
−2.3 km s−1).
Our conventional statistical analysis of the original 10 GCs givesσ =8.0+−43..30 km s−1. The
overall distribution of velocities agrees well with a Gaussian of this width. Due to the non-linear Poisson equation in MOND, a dwarf galaxy has weaker self-gravity when in close proximity to a massive host. This external field effect is investigated using a new analytic formulation and fully self-consistent liveN-body models in MOND. Our formulation agrees well with that of Famaey and McGaugh. These new simulations confirm our analytic results and suggest that DF2 may be in a deep-freeze state unique to MOND. The correctly calculated MOND velocity dispersion agrees with our inferred dispersion and that of van Dokkum et al. if DF2 is within 150 kpc of NGC 1052 and both are 20 Mpc away. The GCs of DF2 are however significantly brighter and larger than normal GCs, a problem which disappears if DF2 is significantly closer to us. A distance of 10–13 Mpc makes DF2 a normal dwarf galaxy even more consistent with MOND and the 13 Mpc distance reported by Trujillo et al.. We discuss the similar dwarf DF4, finding good agreement with MOND. We also discuss possible massive galaxies near DF2 and DF4 along with their distances and peculiar velocities, noting that NGC 1052 may lie at a distance near 10 Mpc.
Key words: gravitation – galaxies: distances and redshifts – galaxies: dwarf – galaxies: indi-vidual: NGC 1052-DF2 – galaxies: kinematics and dynamics – dark matter.
1 I N T R O D U C T I O N
Amongst the most competitive solutions to the missing mass
problem are the standard cosmologicalCDM model (Ostriker &
Steinhardt1995) and the Milgromian dynamics (MOND) theory,
E-mail:[email protected]
which was proposed by Milgrom (1983a) at a similar time to when
the notion of dark matter came to be taken seriously (Ostriker &
Peebles1973). Although it is generally thought that the dark matter
model is successful on large scales (e.g. Planck Collaboration
XIII 2016), dark matter particles have not been detected after
much experimental effort (e.g. Hoof, Geringer-Sameth & Trotta
2018). Moreover, the results of high-resolutionN-body simulations
do not seem to be compatible with observations on galactic and
cosmological scales (Kroupa et al.2010; Peebles & Nusser2010;
Kroupa2012,2015; Bullock & Boylan-Kolchin2017; Bose et al.
2018; Haslbauer et al.2019).
MOND can be formulated as space-time-scale invariance
(Mil-grom2009; Wu & Kroupa2015). This is an excellent description of
gravitation within Milgromian dynamics (Milgrom1983a;
Beken-stein & Milgrom1984; Famaey & McGaugh 2012; Bullock &
Boylan-Kolchin 2017). In MOND, a galaxy with an internal
acceleration larger than Milgrom’s constanta0≈3.8 pc Myr−2; is in
the Newtonian-gravitational regime which breaks space-time-scale invariance, while for lower accelerations the equations of motion are space-time-scale invariant, representing the MOND regime. MOND predicts that each isolated galaxy has a phantom dark matter halo which can be described mathematically as a Newtonian isothermal potential, causing the gravitating mass of the galaxy to exceed its inertial mass composed of normal, baryonic matter. In the external field of another galaxy, the non-linear MOND theory predicts this phantom dark matter halo to be reduced such that the internal dynamics of a system depends on the positions of nearby galaxies, even if they exert no tides. This external field effect (EFE) constitutes an important prediction of MOND which follows directly from its
governing equations (Bekenstein & Milgrom1984; Milgrom1986).
Observationally, the EFE can be tested by studying low-mass dwarf galaxies in the vicinity of major host galaxies. It has been successfully applied in the Local Group (McGaugh & Milgrom
2013), in particular to correctly predict the very low velocity
dispersion of Crater 2 (McGaugh 2016; Caldwell et al. 2017).
Evidence for the EFE has been found in the rotation curves of
galaxies (Wu & Kroupa2015; Haghi et al.2016; Hees et al.2016),
the Milky Way escape velocity curve (Banik & Zhao2018a) and in
the asymmetric tidal tail of the globular star cluster Pal 5 (Thomas
et al.2018).
In this context, it is interesting to note the observations by van
Dokkum et al. (2018b) of NGC 1052-Dragonfly 2 (DF2),1which
was previously discovered by Fosbury et al. (1978, plate 1). van
Dokkum et al. (2018b) used the line-of-sight (LoS) velocities of its
10 globular clusters (GCs) as bright tracers of its potential, which is consistent without dark matter in a Newtonian context.
Another dwarf galaxy was recently discovered by van Dokkum
et al. (2019b). NGC 1052-DF4 (DF4) is in close projected proximity
to DF2 with similar unusual size, luminosity, morphology, globular cluster population and velocity dispersion. Based on the radial velocities of 7 GCs associated with DF4, they derived a Newtonian dynamical mass-to-light ratio of about unity.
These galaxies are studied here in order to test MOND and shed additional light on their possible origin. In Section 2, we introduce a new set of fitting functions to calculate the global LoS velocity dispersion of a non-isolated stellar system lying in the external field of a host galaxy as a function of the internal and external gravitational field. Our detailed formulation is compared with the
EFE formulation by Famaey & McGaugh (2012). In Section 3.1,
we compare the MOND-predicted velocity dispersion of the GC system with the observed velocity dispersion of DF2. The first
N-body numerical MOND modelling of DF2 is also documented
in Section 3.3. We then address the unusual appearance of DF2, finding that if it is only 13 Mpc away instead of the 20 Mpc
distance estimated by van Dokkum et al. (2018b), it would also
be consistent with MOND, even if it were isolated (Section 3.4). A
1For a review of the discovery history and proper name of this galaxy (here referred to in short as DF2), see Trujillo et al. (2019).
smaller distance of 13 Mpc was in fact recently suggested by Trujillo
et al. (2019). In Section 4, we apply our analytical formalism to
the recently discovered NGC 1052-DF4 (DF4; van Dokkum et al. 2019b). Our results show that it can also be explained in MOND thanks to its weak self-gravity, which renders it susceptible to the EFE. We provide our conclusions in Section 5, emphasizing that, given current measurement uncertainties, the NGC 1052, DF2, and DF4 system may be at a distance of 10 Mpc.
2 A N A LY T I C D E S C R I P T I O N O F T H E V E L O C I T Y D I S P E R S I O N
The velocity dispersion σ of DF2 is a measure of its potential
assuming virial equilibrium. In this section, we obtain the MOND
expectation for σ. This prediction has no free parameters but
depends on the dwarf’s baryonic massMDF2, effective radiusre,
distanceDfrom the observer and its separationDsepfrom the host
galaxy with baryonic massMNGC 1052, which defines the external
field.
A formulation of how the velocity dispersion of a self-gravitating system depends on the internal and external fields is made available here in the form of analytical functions. This formulation is
equivalent to but generalizes that available in Kroupa et al. (2018).
If DF2 is in dynamical equilibrium at a separationDsepfrom NGC
1052, then the LoS velocity dispersion σM, EF can be calculated
explicitly as a function of the internal and external accelerations in MOND.
The globally averaged one-dimensional LoS velocity dispersion
σM, EFof a non-isolated stellar system, when the external gravity is much weaker or stronger than the internal gravity, and also in the
intermediate regime was quantified by Haghi et al. (2009), using
the numerical MOND potential solver code N-MODY (Londrillo &
Nipoti2009). Haghi et al. (2009) formulated a functional
representa-tion forσM, EFin the intermediate regime (ai≈ae≤a0) for different
values of the external field and quantified the different asymptotic behaviour (i.e. in the Newtonian, the deep-MOND, and the external-field-dominated regimes). The formulation was presented as their equations (16) and (17) with coefficients provided for different
values of ae in their table 1. Here, an analytical formulation is
found for the data in that table, allowingσM, EFto be calculated as
a function of the internal field in a system with massMexposed to
an external fieldae.
The 1D (LoS) MOND velocity dispersionσM, EF(in km s−1) for a
system of baryonic massMand 3D half-mass radiusrhwith internal
accelerationai≡G M/
2r2
h
is
log10σM,EF=log10σM+F(ae), (1)
where the velocity dispersion of an isolated system
σM =
4 81G M a0
1 4
×(1+0.56 exp (3.02x))0.184, (2)
x≡log10(ai/a0) and
F(ae)= −A(ae) 4 ln exp − x
A(ae)
+B(ae)
+C(ae)
, (3)
with G being Newton’s gravitational constant. Note that
equa-tions (1)–(3) supersede the equation used by van Dokkum et al. (2018b) by a correction factor which ensures the correct behaviour
as the internal acceleration rises abovea0and the dynamics become
Newtonian. These formulae are chosen because they reproduce well the previous analytical velocity dispersion estimators (Milgrom
1994; McGaugh & Milgrom2013) for systems in the external-field
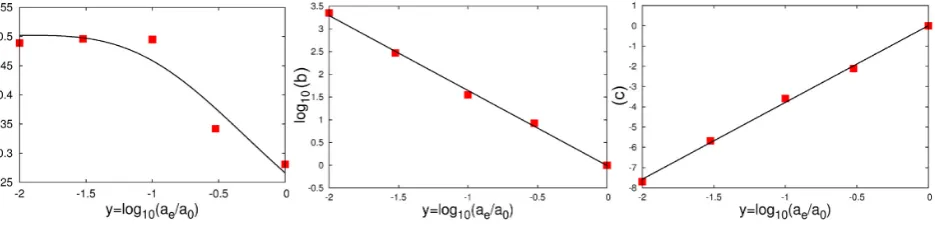
Figure 1. The best-fitting functionsA,B, andCto the data in table 1 in Haghi et al. (2009) in dependence of the external acceleration (y).
Figure 2. The LoS velocity dispersion for a stellar system as a function of its internal acceleration when embedded in different external accelerations. The dashed lines show the results using the coefficients given in table 1 of Haghi et al. (2009). The solid lines show the velocity dispersion using our best-fitting functionsA,B, andC(equation 6) to the data in that table. Thex-axis gives the Newtonian internal acceleration of the system. In order to have different Newtonian accelerations, we vary the half-mass radii but use a fixed mass ofMDF2=2×10⁸M.
dominated case (σM,EF=
√
G M a0/(4rhae)) andσM,EF≈σM=
√
4G M a0/81 for the isolated deep-MOND regime (Milgrom
1995) and the N-MODY results.
We fit the data in Haghi et al. (2009, table 1) using the functions
A,B, andCwith argumenty≡log10(ae/a0):
A(ae)= 5.3
10.56+(y+2)3.22, (4)
B(ae)=10−(1.65y+0.0065)
, (5)
C(ae)=3.788y+0.006. (6)
These fitting functions are shown in Fig.1. Therefore, for any
non-isolated system with known external acceleration ae, it is
possible to calculateσM, EFusing these functions.
To visualize the effect of different external accelerations, we plot the MONDian velocity dispersion as a function of internal
acceleration from a weak to a strong external field (Fig.2). In order
to see how well these fitting functions reproduce the previous results
of Haghi et al. (2009), we compare the LoS velocity dispersion
found using the best-fitting functionsA,B, andC(equation 6) with
the result of equation (1) using the coefficients given in table 1 of
Haghi et al. (2009).
It should be noted that our three fitting functions are arbitrarily
chosen because they reproduce the results of Haghi et al. (2009) very
well. Although functionA(ae) in Fig.1does not perfectly match
the simulated data, Fig.2shows that the LoS velocity dispersion
resulting from our best-fitting functions are in excellent agreement with those calculated using the coefficients given in table 1 of Haghi
et al. (2009). There is at most a 0.1 per cent difference between the
numerically simulated values in table 1 of Haghi et al. (2009),σtable
and our analytic fit in Fig.1, i.e.|σtable−σM, EF|/σM, EF<0.001.
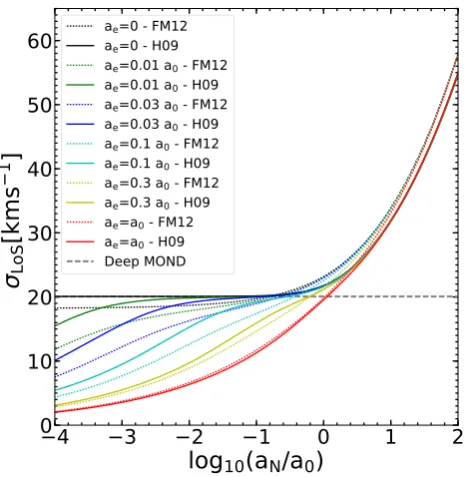
2.1 Comparison with Famaey & McGaugh (2012)
As another check on our analytical formulation of the velocity dispersion, we compare it with the ansatz proposed by Famaey &
McGaugh (2012) considering the net MOND effect in one
[image:3.595.56.544.201.451.2]Figure 3. The predicted global 1D LoS velocity dispersion including the EFE for stellar systems embedded in different external accelerations (different colours) is depicted as a function of internal acceleration using two different approaches. The ansatz proposed by Famaey & McGaugh (2012) is shown by dotted lines and the analytical quantification of the EFE by Haghi et al. (2009) using a MONDN-body integrator is shown as solid lines. Thex-axis gives the Newtonian internal acceleration of the system. As expected, the deep MOND velocity dispersion is constant since the mass is fixed in all models.
dimension (their equation 59). When ai ≈ ae < a0, the object
is quasi-Newtonian i.e. Newton’s law of Gravity applies with an
effective gravitational constant Geff ≥ G (Famaey & McGaugh
2012; McGaugh & Milgrom2013; Famaey, McGaugh & Milgrom
2018; M¨uller, Famaey & Zhao2019). According to the Famaey &
McGaugh (2012) formulation, the MOND acceleration aat the
half-light radius is
(a+ae)μ
a+ae
a0
=aN+aeμ
ae
a0
, (7)
whereμis the MOND interpolating function,ais the MONDian
internal gravitational field,aeis the external field from the host,
andaN=GM/2rh2is the Newtonian internal gravitational field for
the mass embedded within the 3D deprojected half-mass radius
rh. Using the simple interpolating function (Famaey & Binney
2005), we solve this equation for a. The external acceleration
can be approximated byae = v2/Dsep, wherev is the rotational
velocity of the external galaxy andDsepis the separation between
the two objects. Adopting the mass estimator in Wolf et al. (2010) to
calculate the LoS velocity dispersion asσlos=
√
GeffM/(6rh), one can calculate the true velocity dispersion of the system, corrected for the external field. Here, the effective gravitational constant in
MOND is defined asGeff=GN[a(rh)/aN(rh)]. In Fig.3, we show the
MONDian velocity dispersion as a function of internal acceleration for weak to strong external fields using the formulation of Famaey &
McGaugh (2012) (dotted lines) and Haghi et al. (2009) (solid lines).
It is important to mention that we calculated σlos using the
Famaey & McGaugh (2012) relation in the isolated deep-MOND
regime for DF2 and obtained a value of 18 km s−1, which is
10 per cent lower than the deep-MOND prediction of 20 km s−1for
the isolated system. In the Newtonian regime, the velocity
disper-sion from Famaey & McGaugh (2012) is 5 per cent higher than the
values calculated in our formalism. The Famaey & McGaugh (2012)
formula thus leads to a velocity dispersion smaller by 10 per cent in the MOND regime and larger by 5 per cent in the Newtonian regime compared to our analytical formulation. Therefore, the global 1D LoS velocity dispersion of a non-isolated stellar system lying in the intermediate external-field regime probably differs by 10–15 per cent between these formalisms.
This could be due to the different interpolating function used
in the MONDN-body integrator (Haghi et al.2009). It should be
noted that to calculateσM, EFwith the Famaey & McGaugh (2012)
ansatz, we use the Newtonian mass estimatorσlos=0.36
√ GM/Rh
in Haghi et al. (2009) instead of the Wolf et al. (2010) mass
estimatorσlos=0.41
√
GM/Rh). This could be another source of difference between the results of our analytic formulation and the
Famaey & McGaugh (2012) ansatz. In any case, the difference
can be practically neglected in view of the typical measurement uncertainties.
3 N G C 1 0 5 2 - D F 2
In this section, the above analytic formulae are applied for the case
of DF2 and compared withN-body simulations. The NGC 1052
group has a systemic velocity of 1425 km s−1 with a galaxy–
galaxy dispersion of 111 km s−1 (van Dokkum et al. 2018c).
The main group host galaxy NGC 1052 has a baryonic mass
MNGC 1052=1011M(Bellstedt et al.2018) if it lies at a distance
of 20 Mpc. If DF2 is at its projected distance to NGC 1052 then the
two galaxies areDsep=80 kpc apart, but a more likely distance
isDsep≈80
√
3/2=98 kpc as the sky plane contains two of the
three space dimensions.
van Dokkum et al. (2018b) assume that DF2 is located at a
distance ofD=20 Mpc in the NGC 1052 group. This implies that
the effective radius of its population of 10 GCs isre=3.1 kpc, the
stellar body of the galaxy hasre≈2.2 kpc and its absoluteV-band
magnitude is MV = −15.4 mag, corresponding to a luminosity
LV=1.1×10⁸L. We furthermore assume (like van Dokkum
et al.2018b) that the mass-to-light ratio of the stellar population
isM∗/LV=2, while spectroscopy suggests a slightly lower value
of 1.6 (Dabringhausen & Fellhauer2016). These values forM∗/LV
are in any case well consistent with typical dwarf galaxies in this luminosity range (see e.g. fig. 9 in Dabringhausen & Fellhauer 2016).
3.1 The inferred velocity dispersion of NGC 1052-DF2
Using the 10 GCs of DF2, van Dokkum et al. (2018a) foundσ=
7.8+−52..22km s−1. Here, we revisit the velocity dispersion calculation,
which is important for the conclusions as to how much dark matter is contained in DF2 and whether MOND can be falsified using the 10 GCs with measured radial velocities as was suggested by van
Dokkum et al. (2018a).
We model the true GC radial velocities as following a Gaussian
distribution about some meanμwith intrinsic dispersionσint. This
stands in contrast to the biweight distribution (Beers, Flynn &
Gebhardt1990) favoured in van Dokkum et al. (2018b) and also
used in Kroupa (1997), but a Gaussian/normal distribution is the
simpler model and is in fact often realized in nature, since the central limit theorem states that a distribution arising from different random processes approaches the Gaussian distribution. To determine the
likelihood of a particular model (≡combination of μ and σint),
0 2 4 6 8 10 12 14 16 18 20 22 24 26 28 30
Velocity dispersion, km/s
0 0.01 0.02 0.03 0.04 0.05 0.06 0.07 0.08 0.09 0.1 0.11 0.12
[image:5.595.49.283.55.222.2]Probability
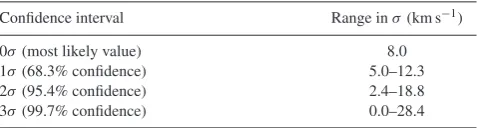
Figure 4. Our marginalized probability distribution for the intrinsic velocity dispersion amongst the 10 GCs observed by van Dokkum et al. (2018b). The most likely dispersion is 8.0 km s−1, with a 68.3 per cent confidence interval of 5.0–12.3 km s−1(other confidence intervals are given in Table1). Table 1. Our inferred 0σ, 1σ, 2σ, and 3σequivalent confidence intervals onσint.
Confidence interval Range inσ(km s−1)
0σ(most likely value) 8.0
1σ(68.3% confidence) 5.0–12.3
2σ(95.4% confidence) 2.4–18.8
3σ(99.7% confidence) 0.0–28.4
we use the fact that a normal distribution with dispersionσ has a
probability
P ∝ 1 σe
−(Data−Model)2
2σ2 . (8)
A measurement can differ from the mean due to both measure-ment errors and intrinsic dispersion. Assuming both are Gaussian, we can add these in quadrature. Thus, the probability of a model is
P(μ, σint) ∝ N
i=1 1
σi
e−
(vr,obs,i−μ)2
2σi 2 , (9)
σi2 =σobs,i2+σint2, (10)
where the intrinsic velocity dispersion of the GC system isσint
and the uncertainty on the velocity measurement of theithGC is
σobs, i. Using this procedure on a grid of values in (μ,σint), we obtain the probabilities of different models relative to the most likely model (see Appendix A for more details). Marginalizing over
the systemic radial velocityμ, we obtain the probability distribution
ofσint(Fig.4). At the 68.3 per cent confidence level,σint=8.0+−43..30
km s−1(other confidence intervals are listed in Table 1). Due to
measurement errors, this is slightly lower than the root mean square dispersion of the radial velocities. However, it is not much lower,
as is readily apparent from the data−GCs 39 and 92 have radial
velocities differing by 29 km s−1 but σ
obs,i≤7 km s−1 in both
GCs (van Dokkum et al.2018b, fig. 1). This suggests thatσint≈
8 km s−1, as confirmed by the present analysis. This revised velocity
dispersion shows DF2 to be in excellent agreement with the expected
MOND value (Kroupa et al.2018). It should be noted that our
inferred value agrees quite well with that of van Dokkum et al. (2018a), which improves on van Dokkum et al. (2018b) by including
more data. Moreover, our result is consistent with the most recent
estimation of the velocity dispersion of DF2 by Martin et al. (2018)
when allowing for the possibility that some GCs may be interlopers. Similarly to their analysis, we also find no compelling evidence that
interlopers affect our inferredσint(FigsA1andA2).
3.2 Analytic expectations
Having inferred the internal velocity dispersion of DF2 (Fig. 4),
its expected dependence onDsepandMNGC 1052 is shown in Fig.5
using the analytic formulation of MOND calibrated using numerical
simulations (Section 2). For the host massMNGC 1052=1011M,
the velocity dispersion of DF2 is σM,EF=12 and 14 km s−1for
Dsep=80 and 98 kpc, respectively. This is clearly in agreement
with the here inferred velocity dispersion (Section 3.1) and the
value arrived at by van Dokkum et al. (2018a),σ =7.8+−25..22 km s−1,
within their 2σ confidence range. Another recently determined
stellar velocity dispersion of DF2 also agrees with our MOND
calculations (Emsellem et al. 2019). They measured the velocity
dispersion of GCs in DF2 by spectroscopic analysis and got a
value of 10.6+3.9
−2.3km s−
1. Moreover, they also studied the velocity
dispersion of stars in the dwarf galaxy, obtaining 10.8+−34..20km s−1.
These values agree well with the MOND expectation, as does the
recent stellar body measurement of 8.5+−23..31km s−1by Danieli et al.
(2019).
IfDsep>150 kpc, then DF2 would be isolated (unless another
major galaxy is in its vicinity) and the expected MOND velocity
dispersion would be σM≈20 km s−1 (equation 2). This would
challenge MOND with just over 2σ confidence according to the
velocity dispersion reported by van Dokkum et al. (2018a,b) but
is compatible within the 3σ confidence range of the here obtained
velocity dispersion using the same data. DF2 is thus most likely in a quasi-Newtonian state, confirming a central MOND prediction if
it is indeed close to NGC 1052 (Famaey et al.2018; Kroupa et al.
2018).
3.3 N-body MOND models
Since the size of the ultra-diffuse dwarf galaxy is a few kpc and
its velocity dispersion is a few km s−1, the crossing time for its
stars is 1 Gyr. If such a galaxy moves outwards from its pericentre with a high orbital speed, it may not be able to retain dynamical equilibrium when it is far away from the host galaxy, so that it becomes frozen in the quasi-Newtonian regime. In this case, the velocity dispersion is lower than expected if dynamical equilibrium
is assumed. This memory effect (Haghi et al.2009; Wu & Kroupa
2013a) is considered in the following usingN-body models. We model DF2 as being in orbit around a purely baryonic NGC 1052, which we model as an analytical oblate Hernquist profile
(Hernquist1990) with axial ratio of 1:1:0.7, a major axis of 2 kpc
and baryonic mass ofMNGC 1052=1011M(Bellstedt et al.2018).
DF2 is represented using 105 equal-mass particles which are
integrated along their orbits using the N-MODY code (Londrillo &
Nipoti2009) that considers only a uniform EFE but not tides (Wu &
Kroupa2013a). The DF2 baryonic mass distribution is a Plummer
model, with an overall mass of MDF2=2×10⁸M with
half-mass radiusrh=3 kpc (model U1) andrh=4 kpc (model U2). The
equilibriumN-body initial conditions are constructed in Newtonian
dynamics and then the global velocities of the dwarf particles are
increased by the virial ratio√−W /2K, whereWis the MONDian
potential energy and K is the Newtonian kinetic energy (Wu &
Kroupa2013a).
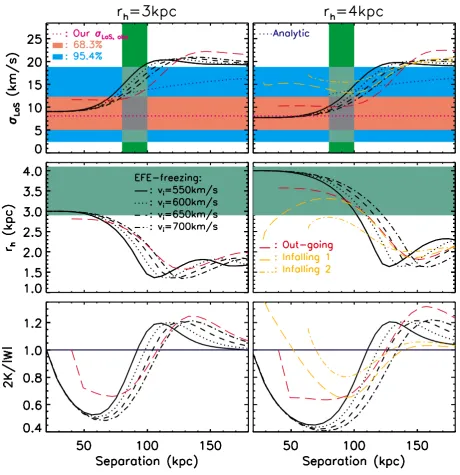
[image:5.595.47.286.312.376.2]Figure 5. Upper panels: The LoS MOND velocity dispersionσM, EF(equation 1) is shown as a dotted dark blue line in dependence of the separationDsep between DF2 and NGC 1052 for a baryonic mass ofMNGC 1052=1011MandDsep>80 kpc. The vertical green region indicates the expanse between the minimum separationDsep=80 kpc and the most likely distanceDsep=80√3/2≈98 kpc. The 1σand 2σranges on the here constrained velocity dispersion (Section 3.1),σ=8.0+−43..30 km s−1, are shown as horizontal coloured regions. The analytically calculated velocity dispersionσ
M, EF(only shown forDsep >80 kpc) approaches the isolated valueσM=20 km s−1asymptotically for largeDsep. It declines with decreasing distance and increasing mass because the external field of NGC 1052 suppresses MONDian self-gravity leading to Newtonian behaviour in the case whenai ae. For the nominal host mass MNGC 1052=1011M(Bellstedt et al.2018) and ifD=98 kpc, the MOND velocity dispersion is in agreement within the 2σconfidence range of the here measured value. Black lines show the simulated N-MODY LoS velocity dispersion of DF2 as a function ofDsepfor different orbits with different pericentre velocities. The left-hand panels represent the simulated dwarf model U1 with an initial half-mass radiusrh=3 kpc and the right-hand panels are for model U2 withrh=4 kpc. The PoR simulation results are shown as red and gold lines, with model parameters given in Table2. Middle panels: The sizesrhof the simulated dwarfs versusDsep. The horizontal green region lies between 2.9 and 4.1 kpc, being the deprojected half-light radii of the stars and GCs, respectively. Note how the dwarf contracts when it orbits to a largerDsepbecause its phantom dark matter halo grows asDsepincreases and the external field decreases. This causes the internal acceleration to increase towards the isolated MOND value. Lower panels: The simulated evolving virial ratio of the dwarf versusDsep. Values<1 (below horizontal line) imply a deep-freeze state.
The pericentre distance is assumed to be Dsep=20 kpc, and
this distance along the short axis of the host galaxy is the starting point for the simulations. At this separation, the dwarf has essentially no phantom dark matter halo due to the strong
external field close to the host, making its dynamics nearly Newtonian. The initial relative velocity (which is entirely
out-wards) is varied in the range of [550, 700] km s−1 with an
interval of 50 km s−1. The dwarf has a lingering memory of a
Table 2. The initial parameters of our four PoR models in Fig.5. The viewing direction is thex-axis. The ‘out-going’ models are started at pericentre.
Model Line type
Pericentre (kpc)
Starting position (kpc)
Starting separation (kpc)
Initial relative
speed (km s−1) Initialrh(kpc)
Speed at pericentre (km s−1)
Out-going 1 Red dashed 40 (0, 0, 40) 40 550 3.0 550
Out-going 2 Red dashed 40 (0, 0, 40) 40 550 4.0 550
Infalling 1 Gold dashed 28 (40, 0, 195) 200 400 1.5 553
Infalling 2 Gold dot–dashed 64 (80, 0, 183) 200 400 2.0 487
colder past on an internal crossing time-scale≈6 kpc/8 kms−1≈
0.8 Gyr.
Fig.5shows that the internal dispersion is essentially frozen at
the Newtonian value betweenDsep=20 and 80 kpc. The dwarf
would be observed to lack dark matter here. AtDsep=80 kpc, the
LoS velocity dispersion in the simulations is 8.5< σM, EF/kms−1
<13.3 (U1) and 7.1< σM, EF/kms−1<9.0 (U2). The virial ratios
are below 1 at this separation such that the systems are colder than their equilibrium states, this being the memory effect whereby DF2
is in a deep freeze. The radii of the model dwarfs are 2.1<rh/kpc
<2.9 (U1) and 3.7<rh/kpc <3.9 (U2), both in good agreement
with observations of DF2. Its deprojected 3D circularized half-light
radius is in the range 2.9–4.1 kpc (van Dokkum et al.2018b) if we
assume this is 4/3 of the analogous projected quantity (Wolf et al. 2010).
As DF2 moves further from NGC 1052, the memory effect
disappears near 100<Dsep/kpc<130 (U1) and 120<Dsep/kpc
<150 (U2). These simulations show that an orbit with a higher
velocity can freeze DF2 out to a larger separation. The deep-freeze
state can be recognized when 2K/|W|<1. Moreover, an initially
more diffuse dwarf can be frozen in the quasi-Newtonian regime out to a larger separation. This demonstrates a competition between the orbital time and the crossing time, and an initial ultra-diffuse galaxy moving rapidly from the inner region near a host galaxy can be frozen in quasi-Newtonian dynamics even at a large separation. The observed DF2 may thus be the first example of the memory effect in MOND.
We have also realized two fully self-consistent simulations (including tides and the EFE) with the adaptive-mesh refinement MOND code Phantom of RAMSES (PoR, L¨ughausen, Famaey &
Kroupa 2015) of a U1 and U2 model. These are launched on a
hyperbolic orbit from a larger pericentre atDsep=40 kpc to avoid
strong tidal effects from the host galaxy. The initial relative velocity
is 550 km s−1 perpendicular to the LoS, implying an apocentre
of 1540 kpc. All our galaxy models consist of live particles. To simplify the calculations, the host galaxy, NGC 1052, has a spherical
Plummer density profile with a mass of 1011M
and a half-mass
radius of 1.3 kpc. Both the tidal and external fields are taken into account in these simulations. The model dwarfs are initially in
equilibrium at their pericentres (i.e.Dsep=40 kpc) with cut-off radii
of 10 kpc. After launch, our model dwarf galaxies are temporarily
frozen in the quasi-Newtonian state (bottom panel of Fig.5). At a
distance of 80–100 kpc, 12.1< σM, EF/kms−1<14.1 for the U1
model and 12.8< σM, EF/kms−1<14.7 for the U2 model, consistent
with our N-MODY simulations which only include the EFE. The
parameters of the PoR models are listed in Table2.
For completeness of our analysis, we calculate two PoR models launched from a larger distance of 200 kpc with initial relative
velocity of 400 km s−1directed such that the pericentre is at 28
(64) kpc. These are shown by the gold dashed (dot–dashed) curves
in Fig. 5. We use a starting point 200 kpc away because this
makes DF2 almost isolated initially. The external field from the
host galaxy is 0.05a0such that a more distant starting point would
not make any difference to the external field and tidal effects. In these models, the initial half-mass radius of DF2 is 1.5 (2.0) kpc. The size of the system expands when the dwarf galaxy is near pericentre, compensating for the smaller size of the initial model and matching the observed radius. An even better match could be obtained for a larger initial size, which would somewhat lower the velocity dispersion and make this more in line with observations.
The infalling satellite puffs up (compared to the outgoing cases) and shows a significant increase in the virial ratio, possibly not surviving a second passage. The system is frozen in the MOND
regime near pericentre, i.e. it has a virial ratio>1. At a separation
of 80–100 kpc, the velocity dispersion agrees with the observations
within their 2σerror range. When the separation is beyond 100 kpc,
the prediction from the new model is very similar to those of EFE-only (N-MODY) models.
The GCs are more spread out than the stars of the stellar body of DF2, so the GC velocity dispersion could be slightly lower than our analytical and numerical predictions. This issue does not arise for the stellar velocity dispersion measurements, which are already weighted by luminosity and thus nearly mass-weighted, as in our calculations.
While these experiments are still idealized, they demonstrate that a systematic study of such dwarf satellite galaxies is needed before drawing conclusions about fundamental theory. A more detailed paper is in preparation (Wu et al., in preparation) in which multiple orbits for DF2 will be studied.
In summary, the analytically calculated value ofσM, EFis verified
by N-MODY (a spherical particle-mesh code) and PoR (an adaptive-mesh refinement code) simulations. All our theoretical estimates are consistent with the measured velocity dispersion of DF2.
3.4 The properties of NGC 1052-DF2 at different distances
The above discussion assumed that DF2 is a physical member of the NGC 1052 group with a projected separation of 80 kpc from NGC 1052 which is assumed to be 20 Mpc away (see Section 3.4.4). The
arguments in favour of this are (i) the LoS velocity is+378 km s−1
(3.4σ) with respect to the NGC 1052 group and+293 km s−1with
respect to NGC 1052 and (ii) the non-detection of a gas component
in DF2 (Chowdhury2019; Sardone et al.2019), suggesting it is part
of a galaxy group (Geha et al.2006). In addition, theHubble Space
Telescopeshould have been able to resolve the red-giant-branch stars if this dwarf galaxy is closer than 10 Mpc, unless its stellar population is non-canonical.
The surface brightness fluctuation method can yield inaccurate results because it relies on the number of giant stars per unit
surface area (Jerjen & Rejkuba2001). This depends on the age and
metallicity of the stellar population, the mass distribution of which also depends on the metallicity and star formation rate (Kroupa
et al.2013; Yan, Jerabkova & Kroupa2017; Jeˇr´abkov´a et al.2018).
Galaxies with a high star formation rate are known to be producing
stellar populations overabundant in massive stars (Gunawardhana
et al.2011), while galaxies with a low star formation rate show a
deficit of massive stars (Lee et al.2009; Watts et al.2018). Old
dormant galaxies also show significant variations of their stellar populations: elliptical galaxies may be dominated by very low mass
stars (van Dokkum & Conroy2010), while faint diffuse dwarf
galaxies have a deficit of low mass stars (Gennaro et al.2018)
when compared to the canonical stellar population (Yan et al.2017;
Jeˇr´abkov´a et al.2018).
In the following we discuss the properties of DF2 if it were at
a shorter distance from Earth, by considering its dynamicalM/LV
ratio and the properties of its GC system. Notably, we seek to
illuminate how hard the evidence for aD=20 Mpc distance is
and how much leeway we have for this dwarf to be at about 10–13 Mpc. A particularly important question we seek to touch is which major galaxy (NGC 1052 or NGC 1042) along the LoS can be the host galaxy to which DF2 is a possible satellite. Can NGC 1052 itself be much closer, such that the NGC 1052, DF2 and possibly DF4 (Section 4) system of galaxies might be gravitational bound and at a distance of 10–13 Mpc? The major tension with this suggestion would be the high peculiar velocity such a distance would imply, and so we discuss other precedence cases of correlated galaxy populations which have group radial velocities which deviate from the Hubble flow significantly (Section 3.4.2).
3.4.1 Globular cluster population and specific globular cluster frequency
That the distance of DF2 may differ significantly from 20 Mpc is
indicated by its ten GCs all being 4×brighter and 2×larger than
the GCs of other known galaxies (van Dokkum et al.2018a). The
GC luminosity function of all known galaxies universally peaks at
MV = −7.7 (Rejkuba2012), while that of DF2 peaks atMV =
−9.1 for a distance ofD=20 Mpc. If DF2 were to lie atD=8
Mpc, its GCs would appear normally bright and would have radii consistent with normal GCs.
The number of GCs per luminosity of the host galaxy, the specific frequency, is known to increase with decreasing luminosity of the dwarf galaxy for early-type (i.e. dormant) spheroidal galaxies.
The specific GC frequency,SN =NGC100.4(MV+15), is a measure
of the number of GCs possessed by a galaxy with absolute V
-band magnitudeMV(Elmegreen1999; Georgiev et al.2010; Wu &
Kroupa2013b).
At D=20 Mpc, with NGC = 10 GCs and absolute V-band
magnitude ofMV = −15.4 (van Dokkum et al.2018c), DF2 has
SN=6.9, which is normal for an early-type dwarf galaxy (Georgiev
et al.2010, fig. 3). For the distance range in which DF2 would
have normally bright GCs (8<D/Mpc<13, Fig.6), the absolute
V-band magnitude is betweenMV= −13.3 and−14.3 such thatSN
is between 48 and 19, respectively. TheSNvalue is thus compatible
with normal late-type dwarf galaxies at both distances (20 and 10
Mpc; fig. 3 in Georgiev et al.2010).
3.4.2 The systemic line-of-sight velocity of NGC 1052-DF2
The systemic LoS velocity of its GCs is 1803 km s−1(van Dokkum
et al.2018b) such that if they are bound to DF2 and this velocity were
due to the Hubble flow, thenD≈20 Mpc. The NGC 1052-group
systemic velocity is 1400 km s−1, suggesting physical association
and a similar distance. Can DF2 nevertheless be a foreground dwarf
[image:8.595.315.537.54.223.2]galaxy with for exampleD≈13 Mpc? Trujillo et al. (2019) carried
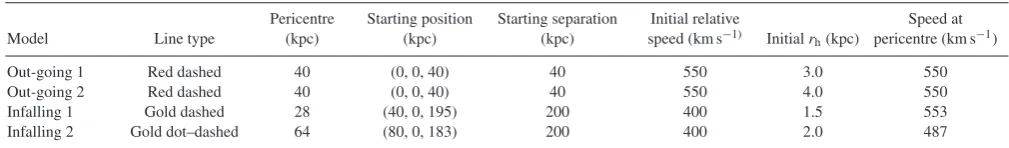
Figure 6. The dependence of the dark matter content on the distance. The V-band dynamical mass-to-light ratioM/LV, Dof DF2 is shown in dependence of its distanceD(equation 11). If theNGC=10 GCs are comparable in luminosity to those of other galaxies, then 8< D/Mpc<13 (indicated by the coloured region), 0.8<re/kpc<1.4, 1.8×10⁷<LV, D/L,V <
4.6×10⁷and 3<M/LV, D/(M/L,V)<5, making DF2 a dwarf galaxy
comparable to the bright Local Group dwarf spheroidal satellite galaxies such as Fornax (Cole et al.2012). The current 3σupper limit on the velocity dispersion is 19.7 km s−1(van Dokkum et al.2018b), corresponding to an isolated baryonic MOND mass ofM=1.8×10⁸M
(equation 2). For a stellarM/LV=2, this impliesLV =9×10⁷L,V. If DF2 would haveD> 18 Mpc and be isolated, then it would constitute a significant MOND outlier due to the absence of the EFE, in addition to its size and GCs making it a very unusual ultra-diffuse galaxy.
out an analysis of all extant stellar population related data and showed that these do suggest a much shorter distance (13 Mpc) than previously indicated (20 Mpc). With this revised distance, the galaxy appears to be a rather ordinary low surface brightness galaxy because the luminosity and structural properties of its GCs are similar to those of other galaxies (Section 3.4.3).
The peculiar velocity of DF2 relative to the CMB reference frame
would be rather large atD≈13 Mpc (vpec =640±25 km s−1;
Trujillo et al.2019). Observationally, such a peculiar velocity is
not out of the question in the real Universe as the Local Group
of galaxies hasvpec = 630 km s−1 (Kogut et al.1993). Another
high-velocity system is the Leo-I group of galaxies, which lies at a
distance of 10 Mpc and has a LoS group velocity of 1000 km s−1,
about 300 km s−1ahead of the Hubble velocityv
H(M¨uller, Jerjen &
Binggeli2018). Other examples can be found in the vicinity of the
Local Group, where galaxies are receding significantly faster than
the Hubble expansion (fig. 5 in McConnachie2012; Pawlowski &
McGaugh2014; Banik & Zhao2018b).
Systems with vpec600 km s−1 are unlikely in a CDM
cosmology but very natural in a MOND cosmology (fig. 14 of
Candlish 2016). The peculiar velocity of DF2 could have been
enhanced if it was flung out by a three-body interaction, perhaps
between it, another putative major galaxy atD≈13 Mpc (e.g. NGC
1042) and a smaller galaxy. If DF2 was flung out away from us, its higher radial velocity than NGC 1052 does not necessarily imply
a larger distance. For example, moving at 300 km s−1for 500 Myr
implies motion by only 150 kpc. NGC 1042 does have a disturbed morphology, suggesting that it was involved in a relatively recent
event (van Dokkum et al.2019a). It is therefore possible that DF2
is an isolated normal dwarf galaxy which by coincidence lies along
the LoS to the NGC 1052 group with a comparable LoS velocity, making it appear extraordinary.
According to Fig.6, DF2 becomes a normal dwarf galaxy with
baryonic mass 5×10⁷M
if 8<D/Mpc<13 (Mateo1998; Martin,
de Jong & Rix2008; McConnachie2012). In this case, it may be an
isolated dwarf galaxy whose MOND velocity dispersion would be
σM≈14 km s−1, within the 2σ confidence range of the observed
velocity dispersion of its GCs (Table1). The high-LoS systemic
velocity of DF2 could be a chance superposition with NGC 1052 if NGC 1052 is at a distance of 20 Mpc (see Section 3.4.4). In this case, a plausible scenario is that DF2 is a normal satellite of NGC 1042, which may be closer to Earth than NGC 1052. At a distance of 13 Mpc, the sky-projected separation of NGC 1042 and DF2
would be only 78 kpc (van Dokkum et al.2019b, fig. 4). However,
the EFE of this galaxy is insignificant for the internal dynamics of DF2 since the baryonic mass of NGC 1042 is about one order of magnitude lower than that of NGC 1052.
3.4.3 Implications for the dark matter content of DF2 of a revised distance scale
A fixedM/LVimpliesDhas no effect on the Newtonian gravitygN
at the effective radiusre. This is because a fixed angular size implies
re∝Dwhile a fixed apparent magnitude impliesM∝D2at fixed
M/LV, thereby causing a cancellation between the changes toM
and those toreunder an inverse square gravity law. As equilibrium
requiresσ2∝r
e ×g(re), wheregis the true gravity, any theory
uniquely linkingg and gN has the property thatσ ∝
√
D. This
is true even in the presence of an external field because this is
independent ofD, if we assume thatDsep/Dremains constant and
the mass of the external field’s source also scales asD2, which is
valid for a fixedM/L.
van Dokkum et al. (2018b) calculate the gravitating mass of
DF2 to beMDF2≈2×10⁸M assumingσ =3.2 km s−1. From
Wolf et al. (2010),MDF2∝σ2re, whereσ=7.8 km s−1is the LoS
velocity dispersion of the GCs in DF2 measured by van Dokkum
et al. (2018a),re=θ Dis the effective radius of the GC system
andθ=31.84 arcsec=1.54×10⁻⁴is the angular radius on the
sky. If DF2 lies at a distanceD, then its absoluteV-band luminosity
becomesLV ,D=(D/20 Mpc)2 LV ,20 Mpc, whereLV ,20 Mpc=1.1×
108L
,V at a distance of 20 Mpc (van Dokkum et al.2018b). As
they obtainedM/LV =2, the mass-to-light ratio in Solar units at
distanceDis
M LV ,D
=2 (D/20 Mpc)−1. (11)
A smaller D would imply a smaller luminosity and effective
radius. This would increase the V-band dynamical mass-to-light
ratioM/LV, Dof its GC system for their observed velocity dispersion.
Assuming this is 8 km s−1, Fig. 6 shows how the Newtonian
dynamicalM/LVratio changes with distance.
3.4.4 Implications for MOND of a revised distance scale
In general, scaling the distance to all relevant objects by some
factoraaffects the velocity dispersion by√abecause the external
and internal gravitational fields remain constant if theM/Lvalues
are held fixed (Section 3.4.3). If NGC 1052 is assumed to be at 20 Mpc while DF2 is at 13 Mpc, then DF2 becomes an isolated object.
Using√13/20≈0.8, we see that the MOND prediction becomes
σM=16 km s−1. Within the 2σconfidence range, this is consistent
with the here inferred dispersion (Table1), theσ =7.8+5.2
−2.2km s− 1
measurement of van Dokkum et al. (2018a) and the DF2’s GC
velocity dispersion of 10.6+−32..93km s−1obtained by Emsellem et al.
(2019) based on eleven GCs. The latter workers also studied
the velocity dispersion of stars in DF2, inferring a dispersion of
10.8+3.2
−4.0km s−
1. All these values agree with the MOND
expec-tation for an isolated DF2 at 13 Mpc, though the 8.5+−23..31km s−1
measurement by Danieli et al. (2019) is uncomfortably low for
MOND.
However, DF2 need not be isolated if it is 13 Mpc from Earth.
The gas-poor nature of DF2 (Chowdhury2019; Sardone et al.2019)
suggests that it may be in or was in a galaxy group. A possible candidate host galaxy is NGC 1052, whose distance is far from
certain. Theureau et al. (2007) reported a value of 17±3 Mpc based
on the Tully–Fisher relation (Tully & Fisher 1977). In a MOND
context, this relation is a consequence of fundamental physics for
isolated systems (Milgrom1983b; McGaugh et al.2000). Thus, it
is quite possible that DF2 and NGC 1052 have a similar distance of
D≈13 Mpc.
If we assume that the distance to both NGC 1052 and DF2 is reduced by the same factor, then the numerical results in Section 3.3 can easily be scaled to a lower distance. The main consequence is
that the calculatedσM, EF is reduced by a factor of 0.8. The
time-scales of the simulations and all velocities in them would also be reduced by the same factor, while the mutual separation would
be reduced by 0.82 = 0.64 and the masses by 0.84 = 0.41. A
20 per cent reduction in the predictedσM, EFmakes our results even
more consistent with observations, especially if these eventually
favour the lower value reported by Danieli et al. (2019).
4 N G C 1 0 5 2 - D F 4
van Dokkum et al. (2019b) announced the discovery of DF4, a
second galaxy lacking dark matter with rather similar properties to DF2 in terms of its size, surface brightness, morphology and distance. They measured the root mean square spread of observed
radial velocities as σobs = 5.8 km s−1 amongst a population of
seven luminous globular clusters that extend out to a distance of 7 kpc from the centre of DF4. Taking observational uncertainties into account, they determined an intrinsic velocity dispersion of
σintr=4.2+−42..42km s−1. Using our analytic formulae for the global 1D
LoS velocity dispersionσM, EFof a non-isolated stellar system lying
in the intermediate external field regime (Section 2), we calculate the expected internal velocity dispersion of DF4 in MOND.
4.1 The external field effect of three possible hosts
Since the group environment of DF4 may host several large galaxies, we have to consider the EFE of all influencing galaxies when calculating the MONDian velocity dispersion of DF4. There are three other bright nearby galaxies in the group close to DF4 in terms of their sky positions. These galaxies are NGC 1052,
NGC 1042, and NGC 1035 with baryonic masses ofMNGC 1052=
1011M
(Bellstedt et al. 2018),MNGC 1042=2.4×10¹⁰M, and
MNGC 1035=1.9×10¹⁰M (M¨uller et al.2019), respectively,
as-suming they are all at a distance ofD=20 Mpc. To estimate the
total baryonic mass of NGC 1042 and NGC 1035 with K-band
absolute magnitudes of MK, 1042 = −8.85 andMK, 1035 = −9.13,
respectively (Brough et al.2006; Skrutskie et al.2006), we follow
the approach in M¨uller et al. (2019). We first convert theK-band
luminosities to stellar masses using a M/LK ratio of 0.8. Then,
we add the gas mass using equation (2) from Di Cintio & Lelli
(2016).
We therefore evaluate the MONDian velocity dispersion of DF4 by considering the EFE on it associated to each bright galaxy separately. In reality, the EFE from all three objects should be considered, but this is left to future work (though we briefly touch
on this in Section 4.1.4). Here, we only consider the separationDsep
between DF4 and its possible host, allowing implicitly the distance,
D, of DF4 from Earth to be significantly uncertain. The expected
dependencies of the internal velocity dispersion of DF4 onDsep
between it and NGC 1052, NGC 1042, and NGC 1035 are shown
in Fig.7.
We show the effect of a reduced distanceD(dotted blue lines)
based on halving the distance to all relevant objects. This simply
involves redrawing the curves withDsep→Dsep/2 andσ→σ/
√
2 (Section 3.4.4). For each assumed distance, the curves start from the corresponding sky-projected separation. We also show dashed
vertical lines atDsep
√
3/2, representing the most likely 3D
separa-tions.
If DF4 and all three candidate hosts were at a similar distance
of D ≈ 10 Mpc rather than 20 Mpc, its MOND-predicted
ve-locity dispersion would be√2×lower. As a result, the isolated
velocity dispersion in the deep-MOND limit would fall from
18.6 to 13.2 km s−1 in the complete absence of the EFE. Of
course, some external field may be present if the object is at
D≈10 Mpc.
4.1.1 NGC 1035
We assume that NGC 1035 and DF4 are at similar distances of
D≈20 Mpc, consistent with the Type II supernova distance to
the former of 22±3 Mpc (Schmidt, Kirshner & Eastman1992) or
18±3 Mpc (Schmidt et al.1994; Poznanski et al.2009). The Tully–
Fisher distance is smaller (14±3 Mpc; Sorce et al.2014), but this
can be understood if the Tully–Fisher relation (Tully & Fisher1977)
is a consequence of MOND for isolated galaxies (Milgrom1983b).
Given the rather low surface brightness of NGC 1035 and the nearby massive galaxies NGC 1042 and NGC 1052, their external fields could reduce the circular velocity of NGC 1035 (Haghi et al.
2016). If the EFE is not accounted for, a 10 per cent reduction in
the circular velocityvf implies that the MOND dynamical mass
must be 40 per cent lower. Assuming a fixedM/L, this is possible
only for a 20 per cent lower distance, sufficient to explain why the Tully–Fisher distance to NGC 1035 is smaller than the Type II supernova distance by about this amount. The available information
thus suggests NGC 1035 to lie atD≈20 Mpc.
Since DF4’s sky-projected distance from NGC 1035 is only
21 kpc (assumingD=20 Mpc), its EFE on DF4 might significantly
lower the latter’s internal accelerations (top panel of Fig. 7).
Although such a small separation is discouraged by lack of tidal
features around NGC 1035 and DF4 (M¨uller et al.2019), the two
galaxies could plausibly be separated by 100 kpc. This in turn
somewhat reduces the MOND expectation forσintr.
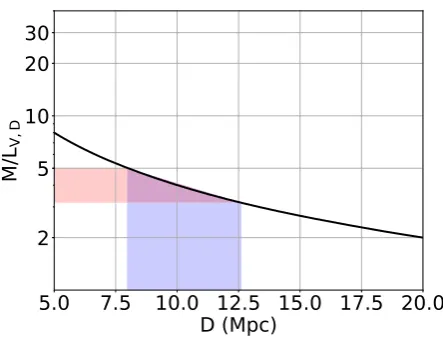
If DF4 and NGC 1035 are close to each other, then tidal stability of DF4 could be an issue (see Section 4.2). For the moment, we simply mention that at a separation of 60 kpc and distance of 20 Mpc, the EFE from NGC 1035 alone is sufficient to bring the MOND-predicted velocity dispersion of DF4 in agreement with the
observed value (van Dokkum et al.2019b) at the 2σ confidence
level (top panel of Fig.7). Because a lower distance reduces the
predicted velocity dispersion, this improves to 1σ agreement if
[image:10.595.309.542.47.522.2]both objects are only 10 Mpc from us and 30 kpc from each other.
Figure 7. The LoS MOND velocity dispersion of DF4 (σM, EF, equation 1) in dependence of the separationDsepbetween it and NGC 1035 (top), NGC 1052 (middle), and NGC 1042 (bottom) for two different distances ofD= 20 and 10 Mpc (solid and dotted lines, respectively). The vertical dash– dotted lines indicate the most likely separationDsep=Dproj√3/2 for each assumedD. The 1σ, 2σ, and 3σranges on the measured velocity dispersion (σ=4.2−+42..42 km s−1; van Dokkum et al.2019b) are shown as horizontal coloured regions. The analytically predicted velocity dispersionσM, EF(only shown forDsep≥Dproj) approaches the isolated value (σM=18.6 km s−1) asymptotically for largeDsep. It declines with decreasing distance due to the EFE.
4.1.2 NGC 1052
Even if NGC 1035 is nowhere near DF4, its observed velocity dispersion is still rather sensitive to other possible hosts due to the low internal acceleration of DF4. In fact, its internal velocity
dispersion is consistent with MOND at the 2σ confidence level
once we consider the effect of NGC 1052 due to its high mass of
MNGC 1052=1011Mat a projected separation of 167 kpc forD=
20 Mpc. This improves to a 1σ agreement if both NGC 1052 and
DF4 are onlyD=10 Mpc away and as close as possible to each
other.
4.1.3 NGC 1042
The baryonic mass of NGC 1042 isMNGC 1042=2.4×10¹⁰M,
roughly 5×less than that of NGC 1052. As a result, NGC 1042 has
only a small effect on the internal dynamics of DF4, even if they
have no LoS separation (middle panel of Fig.7).
4.1.4 Combined effect of multiple hosts
Considering external fields from all these galaxies (assuming they
are all at a similar distanceDfrom Earth and form a galaxy group)
would perhaps lead to a lowerσthan when considering, e.g. NGC
1035 alone. As NGC 1035, NGC 1042, and NGC 1052 are all in a similar direction from DF4, the external fields would add, making this a reasonable approximation in an upcoming project with full
MONDianN-body simulations.
4.2 Tides from NGC 1035
The tidal radius of DF4 would be rather small if it was indeed only 21 kpc from NGC 1035, which is the minimum consistent with their
observed angular separation for a distance ofD=20 Mpc. In this
case, DF4 would be in the process of tidal disruption, contradicting
deep imaging data (M¨uller et al.2019, figure 3). The MONDian
tidal radius of a massmlocated at separationDsep from another
object of massMmis (Zhao2005, equation 14)
rt=0.374D m/M . (12)
Given the total baryonic mass of NGC 1035, the minimum tidal radius of DF4 would be about 1.7 kpc assuming a separation of
Dsep=21 kpc. This is comparable to its observed half-light radius
ofRe=1.6 kpc (van Dokkum et al.2019b). A larger separation
distance≥100 kpc from NGC 1035 leads to a larger tidal radius
≥8 kpc for DF4 such that tides do not affect it very much. Tides
from NGC 1035 would affect DF4 much less if DF4 is at a different distance than NGC 1035. In this case, neither the tidal nor the external field of NGC 1035 would affect DF4. However, our results in this section demonstrate that the EFE from NGC 1052 alone
is sufficient to bringσM, EF in line with observations even if the
distance to both isD=20 Mpc. The agreement improves further if
both DF4 and NGC 1052 are closer to Earth, as long as they are also close to each other. At 10 Mpc, even an isolated DF4 is consistent
with MOND at 2σ. The only problematic case is an isolated DF4
at 20 Mpc, which is just outside the 3σ observational upper limit
(Fig.7).
5 C O N C L U S I O N S
Using previously conductedN-body simulations, we develop a fully
analytical formulation of the MOND external field effect. We use this to calculate the velocity dispersion of the GC system of DF2,
which we predict to be 14 km s−1if MOND is correct. Our analysis
of the 10 (11) observed LoS velocities of its GCs shows this pre-diction to be consistent with observations. Our analytical external field effect calculation agrees well with an independent estimation
of the MONDian velocity dispersion (Famaey & McGaugh2012).
We test our analytical results using the first fully self-consistent
PoR (L¨ughausen et al.2015)N-body models of satellite galaxies
orbiting a live host (Section 3.3). These concur with our analytical formulation and suggest that DF2 may be in a deep freeze state, with an even lower velocity dispersion than calculated analytically
(Haghi et al.2009; Wu & Kroupa2013a).
Before this can be viewed as a confirmation of MOND, the distance of DF2 is addressed critically (Section 3.4). While it cannot be excluded that DF2 is at the nominal distance of the NGC 1052
group (D≈20 Mpc), it is found that it may also be at around half
this distance. If this were the case, then DF2 would be a normal dwarf galaxy consistent with MOND and it may even be a normal dSph satellite galaxy. We note here that NGC 1052 may itself be at
D≈13 Mpc (see Section 3.4.4).
It is also worth noting that the analysis by van Dokkum et al. (2018b) adopted a very smallσ =3.2 km s−1instead of the value
of 8.0 km s−1inferred here from their original data. By including a
revised velocity for one of the GCs, van Dokkum et al. (2018a) later
corrected the velocity dispersion toσ =7.8+5.2
−2.2 km s−1, in better
agreement with the stellar velocity dispersion (Emsellem et al.2019)
and also with MOND (van Dokkum et al.2018a). Moreover, van
Dokkum et al. (2018b) adopted a high stellar population
mass-to-light ratio ofM∗/LV=2 rather than the average value typical for
such systems (M/LV=1.6; see fig. 9 of Dabringhausen & Fellhauer
2016). The distanceD≈20 Mpc adopted by van Dokkum et al.
(2018b) may also seem high, given that DF2 becomes a highly unusual galaxy on grounds unrelated to the correct law of gravity. All these choices push the results towards less dark matter and tension with MOND. Here, we have shown that by taking the data at face value and a more conservative theoretical approach, DF2 is consistent with a central MOND prediction, namely the EFE
(Milgrom1986).
Future observations will need to ascertain if this galaxy is indeed
atD≈20 Mpc and how isolated it is. The null detection of gas in
DF2 (Chowdhury2019; Sardone et al.2019) suggests that it resides
in a group environment and thus feels a significant external field, independently of the assumed gravity law. Our investigation of the DF2 GCs suggests a normal specific GC frequency with a normal size and brightness, if it lies at a distance of 13 Mpc. A recently claimed detection of the tip of its red giant branch does indeed
yield a distance of 13.4±1.1 Mpc (section 4.1 in Trujillo et al.
2019). If the whole NGC 1052 group is at 13 Mpc instead of 20
Mpc, the MOND predicted velocity dispersions should be reduced by 20 per cent, making them more consistent with observations (Section 3.4.4). In this case, the high peculiar velocities of DF2 and of NGC 1052 relative to the CMB are in tension with the
standardCDM cosmological model but are well consistent with
the velocity field expected in a MONDian universe (fig. 14 of
Candlish2016).
In Section 4, we apply our analytic formalism to the recently
discovered DF4 (van Dokkum et al.2019b). Our analysis shows
that the EFE from NGC 1052 could significantly reduce its
MOND-predictedσ. Given their sky-projected separation, the effect could
be strong enough to yield consistency with the observed σ of
DF4 (Fig.7). Even better agreement might be reached if one also
considers the EFE it experiences from NGC 1035. We note that a lower distance than 20 Mpc further improves the agreement but
the EFE from NGC 1042 can have only a small impact (Fig. 7).
DF2 and DF4 would falsify MOND if these objects are completely
isolated. In particular, the 8.5+2.3
−3.1km s−1velocity dispersion of DF2
reported by Danieli et al. (2019) would rule out MOND at 3σ (5σ)
if it lies 13 Mpc (20 Mpc) from Earth.
In aCDM context, the rather low velocity dispersions of DF2 and DF4 suggest that they might be DM-poor tidal dwarf galaxies. In this regard, it is interesting to note that their radial velocities have opposite signs, once the systemic motion of NGC 1052 is subtracted. Thus, they may both be ancient metal-poor tidal dwarf galaxies
orbiting NGC 1052 (Recchi & Kroupa2015). This is reminiscent
of the results obtained by Ibata et al. (2014). The predicted existence
of dark matter free tidal dwarf galaxies in aCDM universe has
been demonstrated conclusively by Haslbauer et al. (2019).
Although DF2 and DF4 seem to contradict MOND at first glance, their velocity dispersions are actually well consistent with MOND expectations once the EFE is included. The EFE is an integral part of MOND that follows directly from its governing equations
(Milgrom1986). Thus, careful analytical and numerical work is
required to judge what MOND really predicts for any individual system. Although not a trivial task, this can in principle be done rather accurately because MOND relies only on the distribution of actually observed baryonic matter.
Finally, it is clear from this discussion that a critical unknown in our understanding of DF2 and DF4 and whether they are associated with NGC 1052 is the distance problem: just how far from us are these galaxies?
AC K N OW L E D G E M E N T S
AHZ and IB are Alexander von Humboldt Fellows. HH is a DAAD visiting scholar. BJ thanks the hospitality of the Stellar Populations and Dynamics Research Group in Bonn and of the AIfA, where this work was done. OM thanks the Swiss National Science Foundation for financial support. XW gives thanks for support from the Natural Science Foundation of China grants numbers 11503025 and 11421303, Anhui Natural Science Foundation grant number 1708085MA20 and the ‘Hundred Talents Project of Anhui Province’.
R E F E R E N C E S
Banik I., Zhao H., 2018a,MNRAS, 473, 419 Banik I., Zhao H., 2018b,MNRAS, 473, 4033 Beers T. C., Flynn K., Gebhardt K., 1990, AJ, 100, 32 Bekenstein J., Milgrom M., 1984,ApJ, 286, 7 Bellstedt S. et al., 2018,MNRAS, 476, 4543 Bose S. et al., 2018, MNRAS, 486, 4790
Brough S., Forbes D. A., Kilborn V. A., Couch W., 2006, MNRAS, 370, 1223
Bullock J. S., Boylan-Kolchin M., 2017, ARA&A, 55, 343 Caldwell N. et al., 2017,ApJ, 839, 20
Candlish G. N., 2016, MNRAS, 460, 2571 Chowdhury A., 2019,MNRAS, 482, L99
Cole D. R., Dehnen W., Read J. I., Wilkinson M. I., 2012,MNRAS, 426, 601
Dabringhausen J., Fellhauer M., 2016,MNRAS, 460, 4492
Danieli S., van Dokkum P., Conroy C., Abraham R., Romanowsky A. J., 2019,ApJ, 874, L12
Di Cintio A., Lelli F., 2016,MNRAS, 456, L127 Elmegreen B. G., 1999,Ap&SS, 269, 469 Emsellem E. et al., 2019,A&A, 625, A76 Famaey B., Binney J., 2005,MNRAS, 363, 603
Famaey B., McGaugh S. S., 2012,Living Rev. Relativ., 15, 10 Famaey B., McGaugh S., Milgrom M., 2018,MNRAS, 480, 473 Fosbury R. A. E., Mebold U., Goss W. M., Dopita M. A., 1978,MNRAS,
183, 549
Geha M., Blanton M. R., Masjedi M., West A. A., 2006,ApJ, 653, 240 Gennaro M. et al., 2018,ApJ, 855, 20
Georgiev I. Y., Puzia T. H., Goudfrooij P., Hilker M., 2010,MNRAS, 406, 1967
Gunawardhana M. L. P. et al., 2011,MNRAS, 415, 1647
Haghi H., Baumgardt H., Kroupa P., Grebel E. K., Hilker M., Jordi K., 2009, MNRAS, 395, 1549
Haghi H., Bazkiaei A. E., Zonoozi A. H., Kroupa P., 2016,MNRAS, 458, 4172
Haslbauer M., Dabringhausen J., Kroupa P., Javanmardi B., Banik I., 2019, A&A, in press
Hees A., Famaey B., Angus G. W., Gentile G., 2016,MNRAS, 455, 449 Hernquist L., 1990,ApJ, 356, 359
Hoof S., Geringer-Sameth A., Trotta R., 2018, preprint (arXiv:1812.06986) Ibata N. G., Ibata R. A., Famaey B., Lewis G. F., 2014, Nature, 511,
563
Jerjen H., Rejkuba M., 2001, A&A, 371, 487
Jeˇr´abkov´a T., Hasani Zonoozi A., Kroupa P., Beccari G., Yan Z., Vazdekis A., Zhang Z.-Y., 2018, A&A, 620, A39
Kogut A. et al., 1993,ApJ, 419, 1 Kroupa P. et al., 2010, A&A, 523, A32 Kroupa P. et al., 2018, Nature, 561, E4 Kroupa P., 1997,New Astron., 2, 139 Kroupa P., 2012,PASA, 29, 395 Kroupa P., 2015,Can. J. Phys., 93, 169
Kroupa P., Weidner C., Pflamm-Altenburg J., Thies I., Dabringhausen J., Marks M., Maschberger T., 2013, The Stellar and Sub-Stellar Initial Mass Function of Simple and Composite Populations. Springer Science and Business Media , Dordrecht, p. 115
Laporte C. F. P., Agnello A., Navarro J. F., 2019, MNRAS, 484, 245
Lee J. C. et al., 2009,ApJ, 706, 599
Londrillo P., Nipoti C., 2009, Mem. Soc. Astron. Ital. Suppl., 13, 89 L¨ughausen F., Famaey B., Kroupa P., 2015,Can. J. Phys., 93, 232 Martin N. F., de Jong J. T. A., Rix H.-W., 2008, ApJ, 684, 1075
Martin N. F., Collins M. L. M., Longeard N., Tollerud E., 2018, ApJ, 859, L5
Mateo M. L., 1998,ARA&A, 36, 435 McConnachie A. W., 2012,AJ, 144, 4 McGaugh S., Milgrom M., 2013,ApJ, 775, 139 McGaugh S. S., 2016,ApJl, 832, L8
McGaugh S. S., Schombert J. M., Bothun G. D., de Blok W. J. G., 2000, ApJ, 533, L99
Milgrom M., 1983a,ApJ, 270, 365 Milgrom M., 1983b,ApJ, 270, 371 Milgrom M., 1986,ApJ, 302, 617 Milgrom M., 1994,ApJ, 429, 540 Milgrom M., 1995,ApJ, 455, 439 Milgrom M., 2009,ApJ, 698, 1630
M¨uller O., Jerjen H., Binggeli B., 2018, A&A, 615, A105 M¨uller O., Famaey B., Zhao H., 2019,A&A, 623, A36 Ostriker J. P., Peebles P. J. E., 1973,ApJ, 186, 467 Ostriker J. P., Steinhardt P. J., 1995,Nature, 377, 600 Pawlowski M. S., McGaugh S. S., 2014,MNRAS, 440, 908 Peebles P. J. E., Nusser A., 2010, Nature, 465, 565 Planck Collaboration XIII, 2016, A&A, 594, A13 Poznanski D. et al., 2009, ApJ, 694, 1067 Recchi S., Kroupa P., 2015,MNRAS, 446, 4168 Rejkuba M., 2012, Ap&SS, 341, 195
Sardone A., Pisano D. J., Burke-Spolaor S., Mascoop J. L., Pol N., 2019, ApJ, 871, L31
Schmidt B. P., Kirshner R. P., Eastman R. G., 1992, ApJ, 395, 366 Schmidt B. P., Kirshner R. P., Eastman R. G., Phillips M. M., Suntzeff N.
B., Hamuy M., Maza J., Aviles R., 1994, ApJ, 432, 42 Skrutskie M. F. et al., 2006, AJ, 131, 1163
Sorce J. G., Tully R. B., Courtois H. M., Jarrett T. H., Neill J. D., Shaya E. J., 2014, MNRAS, 444, 527
Theureau G., Hanski M. O., Coudreau N., Hallet N., Martin J.-M., 2007, A&A, 465, 71