SCOTT, E. J., EVES, F. F., FRENCH, D. P. and HOPPE, R.
Available from Sheffield Hallam University Research Archive (SHURA) at: http://shura.shu.ac.uk/647/
This document is the author deposited version. You are advised to consult the publisher's version if you wish to cite from it.
Published version
SCOTT, E. J., EVES, F. F., FRENCH, D. P. and HOPPE, R. (2007). The theory of planned behaviour predicts self-reports of walking, but does not predict step count. British journal of health psychology, 12 (4), p. 601.
Copyright and re-use policy
Running Head: Walking and the TPB
The Theory of Planned Behaviour predicts self-reports of walking, but
does not predict step count
Emma J. Scott * University of Birmingham
Birmingham, U.K.
Frank F. Eves University of Birmingham
Birmingham, U.K.
David P. French University of Birmingham
Birmingham, U.K.
Roberta Hoppé De Montfort University
Leicester, UK
* Corresponding Author: Emma J Scott, M.Sci
Centre for Sport & Exercise Science Sheffield Hallam University
Collegiate Crescent Campus Sheffield, U.K.
S10 2BP
The Theory of Planned Behaviour predicts self-reports of walking, but
does not predict step count
ABSTRACT:
Objectives: This paper compares multiple measures of walking in two studies, and in
the second study, compares how well Theory of Planned Behaviour (TPB) constructs
perform in predicting these different measures.
Methods: In study one, forty-one participants wore a New Lifestyles NL-2000
pedometer for one week. Subsequently, participants completed a questionnaire
containing measures of the TPB constructs and two self-report measures of walking,
followed by two interview measures of walking. For study two, 200 RAF trainee
aircraftsmen wore pedometers for two weeks. At the end of each week participants
completed the questionnaire and interview measures of walking.
Results: Both studies found no significant association between questionnaire
measures of walking and pedometer measures. In study one, the interview measures
produced significant, large correlations with the pedometer measure, but these
relationships were markedly weaker in the second study. TPB variables were found to
explain 22% of variance in intention to walk in study one and 45% of the variance in
study two. In study two, prediction of subsequent measures of behaviour was found to
be weak, except when using a single-item measure of walking.
Conclusions: Recall of walking is poor and accurate measurement by self-report is
problematic. Although the TPB predicts intentions to walk well, it does not predict
actual amount of walking, as assessed by pedometer. Possible reasons for these
findings include the unique nature of walking as an activity primarily used to facilitate
INTRODUCTION:
It is well-established that regular physical activity affords people multiple
physiological and psychological health benefits. These benefits include reduced risk
of coronary heart disease (British Heart Foundation, 2003), hypertension, type 2
diabetes, osteoporosis, obesity and some forms of cancer (Department of Health,
2004; U.S. Department of Health & Human Services [USDHHS] & Centers for
Disease Control & Prevention [CDC], 1996). Regular physical activity also promotes
musculoskeletal health and appears to relieve symptoms of depression and anxiety
(USDHHS & CDC, 1996). Large numbers of the general population, however, do
insufficient exercise to experience these advantages (Department of Health, 2004;
USDHHS & CDC, 1996).
The American College of Sports Medicine (2000) currently promotes a
two-stage approach to physical activity: In order to experience health benefits, such as
those detailed above, every healthy adult should accumulate at least 30 minutes of
moderate intensity physical activity on most days of the week (Pate et al., 1995).
Those who wish to further improve cardiorespiratory and muscular fitness should aim
for an additional 20 minutes of vigorous activity three times per week (Pollock et al,
1998). The first part of these recommendations has lead to a increased emphasis on
„active lifestyle‟ approaches to physical activity promotion, which means
incorporating physical activity into daily life by making more active choices, e.g.
taking the stairs rather than the elevator or selecting active pastimes such as gardening
rather than sedentary ones such as watching television. This, in turn, has lead to
increased interest in promoting walking as form of lifestyle physical activity.
Walking is unique in that it is a near-universally accessible and acceptable
a self-selected moderate-to-brisk pace has been shown to fulfil the moderate intensity
criterion (Murtagh, Boreham & Murphy, 2002). Walking is already the most
frequently reported physical activity behaviour (Fox & Rickards, 2004) and is easy to
accumulate. Few people, however, accumulate the recommended 30 minutes per day
(Department of Health, 2004; USDHHS & CDC, 1996).
To effectively promote walking it is important to understand the factors
determining walking behaviour. The most frequently used models for physical activity
are the Theory of Reasoned Action (TRA; Fishbein & Ajzen, 1975) and it‟s successor,
the Theory of Planned Behaviour (TPB; Ajzen, 1991). The TRA proposes that
behaviour is determined by intention, which in turn is determined by attitudes and
subjective norm. Attitudes towards performing a particular behaviour can be
instrumental, i.e. the expected utility of the behaviour, and affective, i.e. anticipated
feelings towards performing the behaviour (Ajzen & Driver, 1992; Eves, Hoppé &
McLaren, 2003; French et al., 2005; Godin, 1987; Trafimow & Sheeran, 1998).
Subjective norm is the perceived social pressure to perform the behaviour. The TPB
extends this model with the addition of perceived behavioural control (PBC), which is
the perceived ease or difficulty of performing the behaviour. PBC can influence both
intention and behaviour and reflects the fact that external factors can influence a
person‟s behaviour.
A recent meta-analysis confirmed that the TPB is superior to the TRA for the
prediction of both physical activity intentions and actions (Hagger, Chatzisarantis &
Biddle, 2002). Intention was found to be most strongly predicted by overall attitude
with PBC also making a major contribution; subjective norm explained notably less
variance (Symons Downs & Hausenblas, 2005; Hagger et al., 2002). Intention and
(Symons Downs & Hausenblas, 2005). Despite the success of the TPB for exercise,
few studies attempted to predict specific physical activity behaviours, rather than the
generic term “exercise”. Empirical evidence, however, illustrates that different TPB
constructs are involved in the prediction of different forms of physical activity (Ajzen
& Driver, 1992; Bryan & Rocheleau, 2002; Eves et al., 2003). Concerning walking, a
recent study (Eves et al., 2003) found intentions and self-reported behaviour were
predicted less well than a number of other specific types of exercise. Unlike all other
physical activities, there was no contribution of affective attitude to the prediction of
intention to walk.
Research in this area may also be limited by the outcome measures used. TPB
studies most often employ simple, single item self-report measures of behaviour
(Armitage & Conner, 2001; Symons Downs & Hausenblas, 2005), although the
theory does not require this and alternative methods may give more accurate measures
of behaviour (Armitage & Conner, 2001). Pedometers are small devices worn on the
hip that count steps taken, and hence provide an objective measure of walking.
Pedometers are accurate and reliable at different walking speeds (Bassett et al., 1996;
Crouter, Schneider, Karabulut & Bassett, 2003), on a variety of terrains (Bassett et al.,
1996) and in diverse population groups (Cyarto, Myers & Tudor-Locke, 2004;
Stanish, 2004; Wilde, Corbin & Le Masurier, 2004), with the New Lifestyles NL-2000
identified as the best performing model in tests (Crouter et al., 2003; Schneider,
Crouter & Bassett, 2004). It must be acknowledged that no measurement tool is ever
entirely free from error (Johnston, French, Bonetti & Johnston, 2004) and even
pedometers do not produce a perfect measure of walking, the primary source of
invalidity being human error, e.g. forgetting to wear the monitor, and accumulation of
In contrast with the objective measure of walking offered by the pedometer are
subjective measures. These can be divided into questionnaires using global rating
scales and interviews, which require respondents to recall specific episodes of
physical activity. Whilst many of these measures have been validated, most self-report
measures do not provide an accurate estimate of total physical activity (Sallis &
Saelens, 2000). Further, the validity is greater for vigorous than moderate intensity
activities (Sallis & Saelens, 2000). To the best of our knowledge, none of these
measures have been independently validated for walking. Self-report, however,
remains the assessment method of choice for many large scale walking studies (Eyler,
Brownson, Bacak & Houseman, 2003; Hallal et al., 2005; Simpson et al., 2003),
despite the chronic underestimations of self-reported walking compared to pedometer
counts (Bassett, Cureton & Ainsworth, 2000).
A measurement issue of particular relevance to the TPB is that of
compatibility. The principle of compatibility states that in order to maximise
predictive validity the predictor and criterion variables should be compatible, that is,
they should be measured at the same level of specificity with regards to the target,
action, context and time elements of the behaviour (Ajzen, 1988). Courneya (1994)
has since suggested that predictive power could be further improved by ensuring that
the scales, as well as the wording of the items, correspond. For repeated behaviours it
is also recommended that these scales should be continuous rather than dichotomous
(Courneya, 1994). In practice, intention measured on a one to seven scale is matched
with a corresponding one to seven scale for behaviour. For physical activity, however,
the behaviour may not occur at all and hence a zero to seven scale for behavioural
frequency is often employed (e.g. Eves et al., 2003). Considering the repeated
and behaviour used (e.g. Courneya, 1994; Symons Downs & Hausenblas, 2005;
Sutton, 1998), it is perhaps not surprising that many researchers have chosen simple,
single-item self-report measures of behaviour presented in the same format as the
construct measures.
Set against the simplicity of single item measures of behaviour suitable for the
TPB is the more complex structured interview of the 7-day Physical Activity Recall
(PAR: Blair, 1985; Sallis et al., 1985). The PAR interview is often considered the best
self-report measure, given its validation with objective indices of participation
(Montoye, Kemper, Saris, & Washburn, 1996). During the interview participants
itemize all episodes of physical activity over the previous seven days, specifying
duration and intensity. The participant works backwards from the current day aided by
interviewer prompts. This more detailed approach based on prompted recall should
improve accuracy of reporting of physical activity. Recent research, however, has
demonstrated that the PAR produces less accurate reports of low intensity physical
activity than high (Richardson, Ainsworth, Jacobs, & Leon, 2001; Sallis et al., 1985),
suggesting that it may not be well suited to measuring walking.
This paper presents two studies investigating which of several self-report
measures of walking behaviour are most highly associated with the assessments of
walking yielded by pedometer. The second study also explores the effect of different
methods of measuring walking on the ability of the TPB constructs to predict the
behaviour.
STUDY 1:
The first study compared four commonly used self-report measures of walking
employed, one using a simple, single item measure of the type commonly employed
in TPB research on physical activity, the other a composite measure requesting both
the time spent walking for recreation and the time walking as part of daily living.
Time spent walking as part of daily living reflects the current emphasis on
accumulation of activity throughout the day (Pate et al., 1995). Two interview
measures were also used: the 7-day PAR (Sallis et al., 1985) and an active transport
interview. Due to the more detailed retrospection encouraged by the interview
techniques, it was hypothesised that the two interview measures would be more
closely related to the pedometer-recorded step count than the questionnaire measures.
Similarly, regarding the questionnaire measures, the more detailed composite measure
was expected to produce a measure of walking that better related to step count than
the single item measure. Furthermore, it was anticipated that the active transport
interview would provide a more accurate measure by focussing specifically on
walking as transport.
METHODS:
Participants
Forty-one free-living participants (18 male) aged 20.9 ± 3.1 years were
recruited via University noticeboards. Before beginning, participants received an
information sheet, were made aware that they could withdraw at any time, and signed
informed consent forms. The University of Birmingham Safety and Ethics Committee
Procedure
Participants were issued with a New Lifestyles NL-2000 (New Lifestyles Inc.,
Kansas City, MO.) pedometer and instructed in its correct usage. The pedometers
were sealed shut so that the step count display was not visible and, to reduce deviation
from their usual walking behaviour, participants were informed that the device would
record all forms of physical activity. Previous studies that have investigated walking
using self-report measures have not notified participants in advance that they will be
required to report their behaviour (e.g. Hallal et al, 2005). Had participants in the
present study known that their step count was being monitored, this may have resulted
in an increased awareness of walking behaviour during the monitoring period, thus
contaminating the later self-reports. Participants were asked to wear the pedometer
during all waking hours for one week and to keep a diary detailing the times they
actually wore it each day and any reasons for removal, e.g. swimming or showering.
The purpose of the diary was to act as a memory aid in an effort to minimise the
amount of missing data and to allow adherence to be assessed. Participants who
indicated that they had not worn the pedometer for at least 12 hours each day were
excluded from the analysis. Similarly, any participant who recorded less than 500
steps on one or more days was excluded as this was deemed to be suggestive of
non-adherence.
Pedometers and diaries were returned during the second visit and the data
downloaded. Participants completed the questionnaire, containing TPB construct
measures and both the single item and composite measures of walking, and the
interviews for physical activity (PAR) and active transport. In all cases the
prompted recall of the interview influencing the unprompted recall targeted by the
questionnaire. Participants were then debriefed.
Measures
The New Lifestyles NL-2000 is a small, lightweight pedometer that clips onto
the belt or waistband and records steps taken. It resets at midnight and stores data for
the previous seven days whilst recording the current day. All monitors were subjected
to preliminary calibration to ensure step count accuracy: First, the number of steps
recorded by each pedometer was compared to a manual step count over a distance of
1000m. Pairs of pedometers were then worn simultaneously for a 24-hour period and
their records compared. This was done to ensure accuracy in a free-living situation
and was repeated until each pedometer had been paired with at least two others. Those
producing error rates greater than 1% in either part of the calibration procedure were
excluded from this study, resulting in the removal of 2 out of 50 pedometers tested.
The TPB variables were measured using questionnaire items with seven point
response scales, anchored at each end only with descriptive labels. These
questionnaire items were developed for a previous exercise behaviour study that
included walking and was conducted using a sample drawn from the same population
as the present study (Eves et al, 2003). They show high internal consistency in both
the original and present study.
As walking can be composed of multiple short episodes (USDHHS & CDC,
1996), the phrase walking regularly was used and was defined as “walking for any
reason for at least 30 minutes a day in total (i.e. time spent on each bout added
chosen to accord with the current physical activity recommendations (Pate et al.,
1995).
Intention was measured using two items: “I plan to walk regularly during the
next week” and “I intend to walk regularly during the next week”, each anchored with
definitely do and definitely do not (Cronbach‟s alpha = 0.97). Affective and
instrumental attitudes were assessed separately, both using the stem: “Walking
regularly during the next week would be…”. The semantic differentials used to
measure affective attitude (Cronbach‟s alpha = 0.88) were interesting - boring,
enjoyable - unenjoyable and pleasant - unpleasant and those measuring instrumental
attitudes (Cronbach‟s alpha = 0.87) were beneficial - harmful, healthy - unhealthy and
wise - foolish. A single item, scaled from strongly agree to strongly disagree, measured subjective norm: “Most people who are important to me would approve of
me walking regularly during the next week”.Two items, each anchored with strongly
agree and strongly disagree, measured PBC: “I am confident that I could walk regularly during the next week if I wanted to” and “I am sure I can walk regularly
during the next week” (Cronbach‟s alpha = 0.85). For each construct the mean score
across items was calculated for analysis.
Similar to these measures of the TPB constructs was the single item measure
of walking, which asked „How often you have been walking regularly in the last
week‟ on a 9-point scale ranging from „not at all‟ (scored as 0) to „more than once a
day‟ (scored as 8), as shown in Box 1. The response indicated was taken to be the
frequency of walking for at least 30 minutes per day (as earlier defined) over the
previous week. Thus, the frequency score was multiplied by the minimum time of 30
minutes to produce an estimation of the total number of minutes spent walking in the
The composite measure constituted two questions to cover recreational and
non-recreational participation. Participants indicated (a) the number of times they had
walked for recreation during the last seven days and the average duration of the
episodes; (b) the time spent walking ‘each day in the last 7 days, other than for
recreation. For example, going to work, to the shops, to the pub, to visit friends.’ on a
scale with 10 minute increments from ‘none’ to ‘over 180 minutes’ (See box 1). For
the composite measure, the total number of minutes recreational walking reported
(frequency multiplied by average duration) was added to seven times the average
daily duration of non-recreational walking.
Insert Box 1 about here
The interview consisted of two parts: a 7-day PAR (Sallis et al., 1985) and an
adapted version of the 7-day recall that focussed on active transport. During the initial
7-day PAR, participants were asked to recall what they had done, whether they would
categorize it as physical activity and, if so, at what intensity. Definitions of moderate,
hard and very hard physical activity were provided. All walking reported, irrespective
of intensity, was extracted for each day.
The second part of the interview addressed active transport, focusing on
walking. Working back in a similar style to the 7-day PAR, participants recalled
where they had been and their method of transport. Participants who reported walking
for all or part of a journey were then asked to estimate the time spent walking on that
occasion. Again the amount of walking was extracted directly from the interview
Analysis
Pearson Product Moment Correlation Coefficients were calculated for each
measure of walking to estimate the degree of association between them. A series of
hierarchical linear regression analyses were carried out with intention to walk as the
dependent variable. The TPB constructs of affective and instrumental attitudes,
subjective norm and PBC were entered at the first step. Previous research has
suggested that past behaviour can influence future behaviour indirectly through
intentions to perform the behaviour (Hagger et al., 2002), thus making it a potential
predictor of intentions. Past behaviour was therefore entered into the regression
analyses on the second step, with separate analyses being carried out for each measure
of walking behaviour obtained.
RESULTS:
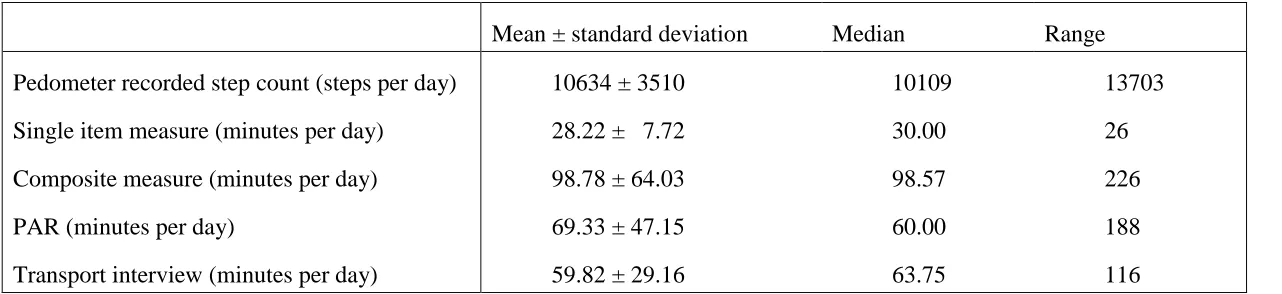
All participants in this sample provided complete data. The pedometers
recorded a daily average of 10634 ± 3510 steps per participant. Table 1 contains the
descriptive statistics for each measure. The pedometer data and the self-reports of
walking generated by both the composite questionnaire measure and the transport
interview were normally distributed. The single item measure of walking was
negatively skewed, in contrast to the data from the PAR interview, which was
positively skewed. Although the amount of walking reported during both interviews
was comparable, the questionnaire measures produced notably higher (composite) and
lower (single item) mean values relative to those obtained from the interviews.
The correlation matrix for the five measures of walking used in this study is
presented in table 2. Spearman‟s Rank Correlation Coefficients were also calculated,
measures demonstrated large, significant correlations with both the objective
pedometer measure of walking and with each other. Both questionnaire measures,
however, yielded non-significant correlations with the objective measure, interview
measures and each other. The correlations of the interview measures with the
pedometer counts were greater than the equivalent correlations for the questionnaire
measures (all t38 > 2.08, p <.05).
Insert Tables 1 & 2 about here
The TPB constructs (affective and instrumental attitudes, subjective norm,
PBC) explained 21.7% of the variance in reported intentions to walk during the
coming week, with PBC the only unique predictor (ß = .44, p = .04). Addition of the
single item measure of past behaviour in step 2 significantly improved the model,
explaining 50.0% variance in walking intentions, with past behaviour the only
significant contributor (ß = .21, p < .001). Replacing the single item measure of past
behaviour with each of the other four measures in each case reduced the adjusted
amount of variance explained to less than the 21.7% achieved in step 1 by the original
TPB constructs (Composite measure: adjusted R² = .203; PAR: adjusted R² = .193;
Transport interview: adjusted R² = .196; Step count: adjusted R² = .193). In all of
these cases, PBC remained the only significant contributor (all β = .45, all p < .05).
DISCUSSION:
In summary, this study suggests that structured interviews can provide a
self-report measure of walking behaviour that is associated with an objective measure,
the single item measure suggests a ceiling effect, possibly due to the method by which
the time spent walking was calculated. All responses of „more than once a day‟ were
scored as a frequency value of eight before being multiplied by the minimum required
time of 30 minutes. There are two ways in which this could have created a ceiling
effect on the data: participants may have walked for 30 minutes more than eight times,
alternatively participants may have walked for more that 30 minutes on each occasion.
The questionnaire does not give participants the opportunity to express either of these
situations.
The pattern of contribution from PBC but not affective attitude, and amount of
variance explained are similar to a previous application of the TPB to walking that
explained 17.5% of intentions (Eves et al, 2003). In addition, the data suggest that a
single item measure of past behaviour made an appreciable contribution to intentions
whereas the more detailed information available from the structured interview
accounted for no additional variance in the model. Given the small sample, these
results must be considered provisional.
STUDY 2:
The first study explored the use of different methods of measuring walking
behaviour within a small sample of students. The second extended this by
investigating the performance of the self-report measures relative to the objective
measure within a much larger, non-university population. For self-report of walking,
the single item measure and the PAR interview were retained, with additional
transport questions added at the end of questioning about each day‟s behaviour. It was
closely related to the pedometer determined step count than the single item
questionnaire measure.
Also, examination of the predictive utility of the TPB in the first study was
limited to predictions of intention as behaviour was not measured after completion of
the TPB questionnaire. To investigate whether the TPB can effectively predict
walking behaviour, the duration of the study was extended to two weeks. This allowed
measures of both past and future behaviour relative to the administration of the
questionnaire assessing TPB constructs to be obtained. The participants in this study
were RAF trainee aircraftsmen. During the first week of they were living off-base, i.e.
in a free-living situation, whereas the second week of monitoring was performed
when they returned to base. Thus, assessment was performed in two different
contexts. It was hypothesised that the TPB constructs would predict walking
behaviour in line with previous research on physical activity (Hagger et al., 2002)
METHODS:
Participants:
Two hundred Royal Air Force trainee aircraftsmen (77.0% male, age 20.1 ±
3.72 years) were recruited from two bases in the United Kingdom. Participants
received an information sheet and brief presentation about the study, which included
making them aware that they could withdraw at any time, before completing a consent
form. The University of Birmingham Safety and Ethics Committee approved this
study.
During the initial visit participants provided basic demographic information
before being issued with a New Lifestyles NL-2000 pedometer and instructed in its
correct usage. Similar to the first study participants were lead to believe that they were
wearing a monitor designed to measure all forms of physical activity and were
instructed not to wear the monitor when swimming, showering or performing in other
„wet‟ activities and to remove the monitor before playing contact sport. Participants
were provided with a diary and asked to note the times at which they wore the
pedometer and reasons for removal (e.g. showering, going to bed).
One week later, 180 participants (77.5% male, age 20.2 ± 3.95 years) returned
to complete a questionnaire, containing measures of the TPB constructs and measures
of walking during the previous week, plus the PAR interview. One hundred and
thirty-nine participants (76.5% male, age 20.4 ± 4.34 years) returned a further seven
days later to complete the second questionnaire and interview measures of behaviour.
Comparison of the sample that completed all measures (69.5% recruited participants)
with those who only completed week one (90.0% recruited participants) revealed no
differences between samples on any measure (all p > .22). Again the questionnaire
was completed before the interview in all cases.
Measures
This study employed the same TPB construct measures and single item
measure of walking used in the first study, with one minor alteration. The figure of 30
minutes walking per day was replaced by 90 minutes. This value was generated from
pilot work using pedometers to measure walking in RAF aircraftsmen that estimated
the average daily amount of walking to be 95.4 ± 21.8 minutes. All TPB measures
The interview protocol was also slightly modified. Rather than completing two
interviews that elicited largely overlapping reports of walking, participants completed
one standard PAR interview with additional active transport questions. After recalling
their physical activity for each day participants were asked whether they remembered
using any form of active transport, such as walking or cycling, which they had not
already reported. If a positive response was received then the interviewer asked where
they had been, what form of transport had been used and how long the journey had
taken. The walking reported as physical activity and as transport was then summed to
give a total for each day.
RESULTS:
Different measures of behaviour
For the comparison of self-report measures of walking with the pedometer
counts only those participants with complete pedometer records, as defined in study 1,
were included in the analysis. This resulted in the exclusion of thirty-seven
participants (20.6%) from the first week and sixteen (11.5%) from the second week.
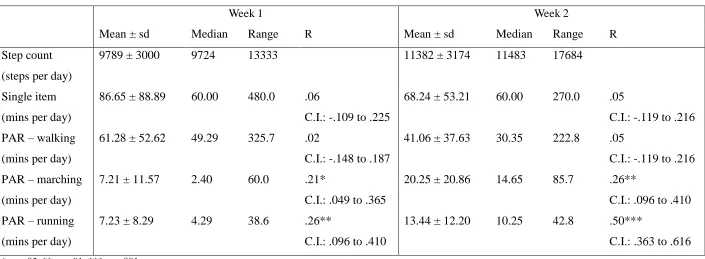
During the first week of the study the pedometers recorded a participant
average of 67580 ± 21100 steps, which increased significantly to 78362 ± 24533 steps
in the second week (t135 = 4.97, p < .001). The descriptive statistics for the various
measures of walking are shown in Table 3. It was noted during the course of the PAR
interviews that many participants in this population reported both walking and
marching. Both of these methods of transport contribute to step count and they are
presented as separate elements in the following analysis. Further, running can also
contribute to step count and reports of running were extracted from the PAR interview
Insert Table 3 about here
The pedometer recorded step counts were normally distributed for weeks 1
and 2 of the study, whereas the single item measure was negatively skewed for both
weeks. The walking component of the PAR measure was normally distributed in both
weeks whereas the marching and running components were positively skewed for the
first week and more evenly distributed in the second.
Both the single item and PAR measures of behaviour demonstrated much
weaker relationships with step counts than in the previous study. As Table 3 shows,
there was no association between step counts and self-reports of walking obtained
using either the single item measure or the PAR interview in either the first or second
week of this study. In contrast, during both weeks the PAR measures of marching and
running demonstrated significant associations with step count. As both marching and
running contributed to step counts, residualised scores were computed to remove the
contribution of marching and running. In subsequent analyses of pedometer counts,
both the raw step counts and residualised scores were tested.
Predicting intentions to walk and walking behaviour using TPB Variables
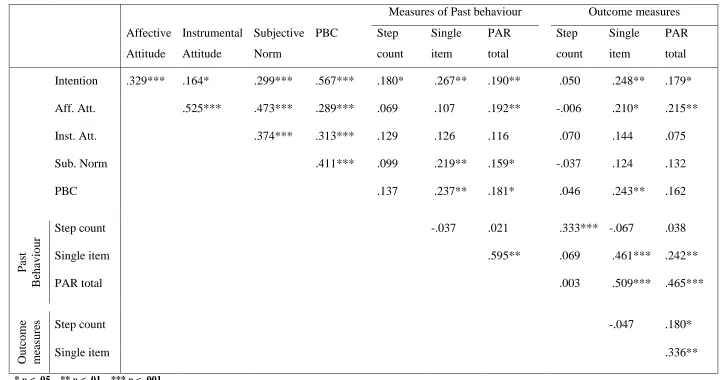
The relationships between the predictor and outcome variables are shown in
table 4. A strong association was present between all TPB constructs. Intention
correlated well with all three measures of past behaviour. While the two self-report
outcome measures also showed some correlation with the underlying TPB constructs,
step count is not related to any of the TPB constructs either as a raw score (shown) or
highly correlated when measured using the same instrument. Interestingly, there was
also a correlation between the single item and PAR measures of walking at each time
points.
Insert table 4 about here
A hierarchical linear regression analysis investigated the contribution of the
TPB variables (affective and instrumental attitudes, subjective norm, PBC) and past
(i.e. week one) behaviour to intentions to walk (in week two). TPB variables were
entered in step one and past behaviour in step two. The analysis was repeated using
each measure of past behaviour (single item, PAR, step count) in the second step (see
table 5). Note that due to the reduced sample with complete pedometer data separate
analyses were run. The initial model explained 45.3% variance in intentions with
unique contributions from subjective norm and PBC. Adding the single item measure
of past behaviour to the model significantly improved predictions of intention, with
past behaviour becoming an additional unique predictor. There were, however, no
significant changes in the model with the inclusion of either PAR reported walking or
the objective measure of step count. There were no differences between analyses that
employed the raw data or the residualised step counts that removed the influence of
marching and running. Although PBC makes the greatest contribution in all models,
it is interesting to note that subjective norm demonstrates a consistent, unique
negative contribution.
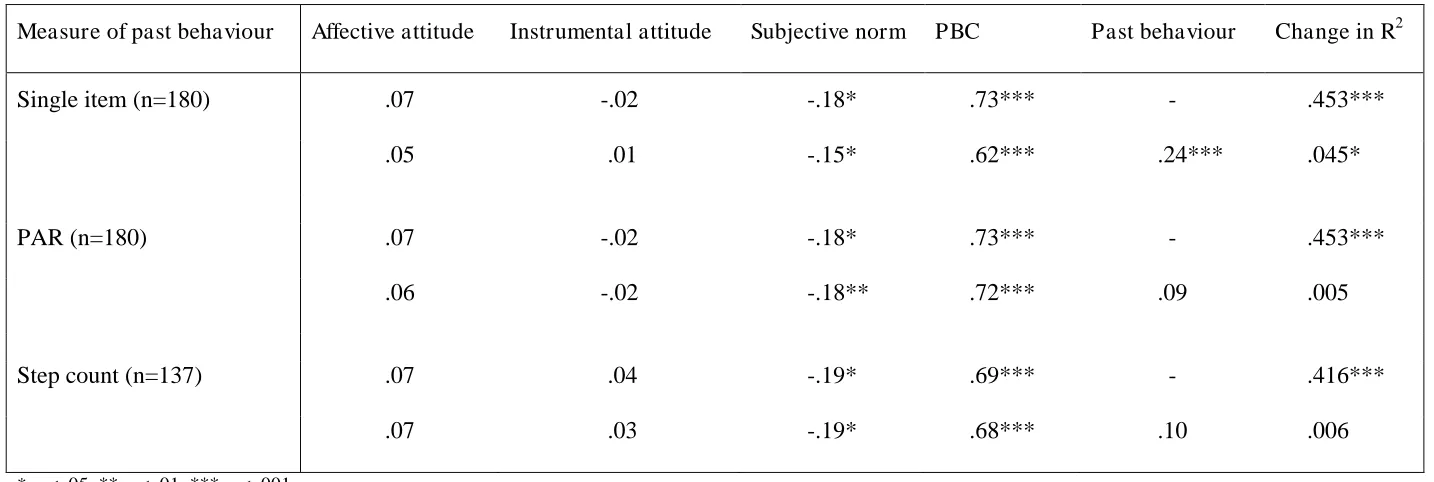
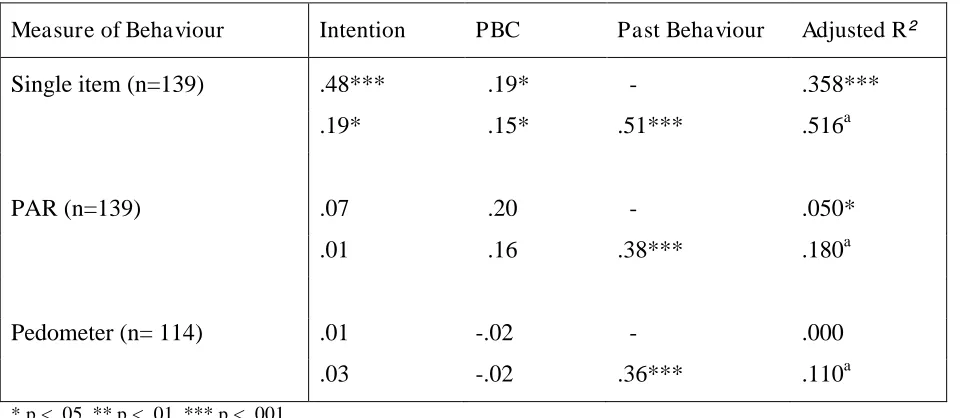
Following the prediction of intention to walk, further hierarchical regression
analyses explored the role of TPB predictors of behaviour (intention, PBC) and
different measures of past behaviour in predicting future behaviour. Table 6
summarises these results. In the models of behaviour using only traditional TPB
predictors, intention and PBC were significant predictors of only the single item
measure of walking, offering no unique contribution towards explaining either PAR
reported or pedometer recorded walking. In all cases, adding past behaviour to the
models resulted in a significant increase in the amount of behavioural variance
explained. The single item measure of walking was the one best explained by both the
traditional TPB constructs and by the TPB constructs plus past behaviour. Indeed, the
amount of explained variance of the single item measure contrasted with moderate
amounts of variance explained for the other measures of behaviour. As before, there
were no differences between models using the raw pedometer counts or the
residualised scores.
DISCUSSION:
The self-report measures of walking ranged widely in the degree to which they
shared variance with objectively measured walking behaviour, as assessed by
pedometer. While the interview measures correlated reasonably well with step counts
within the university population, neither of the questionnaire measures were
associated with the objective measure. For the RAF population, however, neither the
questionnaire nor the interview measure was associated with step counts. The data
from these studies confirm previous findings that recall of walking is poor
(Ainsworth, Leon, Richardson, Jacobs & Paffenbarger, 1993; Richardson, Leon,
self-report remains elusive (Bassett et al., 2000; Eves et al., 2003; Tudor-Locke &
Myers, 2001).
The lack of observed relationship between self-reported and objective
measures suggests that participants are largely unaware of their walking behaviour
and thus, are unable to accurately report it. This may be due to the incidental nature of
a large portion of the walking undertaken, a factor apparent in interview responses. In
study one, the PAR interview correlated better with step count than the
questionnaire-based TPB measure, suggesting that more detailed prompting can elicit better recall.
This is in line with previous research suggesting that stronger motivation to accurately
recall walking, in our case the presence of the interviewer, may generate more
accurate responses (Johnson-Kozlow & Matt, 2004). Nonetheless, the substantial
relationship between the interview and pedometer counts in the university sample was
not replicated in the larger RAF sample. As the latter may engage in more
work-related activity, it is possible that walking becomes a less salient activity in keeping
with its primary purpose of transport. Set against this, walking was measured both in a
free-living context and when constrained by activity on the base; neither context
revealed any relationship between self-reported walking and the objective measure.
RAF trainee aircraftsmen reported regular bouts of marching and running as
well as walking in the interview, with these activities contributing to the recorded step
count. Despite these additional contributors, residualised scores that removed the
influence of marching and running revealed the same lack of relationship between the
objective measure and self-reports of walking. Indeed, PAR reported marching and
running were better correlated with step count than walking. There are three possible
reasons for this: firstly, marching and running are of a higher intensity than walking,
thereby facilitating more accurate self-report. Secondly, participants could more easily
calculate how much marching they have done. Whilst on duty, trainee aircraftsmen
are required to march when moving around the air base. Therefore by recalling the
major time-consuming tasks that they were assigned to, they could work out where
they had been and approximately how long it would take them to travel between these
locations. This is an easier task than trying to recall which minor errands were run on
any given day or how many times the journey was made between one‟s own room and
a friend‟s room in another barrack block. Finally, marching and running may be easier
to recall due their more structured and purposeful nature; marching is non-volitional
with aircraftsmen instructed to report to a specific location or to attend to a job.
Running is mainly a planned activity requiring some preparation for its completion.
Thus, as the activity is consciously initiated it may leave a stronger memory (Eves et
al., 2003).
The TPB variables explained over 45% of the variance in walking intentions
during the following week. In common with Eves et al (2003), the present study found
no significant contribution of attitude to intention, with PBC being the major
contributor. Part of this may reflect the definition employed in the present study of
regular walking as lifestyle accumulation; it seems likely that intention to walk
specifically for leisure would be influenced by attitude. Nonetheless, the absence of
any effects of attitude underscores the unusual nature of lifestyle walking in contrast
to other forms of physical activity. The strongest predictor of intention is attitude for
both the generic term exercise (Hagger et al., 2002) and for most specific types of
physical activity behaviours (Eves et al., 2003).
Concerning the single item measure of walking, it was notable that substantial
that the better prediction relative to the interview or objective measures reflect the fact
that behaviour and its psychological precursors were measured on similar scales as
required by the TPB. Critically, however, there was little evidence in either study
reported here that the single item measure was associated with the underlying
behaviour. Hence the prediction of behaviour (as assessed using the single item
measure) may be at least partly an artefact of shared method variance (c.f. Sutton,
1998).
When participants are unable to accurately recall a given behaviour they
typically employ availability heuristics to generate an estimate (Aarts & Dijsterhuis,
1999; Johnson-Kozlow et al., 2004). Previously reported intention and PBC may
function as heuristics for the estimate of behaviour here. Our attempt to measure a
behaviour for which there is poor recall, has highlighted one possible pitfall of single
item scales. This finding may have wider implications for researchers using the TPB.
Where accuracy of self-report may be compromised, for example by the passage of
time or the routine nature of the behaviour (Aarts, Paulussen, & Schaalma, 1997), use
of single item scales could inflate the apparent ability to predict that behaviour. This
relates to the observation that the TPB predicts self-reports of behaviour much better
than objectively measured behaviour (Armitage & Conner, 2001).
The present findings may also have implications for research investigating
physical activity using the TPB, which typically employ the generic term exercise;
investigations of the TPB contribution for individual types of exercise are rare (Ajzen
& Driver, 1992; Bryan & Rochleleau, 2002; Eves et al., 2003). For the generic term,
participants are expected to recall episodes of different types of physical activity to
produce a composite estimate of their exercise behaviour. Further, use of a single item
recommended. To produce a single item measure of generic exercise, participants
must aggregate across separate episodes of different types of behaviour, often without
any prompting cues; this is quite a complex recall task. In contrast, measures of
individual types of exercise can be considered instances of prompted recall of the
behaviour not unlike the prompting that occurs in an interview. In essence the task for
participants is to recognise whether they have performed the behaviour. It is possible
that under the suboptimal conditions of recall of the generic composite, measures of
the underlying behaviour may also be subject to heuristic biases. Put another way, use
of single item measures may have elevated the apparent ability of the TPB to predict
the behaviour.
In contrast to the single item measure, the prediction of walking assessed using
the PAR and the pedometer was poor. This may be because the TPB was designed to
model planned, or goal-directed, behaviour and walking is a largely unplanned
method of transport; the higher order goal of the destination is the planned part of the
behaviour, e.g. going to the shops. More generally, the present results suggest that the
TPB may not be applied as successfully to behaviours which do not constitute goals in
themselves, although further empirical work is needed to test this possibility.
There are two limitations to the present study, one concerning scale
construction and the other concerning contributors to the step counts relevant to the
above discussion. First, the principles of scale correspondence and compatibility were
violated in this study. Whereas behaviour was measured on a continuous scale,
intention and PBC used dichotomous graded scales (Courneya, 1994). This lack of
correspondence between the TPB constructs and the behaviour would have reduced
the relationship between the predictor and outcome variables. Hence part of the failure
correspondence. It should be noted, however, that any attenuation resulting from
imperfect correspondence means that the apparent prediction of the single item
measure represents an underestimation of the effect. Concerning violation of scale
compatibility, the target behaviour for intention was „walking regularly, i.e. for 30
minutes‟ and hence a compatible behavioural measure would have involved a
dichotomous yes/no response to the question „Did you walk regularly?‟ rather than the
continuous measures used. Ideally, the objective measure of step counts would have
been matched with TPB constructs defined in terms of step counts though there would
be obvious problems for participants if asked about their TPB constructs in relation to
the unfamiliar behaviour of step counts. More realistically, minutes of walking rather
than walking regularly could have been used as the target behaviour. Once again,
violation of scale compatibility may have attenuated the relationship between
intention and the measures of behaviour, particularly in the case of step counts. Hence
this study may have underestimated the ability of the TPB to predict walking. Only
further research can clarify the issue.
Turning to contributors to the objective measure, step count would be
influenced by all locomotor behaviour, a point underscored by contributions from
both marching and running to step count in the RAF sample. Nonetheless, when the
contributions of running and marching were removed statistically by using
residualised scores, the results were unaltered. Further, while self-reports of marching
and running correlated with the objective measure, self-reports of walking did not.
These data confirm that self-reports of walking may be problematic.
Durante and Ainsworth (1996) suggest that poor recall of behaviour can be
attributed to four primary cognitive sources: comprehension, retrieval,
cognitive involvement will lead to weak encoding of the activity in memory and
subsequently poor recall (Schacter, 1999). Hence retrieval appears the most likely
cause of the problems with measurement. Walking is unique in that it can be a
planned leisure activity but occurs most often as an incidental lifestyle activity
without active planning. There are brief episodes throughout the day such as fetching
something from another room, travelling to a new location or simply transport
subservient to other lifestyle activities, such as gardening. Recommendations citing
10,000 steps per day as a physical activity target include these forms of walking
within that total (Hatano, 1993) underlining the importance of their inclusion in any
measurement of daily walking. Neither interview nor questionnaire could be expected
to retrieve all of these brief episodes. It is likely, however, that the interviews may
sometimes perform better due to the more detailed introspection they encourage, as
demonstrated in the university population.
A (potential) limitation of the present study is that the pedometers counted
number of steps taken, whereas the questionnaire and interview measures assessed the
amount of time spent walking. It could be argued that walking behaviour and stepping
behaviour are two different activities. Participants, however, only completed one set
of questionnaire items assessing the TPB constructs and these items all referred to
„walking regularly‟, measuring the behaviour in minutes. Thus the TPB constructs
may not have been suitable for modelling step behaviour. Collecting a second set of
construct measures enquiring about the average number of steps participants intended
to take over the coming week and their beliefs about taking a given number of steps
may have addressed this issue and improved the predictive validity of the resulting
model. Most people, however, have very little idea how many steps they take in an
expect to take in the coming week or their beliefs about taking a certain number of
steps per day would be unlikely to generate accurate, considered responses.
Furthermore, assuming that stepping and walking are two different behaviours and
that this is the reason for the poor performance of the TPB for modelling pedometer
determined walking behaviour, does not explain the low predictive utility of the TPB
when applied to the PAR measure of behaviour.
These studies illustrate the current difficulties in measuring, modelling and
explaining walking behaviour and emphasise the need for further research into this
unique physical activity behaviour. New methods of exploring and predicting walking
need to be investigated, particularly considering the current interest in the behaviour.
Walking presents as an ideal activity for public health promotion campaigns. Until the
behaviour is better understood, however, the most efficient way to encourage it will
REFERENCES
Aarts, H. & Dijsterhuis, A. (1999). How often did I do it? Experienced ease of
retrieval and frequency estimates of past behaviour. Acta Psychologica, 103,
77-89.
Aarts, H., Paulussen, T., & Schaalma, H. (1997). Physical exercise habit: On the
conceptualisation and formation of habitual health behaviours. Health
Education Research, 12, 363-374.
Ainsworth, B. E., Leon, A. S., Richardson, M. T., Jacobs, D. R. Jr., & Paffenbarger,
R. S. Jr. (1993). Accuracy of the College Alumnus Physical Activity
Questionnaire. Journal of Clinical Epidemiology, 46, 1403-1411.
Ajzen, I. (1988). Attitudes, Personality and Behaviour. Milton Keynes, UK: Open
University Press
Ajzen, I. (1991). The Theory of Planned Behaviour. Organizational Behavior and
Human Decision Processes, 50, 179-211.
Ajzen, I. & Driver, B. L. (1992). Application of the Theory of Planned Behaviour to
leisure choice. Journal of Leisure Research, 24, 207-224.
Ajzen, I. & Fishbein, M. (1977). Attitude - behaviour relations: A theoretical analysis
and review of empirical research. Psychological Bulletin, 84, 888-918.
American College of Sports Medicine (2000). ACSM’s Guidelines for Exercise
Testing and Prescription (6th Ed.). Baltimore, MD.: Lippincott, Williams &
Armitage, C. J. & Conner, M. (2001). Efficiacy of the Theory of Planned Behaviour.
British Journal of Social Psychology, 40, 471-499.
Bassett, D. R., Ainsworth, B. E., Leggett, S. R., Mathien, C. A., Main, J. A., Hunter,
D. C. et al. (1996). Accuracy of five electronic pedometers for measuring
distance walked. Medicine and Science in Sport and Exercise, 28, 1071-1077.
Bassett, D. R., Cureton, A. L., & Ainsworth, B. E. (2000). Measurement of daily
walking distance - questionnaire versus pedometer. Medicine and Science in
Sport and Exercise, 32, 1018-1023.
Blair, S. N. (1985). How to assess exercise habits and physical fitness. In
J.D.Matarazzo, J. A. Heard, N. E. Miller, & S. M. Weiss (Eds.), Behavioral
Health: A Handbook of Health Enhancement and Disease Prevention. (pp.
424-447). New York: Wiley.
British Heart Foundation. (2003). Coronary Heart Disease Statistics. London, UK:
British Heart Foundation.
Bryan, A. D. & Rocheleau, C. A. (2002). Predicting aerobic versus resistance exercise
using the Theory of Planned Behaviour. American Journal of Health
Behaviour, 26, 83-94.
Courneya, K. S. (1994). Predicting repeated behaviour from intention: The issue of
scale correspondence. Journal of Applied Social Psychology, 24, 580-594.
Crouter, S. E., Schneider, P. L., Karabulut, M., & Bassett, D. R. (2003). Validity of 10
electronic pedometers for measuring steps, distance and energy costs.
Cyarto, E. V., Myers, A. M., & Tudor-Locke, C. (2004). Pedometer accuracy in
nursing home and community-dwelling older adults. Medicine and Science in
Sport and Exercise, 36, 205-209.
Department of Health (2004). At least five a week: Evidence on the impact of physical
activity and its relationship to health. London, UK: Department of Health
Durante, R. & Ainsworth, B. E. (1996). The recall of physical activity: using a
cognitive model of the question-answering process. Medicine and Science in
Sport and Exercise, 28, 1282-1291.
Eves, F. F., Hoppé, R., & McLaren, L. (2003). Prediction of specific types of physical
activity using the Theory of Planned Behaviour. Journal of Applied
Biobehavioural Research, 8, 77-95.
Eyler, A. A., Brownson, R. C., Bacak, S. J., & Houseman, R. A. (2003). The
Epidemiology of walking for physical activity in the United States. Medicine
and Science in Sport and Exercise, 35, 1529-1536.
Fishbein, M. & Ajzen, I. (1975). Belief, Attitude, Intention and Behaviour. New York,
NY: Wiley.
Fox, K. & Rickards, L. (2004). Sport and Leisure: Results from the sport and leisure
module of the 2002 General Household Survey. London, UK: The Stationary
Office.
French, D. P., Sutton, S., Hennings, S. J., Mitchell, J., Wareham, N. J., Griffin, W. et
planned behavior: Predicting intentions to increase physical activity. Journal
of Applied Social Psychology, 35, 1824-1848.
Godin, G. (1987). Importance of the emotional aspect of attitude to predict intention.
Psychological Reports, 61, 719-723.
Hagger, M. S., Chatzisarantis, N. L. D., & Biddle, S. J. H. (2002). A meta-analysis
review of the Theories of Reasoned Action and Planned Behaviour in physical
activity: Predictive validity and the contribution of additional variables.
Journal of Sport and Exercise Psychology, 24, 3-23.
Hallal, P. C., Azevedo, M. R., Reichert, F. F., Siqueira, F. V., Araújo, C. L. P., &
Victora, C. G. (2005). Who, when and how much? Epidemiology of walking
in a middle-income country. American Journal of Preventive Medicine, 28,
156-161.
Hatano, Y. (1993). Use of the pedometer for promoting daily walking exercise.
Journal of the International Council for Health, Physical Education and
Recreation, 29, 4-8.
Johnson-Kozlow, M. & Matt, G. E. (2004). What respondents recall about walking
and what self-report items elicit about walking. Preventive Medicine, 38,
227-236.
Johnston, M., French, D. P., Bonetti, D., & Johnston, D. W. (2004). Assessment and
measurement in health psychology. In S.Sutton, A. Baum, & M. Johnston
(Eds.), The Sage Handbook of Health Psychology (pp. 288-323). London:
Montoye, H. J., Kemper, H. G. C., Saris, W. H. M., & Washburn, R. (1996).
Measuring Physical Activity and Energy Expenditure. Champaign, IL: Human
Kinetics.
Murtagh, E. M., Boreham, C. A. G., & Murphy, M. H. (2002). Speed and exercise
intensity of recreational walkers. Preventive Medicine, 35, 397-400.
Pate, R. R., Pratt, M., Blair, S. N., Haskell, W. M., Macera, C. A., Bouchard, C. et al.
(1995). Physical Activity and Public Health: A recommendation from the
Centers for Disease Control and Prevention and the American College of
Sports Medicine. JAMA, 273, 402-407.
Pollock, M.L., Gaesser, G.A., Butcher, J.D., Després, J-P., Dishman, R.K., Franklin,
B.A. & Garber, C.E. (1998). The recommended quantity and quality of
exercise for developing and maintaining cardiorespiratory and muscular
fitness and flexibility in healthy adults. Medicine and Science in Sports and
Exercise, 30, 975-991.
Richardson, M. T., Ainsworth, B. E., Jacobs, D. R. Jr., & Leon, A. S. (2001).
Validation of the Stanford 7-Day Recall to assess habitual physical activity.
Annals of Epidemiology, 11, 145-153.
Richardson, M. T., Leon, A. S., Jacobs, D. R. Jr., Ainsworth, B. E., & Serfass, R.
(1994). Comprehensive evaluation of the Minnesota Leisure Time Physical
Activity Questionnaire. Journal of Clinical Epidemiology, 47, 271-281.
Sallis, J. F., Haskell, W. M., Wood, P. D., Fortmann, S. P., Rogers, T., Blair, S. N. et
Sallis, J. F. & Saelens, B. E. (2000). Assessment of physical activity by self-report:
Status, limitations and future directions. Research Quarterly for Exercise and
Sport, 71, 1-14.
Schacter, D. L. (1999). The seven sins of memory - Insights from psychology and
cognitive neuroscience. American Psychologist, 54, 182-203.
Schneider, P. L., Crouter, S. E., & Bassett, D. R. (2004). Pedometer measures of
free-living physical activity: Comparison of 13 models. Medicine and Science in
Sport and Exercise, 36, 331-335.
Simpson, M. E., Serdula, M., Galuska, D. A., Gillespie, C., Donehoo, R., Macera, C.
A. et al. (2003). Walking trends among U.S. adults. American Journal of
Preventive Medicine, 25, 95-100.
Stanish, H. I. (2004). Accuracy of pedometers and walking activity in adults with
mental retardation. Adapted Physical Activity Quarterly, 21, 167-179.
Sutton, S. (1998). Predicting and explaining intentions and behaviour: How well are
we doing? Journal of Applied Social Psychology, 28, 1317-1338.
Symons Downs, D. S. & Hausenblas, H. A. (2005). The Theories of Reasoned Action
and Planned Behaviour applied to exercise: A meta-analytic update. Journal of
Physical Activity and Health, 2, 76-97.
Trafimow, D. & Sheeran, P. (1998). Some tests of the distinction between cognitive
and affective beliefs. Journal of Experimental Social Psychology, 34, 378-397.
Tudor-Locke, C. & Myers, A. M. (2001). Challenges and opportunities for measuring
U.S. Dept of Health & Human Services & Centers for Disease Control & Prevention
(1996). Physical Activity and Health: A Report of the Surgeon General
Atlanta, GA: Centers for Disease Control and Prevention.
Wilde, B. E., Corbin, C. B., & Le Masurier, G. C. (2004). Free-living pedometer step
counts of high school students. Pediatric Exercise Science, 16, 44-53.
Wimbush, E., MacGregor, A., & Fraser, E. (1998). Impacts of a national mass media
BOX 1: Questionnaire items measuring walking during the previous week
Single item measure:
Please indicate how often you have been walking regularly in the last week?
Not one two three four five six once more than At all time times times times times times a day once a day
On average, how long did you walk for each time? ………..
Composite measure:
Please indicate how many times you have been walking for recreation during the last
7 days ………..
On average, for how long did you walk each time? ………..
Please circle the number of minutes you have spent walking each day in the last 7 days, other than for recreation? For example, going to work, to the shops, to the pub, to visit friends.
None
About 10 about 20 about 30 about 40 about 50 about 60 minutes minutes minutes minutes minutes minutes
About 70 about 80 about 90 about 100 about 110 about 120 minutes minutes minutes minutes minutes minutes
Table 1: Descriptive statistics for the five measures of walking obtained in Study 1
Mean ± standard deviation Median Range
Pedometer recorded step count (steps per day) 10634 ± 3510 10109 13703 Single item measure (minutes per day) 28.22 ± 7.72 30.00 26
Composite measure (minutes per day) 98.78 ± 64.03 98.57 226
PAR (minutes per day) 69.33 ± 47.15 60.00 188
Transport interview (minutes per day) 59.82 ± 29.16 63.75 116
Table 2: Correlation matrix of the measures of walking obtained in Study 1
Pedometer recorded step count Single item Composite PAR Single item measure r = .217, p = .173
C.I.: -.097 to .492 Composite measure r = .149, p = .351
C.I.: -.166 to .437
r = .301, p = .056 C.I.: -.007 to .557 PAR r = .573, p < .001
C.I.: .322 to .749
r = .240, p = .131 C.I.: -.073 to .510
r = .285, p = .071 C.I.: -.025 to .545 Transport interview r = .564, p < .001
C.I.: .310 to .748
r = .273, p = .084 C.I.:-.038 to .536
r = .159, p = .319 C.I.: -.156 to .445
[image:38.842.80.772.327.502.2]Table 3: Descriptive statistics for the measures of walking, marching and running used in Study 2 and the correlation between the
self-report measures and the pedometer count for each week
Week 1 Week 2
Mean ± sd Median Range R Mean ± sd Median Range R
Step count (steps per day)
9789 ± 3000 9724 13333 11382 ± 3174 11483 17684
Single item (mins per day)
86.65 ± 88.89 60.00 480.0 .06
C.I.: -.109 to .225
68.24 ± 53.21 60.00 270.0 .05
C.I.: -.119 to .216 PAR – walking
(mins per day)
61.28 ± 52.62 49.29 325.7 .02
C.I.: -.148 to .187
41.06 ± 37.63 30.35 222.8 .05
C.I.: -.119 to .216 PAR – marching
(mins per day)
7.21 ± 11.57 2.40 60.0 .21*
C.I.: .049 to .365
20.25 ± 20.86 14.65 85.7 .26**
C.I.: .096 to .410 PAR – running
(mins per day)
7.23 ± 8.29 4.29 38.6 .26**
C.I.: .096 to .410
13.44 ± 12.20 10.25 42.8 .50***
C.I.: .363 to .616
Table 4: Pearson correlation coefficients for the TPB constructs and measures of behaviour used in Study 2
Measures of Past behaviour Outcome measures Affective Attitude Instrumental Attitude Subjective Norm
PBC Step count Single item PAR total Step count Single item PAR total
Intention .329*** .164* .299*** .567*** .180* .267** .190** .050 .248** .179*
Aff. Att. .525*** .473*** .289*** .069 .107 .192** -.006 .210* .215**
Inst. Att. .374*** .313*** .129 .126 .116 .070 .144 .075
Sub. Norm .411*** .099 .219** .159* -.037 .124 .132
PBC .137 .237** .181* .046 .243** .162
P
ast
B
eha
viour
Step count -.037 .021 .333*** -.067 .038
Single item .595** .069 .461*** .242**
PAR total .003 .509*** .465***
Outc
om
e
mea
sure
s Step count -.047 .180*
Single item .336**
Table 5: Prediction of intentions to walk from TPB variables and the different measures of past behaviour
Measure of past behaviour Affective attitude Instrumental attitude Subjective norm PBC Past behaviour Change in R2
Single item (n=180) .07 -.02 -.18* .73*** - .453***
.05 .01 -.15* .62*** .24*** .045*
PAR (n=180) .07 -.02 -.18* .73*** - .453***
.06 -.02 -.18** .72*** .09 .005
Step count (n=137) .07 .04 -.19* .69*** - .416***
.07 .03 -.19* .68*** .10 .006
Table 6: Summary of regression analyses showing prediction of week two walking behaviour from TPB variables and past (i.e. week
one) behaviour
Measure of Behaviour Intention PBC Past Behaviour Adjusted R²
Single item (n=139) .48*** .19* - .358***
.19* .15* .51*** .516a
PAR (n=139) .07 .20 - .050*
.01 .16 .38*** .180a
Pedometer (n= 114) .01 -.02 - .000
.03 -.02 .36*** .110a
* p < .05, ** p < .01, *** p < .001
a
[image:42.842.67.548.172.381.2]