cuvier
) in Hawaii
Carl G. Meyer1*, Joseph M. O’Malley2, Yannis P. Papastamatiou3,4, Jonathan J. Dale5, Melanie R. Hutchinson1, James M. Anderson1, Mark A. Royer1, Kim N. Holland1
1Hawaii Institute of Marine Biology, University of Hawaii at Manoa, Honolulu, Hawai’i, United States of America,2National Marine Fisheries Service, Pacific Islands Fisheries Science Center, Honolulu, Hawai’i, United States of America,3Florida Museum of Natural History, University of Florida, Gainesville, Florida, United States of America,4School of Biology, Scottish Oceans Institute, University of St Andrews, St Andrews, Scotland, United Kingdom,5Hopkins Marine Station, Stanford University, Pacific Grove, California, United States of America
Abstract
Tiger sharks (Galecerdo cuvier) are apex predators characterized by their broad diet, large size and rapid growth. Tiger shark maximum size is typically between 380 & 450 cm Total Length (TL), with a few individuals reaching 550 cm TL, but the maximum size of tiger sharks in Hawaii waters remains uncertain. A previous study suggested tiger sharks grow rather slowly in Hawaii compared to other regions, but this may have been an artifact of the method used to estimate growth (unvalidated vertebral ring counts) compounded by small sample size and narrow size range. Since 1993, the University of Hawaii has conducted a research program aimed at elucidating tiger shark biology, and to date 420 tiger sharks have been tagged and 50 recaptured. All recaptures were from Hawaii except a single shark recaptured off Isla Jacques Cousteau (24u139170N 109u529140W), in the southern Gulf of California (minimum distance between tag and recapture sites = approximately 5,000 km), after 366 days at liberty (DAL). We used these empirical mark-recapture data to estimate growth rates and maximum size for tiger sharks in Hawaii. We found that tiger sharks in Hawaii grow twice as fast as previously thought, on average reaching 340 cm TL by age 5, and attaining a maximum size of 403 cm TL. Our model indicates the fastest growing individuals attain 400 cm TL by age 5, and the largest reach a maximum size of 444 cm TL. The largest shark
captured during our study was 464 cm TL but individuals.450 cm TL were extremely rare (0.005% of sharks captured). We
conclude that tiger shark growth rates and maximum sizes in Hawaii are generally consistent with those in other regions, and hypothesize that a broad diet may help them to achieve this rapid growth by maximizing prey consumption rates.
Citation:Meyer CG, O’Malley JM, Papastamatiou YP, Dale JJ, Hutchinson MR, et al. (2014) Growth and Maximum Size of Tiger Sharks (Galeocerdo cuvier) in
Hawaii. PLoS ONE 9(1): e84799. doi:10.1371/journal.pone.0084799
Editor:William Hughes, University of Sussex, United Kingdom
ReceivedSeptember 11, 2013;AcceptedNovember 26, 2013;PublishedJanuary 8, 2014
This is an open-access article, free of all copyright, and may be freely reproduced, distributed, transmitted, modified, built upon, or otherwise used by anyone for any lawful purpose. The work is made available under the Creative Commons CC0 public domain dedication.
Funding:The authors are grateful to National Oceanic and Atmospheric Administration (National Marine Sanctuaries Program), University of Hawaii Sea Grant
and the State of Hawaii (Department of Land and Natural Resources) for providing funding to support a variety of shark research projects that collectively made this study possible. The funders had no role in study design, data collection and analysis, decision to publish, or preparation of the manuscript.
Competing Interests:The authors have declared that no competing interests exist.
* E-mail: [email protected]
Introduction
Tiger sharks (Galeocerdo cuvier) are wide-ranging [1–4] apex predators that consume a diverse array of vertebrate and invertebrate prey [5],[6], while utilizing a broad variety of coastal and oceanic habitats [1–4]. They reproduce on a triennial cycle with average litter sizes of 30 to 50 pups ranging in size from 80 to 90 cm Total Length (TL) at birth [7]. Tiger sharks grow to a large size, with 13 studies published between 1975 and 2012 reporting maximum TL ranging from 381 to 550 cm (Table 1), however, an earlier, unconfirmed report suggested that female tiger sharks can reach 740 cm TL [8]. Previous studies indicate they grow relatively fast (K= 0.11– 0.46 year21; [9–12]) compared to some other carcharhinid sharks (e.g.K= 0.10 – 0.12 year21for Hawaii sandbar sharks, Carcharhinus plumbeus; [14]). There is, however, considerable regional variation in reported tiger shark growth rates. For example, juvenile tiger sharks grow almost twice as fast in the Gulf of Mexico as in the Northwest Atlantic [9]. Some of this variation may stem from the different methods used to estimate growth (e.g. vertebral ring counts versus mark-recapture experiments) [15], compounded by small sample sizes and lack of
validation in some studies [16]. The only study specifically examining tiger shark growth in Hawaii, suggests that growth is relatively slow (K= 0.16 year21, [16]) compared to several other regions (e.g.K= 0.2 year21in South Africa, [11];K= 0.27–0.46 in NW Atlantic, [13]). However, the veracity of the existing Hawaii growth estimates are questionable given the lack of validation of vertebral annual ring formation [17], overall small sample size (N = 28), and limited data for small and large size classes.
Hawaii has conducted a research program aimed at elucidating tiger shark biology, and throughout this period tiger sharks have been tagged and periodically recaptured. Here we use these empirical mark-recapture data to estimate growth rates and maximum size for tiger sharks in Hawaii.
Materials and Methods
Ethics Statement
Vertebrate work carried out during this study was approved by the University of Hawaii Institutional Animal Care and Use Committee (protocol #05-053 et seq.). Field studies did not involve endangered or protected species. Sharks were captured in both Hawaii state waters, where no specific permissions were required, and under permit in the Papahanaumokuakea Marine National Monument (U.S. Fish and Wildlife Special Use Permit #12521-06048, State of Hawaii Department of Land and Natural Resources permits # DLNR.NWHI06R019, NOAA-NWHIMNM- permit #2006-012, and Papahanaumokuakea Marine National Monument permits # PMNM-2007-031, #PMNM-2008-027 and#PMNM-2009-037).
Capture and tagging
From September 1993 to January 2013, we captured tiger sharks at various locations throughout the Hawaiian Archipelago. Sharks were captured using demersal long-lines baited with large
[image:2.612.64.555.78.417.2]tuna heads and fish scraps, and soaked for 2–12 h in depths of 10 to 100 m [21]. Captured sharks were brought alongside a 6 m skiff, where they were tail-roped and inverted to initiate tonic immobility. Three length measurements were recorded from each shark; Pre-caudal Length (PCL- tip of the snout to the pre-caudal pit), Fork Length (FL- tip of the snout to the caudal fork), and Total Length (TL- tip of the snout to a point on the horizontal axis intersecting a perpendicular line extending down from the tip of the upper caudal lobe) (for illustrated details of shark measurement protocols see [22]). Sex was determined by the presence, size and degree of calcification of claspers. Sharks were tagged using either NMFS ‘M’ capsule or HallprintTM‘spaghetti’ shark tags inserted into the dorsal musculature at the base of the first dorsal fin. The NMFS ‘M’ tags consist of a stainless steel dart head, connected via monofilament line to a Plexiglas capsule containing waterproof paper printed with the tag number and return instructions (see also [20]). The HallprintTM‘spaghetti’ shark tags (Hallprint Pty. Ltd., Victor Harbor, South Australia) were of the ’wire through’ variety (plastic sheath surrounding a stainless steel wire core connected to the stainless steel dart head) with contact details and a unique ID number printed along the plastic sheath. We switched from NMFS capsule tags to Hallprint tags because several capsule-tagged sharks were recaptured with the plastic data capsules missing.
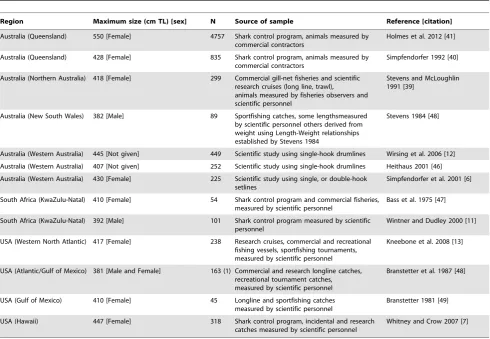
Table 1.Empirically measured tiger shark maximum sizes from peer-reviewed literature.
Region Maximum size (cm TL) [sex] N Source of sample Reference [citation]
Australia (Queensland) 550 [Female] 4757 Shark control program, animals measured by commercial contractors
Holmes et al. 2012 [41]
Australia (Queensland) 428 [Female] 835 Shark control program, animals measured by commercial contractors
Simpfendorfer 1992 [40]
Australia (Northern Australia) 418 [Female] 299 Commercial gill-net fisheries and scientific research cruises (long line, trawl),
animals measured by fisheries observers and scientific personnel
Stevens and McLoughlin 1991 [39]
Australia (New South Wales) 382 [Male] 89 Sportfishing catches, some lengthsmeasured by scientific personnel others derived from weight using Length-Weight relationships established by Stevens 1984
Stevens 1984 [48]
Australia (Western Australia) 445 [Not given] 449 Scientific study using single-hook drumlines Wirsing et al. 2006 [12]
Australia (Western Australia) 407 [Not given] 252 Scientific study using single-hook drumlines Heithaus 2001 [46]
Australia (Western Australia) 430 [Female] 225 Scientific study using single, or double-hook setlines
Simpfendorfer et al. 2001 [6]
South Africa (KwaZulu-Natal) 410 [Female] 54 Shark control program and commercial fisheries, measured by scientific personnel
Bass et al. 1975 [47]
South Africa (KwaZulu-Natal) 392 [Male] 101 Shark control program measured by scientific personnel
Wintner and Dudley 2000 [11]
USA (Western North Atlantic) 417 [Female] 238 Research cruises, commercial and recreational fishing vessels, sportfishing tournaments, measured by scientific personnel
Kneebone et al. 2008 [13]
USA (Atlantic/Gulf of Mexico) 381 [Male and Female] 163 (1) Commercial and research longline catches, recreational tournament catches, measured by scientific personnel
Branstetter et al. 1987 [48]
USA (Gulf of Mexico) 410 [Female] 45 Longline and sportfishing catches measured by scientific personnel
Branstetter 1981 [49]
USA (Hawaii) 447 [Female] 318 Shark control program, incidental and research catches measured by scientific personnel
Whitney and Crow 2007 [7]
For ease of comparison, all measurements are Total Length in cm. Where necessary, original PCL of FL values have been converted to TL using length-length conversion relationships given in Table 3.
Analyses of Size and Growth
We used a one-way ANOVA with least squares testing of means to compare the average sizes of all captured male and female tiger sharks. Linear regression analyses were used to generate length-to-length conversion formulae (i.e. PCL to FL etc.) from our data set (both sexes combined). A Chi-squared test was used to determine whether tiger shark sex ratio was significantly different from 1:1.
Sex-specific and combined-sex mark-recapture data were fitted to the von Bertalanffy growth equation using two different methods. The first utilized the Gulland and Holt [23] method which uses linear regression to fit a line through a plot of average size versus annual growth rates with-Kequaling the slope of the line andL‘equaling thex-intercept. The second method was an
adaptation of the Francis [18] maximum likelihood model (GROTAG) for the Microsoft Excel solver function [19]. This method is a re-parameterization of the Fabens’ (1965) growth model, where the usual von Bertalanffy parameters,KandL‘, are
replaced by two alternative parameters,gaandgb, which represent mean annual growth increments (mm/yr) of chosen reference lengths a and b [18]. These parameters have better statistical properties thanKandL‘, particularly when the entire size range of
the species is not represented in the data [15], [18]. Additional parameters, such as growth variability (v), the mean (m) and standard deviation (s) of measurement error, seasonality (u,w), and outlier contamination (p) were added to the model in a step-wise fitting procedure. Likelihood ratio tests (LRT) were used to determine the final model, where for a significant (P,0.05) improvement in fit, the likelihood value must increase by at least 1.92 with the introduction of one parameter and 3.0 with the introduction of two parameters [18]. Ninety-five percent confi-dence intervals (CIs) were estimated using a bootstrapping method as implemented in GROTAG [19]. Significant differences between data sets were identified by comparing CIs and the extent of bootstrap overlap [24].
Only data from sharks at liberty for more than 25 days and with positive growth rates were used to generate growth estimates. Tiger shark reference lengths, a(104 cm) and b (240 cm) were chosen so that the majority of individuals in each data set were between these two values [18]. To facilitate comparisons of Hawaiian tiger shark growth parameters with those from previous studies [9], [10], [12] we used PCL measurements as the basis for our growth rate estimates and the GROTAG model outputs were converted to the von Bertalanffy growth parameters K and L‘
following Francis [18]. The best fit von Bertalanffy growth parameters K and L‘derived from the GROTAG model were
used to generate a growth curve for Hawaii tiger sharks (both sexes combined) assuming a birth size of 85 cm TL [7].
Results
Four hundred and twenty tiger sharks ranging in size from 88 to 464 cm TL (57 to 365 cm PCL) were captured from 1993 to 2013 (Fig. 1). The sex ratio of our sample was significantly skewed toward females (male:female ratio = 0.65, x2
[image:3.612.319.555.89.168.2]= 21.7, df = 1, p,0.001), and females were significantly larger on average than males (Table 2). The largest male tiger shark in our sample was 406 cm TL (327 cm PCL), whereas the largest female was 464 cm TL (365 cm PCL), and 14% of females captured were larger than the biggest male captured (Fig. 1). Overall, tiger sharks of at least 400 cm TL (,306 cm PCL) were relatively common, accounting for 10% of our sample, but individuals larger than 450 cm TL (,347 cm PCL) were very rare, accounting for only 2 of 420 (0.005%) sharks captured (Fig. 1). Length-length regression analyses yielded conversion relationships with R2 values .0.98 (Table 3).
Of the 420 tiger sharks tagged and released, 50 (11.9%) were recaptured, each on 1–3 occasions. For recaptured sharks, size at release ranged from 96 to 373 cm TL (63 to 282 cm PCL), size at recapture ranged from 174 to 384 cm TL (127 to 290 cm PCL) and time at liberty ranged from 15 to 2,421 days (median = 197 days). All recaptures were from within the Hawaiian Archipelago except a single shark recaptured by Mexican fishermen off Isla Jacques Cousteau (formerly Isla Cerralvo, 24u139170N 109u529140W), in the southern Gulf of California (minimum distance between tag and recapture sites = approximately
Figure 1. Size distribution of male and female tiger sharks captured in Hawaii 1993–2013.
[image:3.612.57.298.547.694.2]doi:10.1371/journal.pone.0084799.g001
Table 2.Average size of male and female tiger sharks captured by research fishing in Hawaii 1993–2013.
Male Female F df p
Total length 248.5 (84)[163] 296.8 (84)[251] 33.0 1, 412 p,0.001
Fork length 201.5 (73)[164] 243.1 (73)[249] 32.3 1, 411 p,0.001
Precaudal length
183.2 (68)[164] 220.9 (68)[253] 30.7 1, 415 p,0.001
Numbers in parentheses are standard deviations, numbers in square brackets are sample sizes. Anova test statistics (F) for the comparison of mean male and female sizes are given along with degrees of freedom (df) and probability values (p).
doi:10.1371/journal.pone.0084799.t002
Table 3.Length to length relationships for tiger sharks (male and female combined) captured in Hawaii 1993–2013.
x y b0 b1 r
2
PCL TL 26?15 (1?78) 1?22 (0?008) 0?98
TL PCL 217?38 (1?57) 0?81 (0?005) 0?98
FL TL 19?62 (1?68) 1?14 (0?007) 0?99
TL FL 213?57 (1.56) 0?87 (0?005) 0?99
PCL FL 6?07 (0?68) 1?07 (0?003) 0?99
FL PCL 24?95 (0?64) 0?93 (0?003) 0?99
Linear regression coefficients are for the modelyi=b0+b1xi.S.E. of the means are in parenthesis.
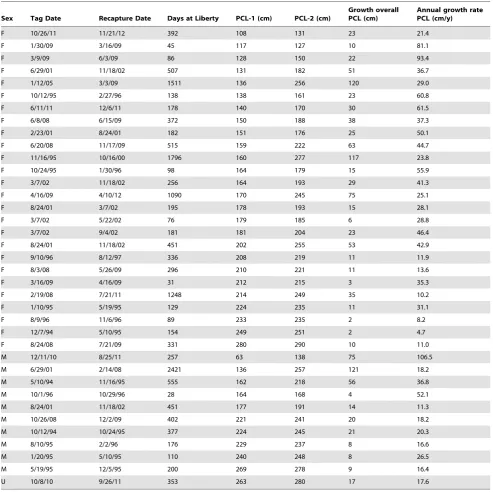
[image:3.612.318.555.588.694.2]5,000 km), after 366 days at liberty (DAL). Recaptured sharks with damaged or unreadable tags (N = 7), those not measured by scientific personnel (N = 2) or with negative growth (N = 4), were removed from the data set. The remaining 26 females, 10 males, and an additional unsexed individual were used in the sex-specific and sexes combined growth analyses (Table 4).
Gulland and Holt (1959) method
Linear regression analyses of average PCL versus annual growth rates yielded negative slopes (i.e. declining growth with increasing length) for males, females and both sexes combined. FemaleKwas
0.40 andPCL‘was 283.2 cm (TL‘= ,372 cm), maleKwas 0.48
and PCL‘was 272.1 cm (TL‘ = ,358 cm), and overall Kwas
0.41 andPCL‘was 282.5 cm (TL‘ = ,371 cm).
Francis (1988a) method
[image:4.612.63.557.221.713.2]The models containingga,gb, growth variability, and standard deviation of measurement error resulted in the best fit to the von Bertalanffy growth model for all data sets (Table 5). Model fit was not significantly improved by the inclusion of additional param-eters, as evident in the likelihood ratio tests. However, with the exception of model 1 for male and model 4 for female tiger sharks,
Table 4.Details of recaptured sharks used to estimate growth models.
Sex Tag Date Recapture Date Days at Liberty PCL-1 (cm) PCL-2 (cm)
Growth overall PCL (cm)
Annual growth rate PCL (cm/y)
F 10/26/11 11/21/12 392 108 131 23 21.4
F 1/30/09 3/16/09 45 117 127 10 81.1
F 3/9/09 6/3/09 86 128 150 22 93.4
F 6/29/01 11/18/02 507 131 182 51 36.7
F 1/12/05 3/3/09 1511 136 256 120 29.0
F 10/12/95 2/27/96 138 138 161 23 60.8
F 6/11/11 12/6/11 178 140 170 30 61.5
F 6/8/08 6/15/09 372 150 188 38 37.3
F 2/23/01 8/24/01 182 151 176 25 50.1
F 6/20/08 11/17/09 515 159 222 63 44.7
F 11/16/95 10/16/00 1796 160 277 117 23.8
F 10/24/95 1/30/96 98 164 179 15 55.9
F 3/7/02 11/18/02 256 164 193 29 41.3
F 4/16/09 4/10/12 1090 170 245 75 25.1
F 8/24/01 3/7/02 195 178 193 15 28.1
F 3/7/02 5/22/02 76 179 185 6 28.8
F 3/7/02 9/4/02 181 181 204 23 46.4
F 8/24/01 11/18/02 451 202 255 53 42.9
F 9/10/96 8/12/97 336 208 219 11 11.9
F 8/3/08 5/26/09 296 210 221 11 13.6
F 3/16/09 4/16/09 31 212 215 3 35.3
F 2/19/08 7/21/11 1248 214 249 35 10.2
F 1/10/95 5/19/95 129 224 235 11 31.1
F 8/9/96 11/6/96 89 233 235 2 8.2
F 12/7/94 5/10/95 154 249 251 2 4.7
F 8/24/08 7/21/09 331 280 290 10 11.0
M 12/11/10 8/25/11 257 63 138 75 106.5
M 6/29/01 2/14/08 2421 136 257 121 18.2
M 5/10/94 11/16/95 555 162 218 56 36.8
M 10/1/96 10/29/96 28 164 168 4 52.1
M 8/24/01 11/18/02 451 177 191 14 11.3
M 10/26/08 12/2/09 402 221 241 20 18.2
M 10/12/94 10/24/95 377 224 245 21 20.3
M 8/10/95 2/2/96 176 229 237 8 16.6
M 1/20/95 5/10/95 110 240 248 8 26.5
M 5/19/95 12/5/95 200 269 278 9 16.4
U 10/8/10 9/26/11 353 263 280 17 17.6
PCL = Precaudal Length.
estimates of all parameters were very similar among all models and all data sets. Similarity between parameter estimates and the low value of the standard deviation of measurement error suggests the model was unable to accurately estimate measurement error, probably due to low sample size and lack of individuals at liberty for short amounts of time (,30 days) in the final data set. No individuals had absolute standardized residuals greater than 3.0; therefore, exclusion of the outlier contamination parameter from the final model was warranted as also evident by the lack of improvement of fit with its inclusion.
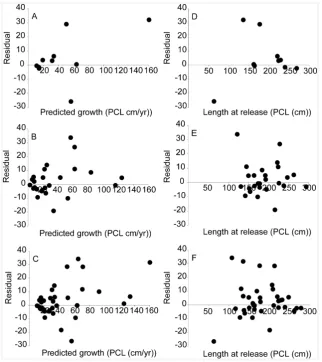
To assess final model fits, residuals were plotted against length-at-release and predicted growth (Figure 2). Residuals declined with increasing length-at-release because mean growth declined with length [25], whereas residuals versus predicted growth showed the opposite trend, as would be expected. Standardized residuals (residuals divided by si, which, in the selected models, equalss)
showed no pattern, indicating that the model assumption that growth variability is dependent on mean growth was not violated [15]. Overall, suitability of final models from tiger shark mark-recapture data was indicated by residual plots.
The best fit models for the sex-specific and both sexes combined data sets resulted in very similar growth-at-size estimates (ga, gb) and the convertedKandL‘(Table 5). The estimatedKwas 0.31
for all data sets and PCL‘ ranged from 308.9 cm (TL‘ = ,403.0 cm) to 311.5 cm (TL‘ = ,405.8 cm). The estimated
growth variability ranged from 0.34 to 0.38 between data sets. Ninety-five percent confidence intervals were greater for males relative to females and both sexes combined, likely due to the lower sample size of males.
The growth curve generated from Von Bertalanffy parameters produced by the best fit GROTAG model (Figure 3) illustrates the early rapid growth of tiger sharks in Hawaii. On average, tiger sharks in Hawaii reach 340 cm TL by age 5, and attain a maximum size of 403 cm TL. Our model further indicates that the fastest growing individuals attain 400 cm TL by age 5, and the largest reach a maximum size of 444 cm TL.
Discussion
[image:6.612.57.380.333.696.2]Although our sample size was relatively small (37 useable recaptures), it was within the recapture sample size range used to generate tiger shark growth curves in other previously-published studies (e.g. N = 19, [12], N = 42, [10]). Our sample also consisted of validated measurements of growth over a wide range of tiger shark sizes, and yielded robust estimates of growth using the Francis [15] method. This method has been used previously to estimate growth of several shark species including dusky shark (Carcharhinus obscurus) [19], [26], shortfin mako shark (Isurus oxyrhincus) [27], tiger shark [13], porbeagle shark (Lamna nasus) [28], blue shark (Prionace glauca) [29], school shark (Galeorhinus
galeus) [30], and whiskery shark (Furgaleus macki) [31]. In studies where both the Francis [15] and Gulland and Holt [23] methods were employed they either produced similar growth estimates [29], [30] or the Francis [15] method produced more biologically realistic growth estimates [13], [29], [32]. An important caveat of all growth models is that reliability can be compromised when recapture size range is not representative of population size ranges. The Gulland and Holt [23] method is particularly vulnerable to such shortcomings. This is apparent in the present study with the lack of recaptured very large (i.e. slowest growing) individuals resulting in the Gulland and Holt [23] model producing a smaller
L‘. Although it is not possible to statistically compare the two
methods, the Francis [15] method is preferred over the Gulland and Holt [23] method for Hawaii tiger shark tag/recapture data for two reasons: 1) residual plots indicate a satisfactory fit to the data, and 2) the best fit model included parameters for individual variability in growth (v) and measurement error (s), thus warranting the use of a model that can capture these potential sources of bias.
Failing to explicitly account for individual variability in growth (i.e., assuming all individuals in a population grow according to fixed parameters) and measurement error can result in biased mean growth estimates [32–34]. Estimates of Hawaii tiger shark individual variability in growth are similar to those produced by the Francis [18] method for western north Atlantic tiger sharks [13]. This suggests that individual variability in growth is typical for tiger sharks across their geographic range, as is also the case in other carcharhinids (e.g. Blacknose sharks, Carcharhinus acronotus; [35]). Although small, the best fit model also includedsindicating that it was substantial enough to influence growth estimates. The inclusion ofsbut notmis common in many growth studies that use the Francis method [19].
Our results suggest tiger sharks in Hawaii grow twice as fast as previously believed (K = 0.31, this study, versus K= 0.16 [16]), and thus exhibit growth rates consistent with those seen in several other regions (e.g.K= 0.27–0.46 in NW Atlantic [13]). Overall, tiger sharks are fast growing compared to other shark species in
Hawaii (e.g.K= 0.10–0.12 for Hawaii sandbar sharks,Carcharhinus plumbeus[14]). This is especially true of juvenile tiger sharks which were found to grow over 100 cm year21 in Hawaii, a rate comparable to that recently reported for juvenile tiger sharks in the South Atlantic (118 cm year21[36]). This rapid growth may be a strategy for reducing juvenile predation risk as has also been suggested for the rapidly-growing smalltooth sawfish, Pristis pectinata, which is another elasmobranch that reaches a large adult size [37]. In order to fuel their rapid growth, tiger sharks presumably eat more prey than slower-growing sharks, and may achieve this by targeting slow-moving, armored and toxic species that are infrequently exploited by other predators (e.g. [5], [6]).
Another consequence of this rapid growth is that tiger sharks in Hawaii probably reach maturity at a relatively young age. Using the minimum size of maturity estimates provided by Whitney and Crow [7] (Fig. 3), our new growth rate estimate suggests that on average female tiger sharks reach maturity by age 5 and males by age 4, with the fastest growing individuals of both sexes reaching maturity in as little as 3 years, comparable to recent estimates of minimum age of maturity for tiger sharks in the South Atlantic off Brazil (approximately 3.5 years, [36]).
Other demographic characteristics of the Hawaii tiger shark population were also consistent with those in several other regions. For example, the sex ratio among Hawaii tiger sharks was significantly skewed toward females, as has also been reported from Australia [12],[38–40], the Southeastern United States [41] and South Africa [11]. This female-biased ratio may indicate sexual segregation (e.g., females occupy coastal areas where most fishing effort occurred, whereas males occupy offshore habitats [42]) asin uterosex ratios in Hawaii are close to 1:1 [7]. Sexual segregation is widespread in the animal kingdom [43], is seen in other carcharhinid species in Hawaii (e.g. sandbar sharks, [1], [44]) and may be driven by sex-specific environmental preferences [42].
[image:7.612.57.291.58.236.2]Hawaii female tiger sharks were significantly larger on average than males, a phenomenon also evident in other locations (e.g., Queensland, Australia [38]) but not ubiquitously (e.g., males were found to be significantly larger than females in Shark Bay, Western Australia [12], [45]). The maximum observed size of tiger sharks in Hawaii (464 cm TL) is generally consistent with those reported from other regions where sharks have been empirically measured as part of scientific studies (Table 1). Tiger sharks of 400 cm TL or larger are relatively common in Hawaii, accounting for 10% of our sample, whereas those larger than 450 cm TL were very rare, (0.005% of sharks captured). One empirical study conducted in Australia reported a maximum size (550 cm TL) [40], consider-ably larger than any scientifically-measured tiger shark in any other location (Table 1). This Australian study had a very large sample size (4,757 sharks) compared to most others, hence had a higher probability of picking up the rare, very largest individuals in the population, than studies with sample sizes of an order of magnitude lower. One concern associated with estimating maximum size of large sharks is that the very largest individuals in the population may simply be escaping capture by straightening hooks or breaking net meshes. We do not believe this to be the case in the present study because our fishing gear was similar to that used during the Australian study which captured tiger sharks of up to 550 cm TL. Thus we conclude that tiger sharks larger than 450 cm TL are very uncommon, and only an extremely small number of individuals reach or exceed 550 cm TL. The veracity of the report of a 740 cm TL (3,110 kg) female caught off Indo-China in 1957 [8] is unclear, as it is based on an unverified, annotated photograph rather than an empirical measurement. Figure 3. Von Bertalanffy growth curves for Hawaii tiger sharks
(both sexes combined).Growth curves are derived from parameters generated by the best fit GROTAG model (Solid line = average growth. Dashed line = upper and lower 95% growth estimates) and analysis of vertebral rings (De Crosta et al. [16], dotted grey line) Arrows indicate estimates of minimum age at maturity for male (blue) and female (red) tiger sharks based on size at maturity estimates (horizontal lines) provided by Whitney and Crow (2007) [7].
Acknowledgements
Sustaining a shark tagging program for twenty years requires a tremendous amount of effort by a multitude of individuals above and beyond the authors of this study. We are especially grateful to C. Lowe, B. Wetherbee, N. Whitney, R.D. Grubbs, S. Kajiura, A. Bush, K. Duncan-Seraphin and T. Fitzgerald for their contributions to the fishing efforts that resulted in this data set. We thank United Fishing Agency, Tamashiro Market and Kona Fish Company for providing us with bait.
Author Contributions
Conceived and designed the experiments: CGM KNH. Performed the experiments: CGM YPP JJD MRH JMA MAR KNH. Analyzed the data: CGM JMO JMA MAR. Contributed reagents/materials/analysis tools: CGM JMO JMA. Wrote the paper: CGM JMO YPP JJD MRH JMA MAR.
References
1. Meyer CG, Dale JJ, Papastamatiou YP, Whitney NM, Holland KN (2009) Seasonal cycles and long term trends in abundance and species composition of sharks associated with cage diving ecotourism activities in Hawaii. Environ Conserv 36: 104–111. doi: 10.1017/S0376892909990038.
2. Meyer CG, Papastamatiou YP, Holland KN (2010) A multiple instrument approach to quantifying the movement patterns and habitat use of Tiger
(Galeocerdo cuvier) and Galapagos sharks (Carcharhinus galapagensis) at French Frigate
Shoals, Hawaii. Mar Biol 157: 1857–1868. doi: 10.1007/s00227-010-1457-x. 3. Fitzpatrick R, Thums M, Bell I, Meekan MG, Stevens JD, et al. (2012) A
Comparison of the Seasonal Movements of Tiger Sharks and Green Turtles Provides Insight into Their Predator-Prey Relationship. PLoS ONE 7(12): e51927. doi:10.1371/journal.pone.0051927.
4. Hammerschlag N, Gallagher AJ, Wester J, Luo J, Ault JS (2012) Don’t bite the hand that feeds: assessing ecological impacts of provisioning ecotourism on an apex marine predator. Functl Ecol 26: 567–576. doi: 111/j.1365-2435. 2012.01973.x.
5. Lowe CG, Wetherbee BM, Crow GL (1996) Ontogenetic dietary shifts and feeding behaviour of the tiger shark, Galeocerdo cuvier, in Hawaiian waters. Environ Biol Fish 47: 203–212.
6. Simpfendorfer CA, Goodreid AB, McAuley RB (2001) Size, Sex and geographic variation in the diet of the tiger shark,Galeocerdo cuvier, from Western Australian waters. Environ Biol Fishes 61:37–46 doi: 10.1023/A:1011021710183. 7. Whitney NM, Crow GL (2007) Reproductive biology of the tiger shark (Galeocerdo
cuvier) in Hawaii. Mar Biol 151: 63–70 doi: 10.1007/s00227-006-0476-0.
8. Fourmanoir P (1961) Requins de la coˆte ouest de Madagascar. Mem Inst Sci Madagascar (Ser.F) 4: 1–81.
9. Branstetter S, Musick JA, Colvocoresses JA (1987) A comparison of the age and growth of the tiger shark,Galeocerdo cuvier, from off Virginia and from the Northwestern Gulf of Mexico. Fish Bull 85(2): 269–279.
10. Natanson LJ, Casey JG, Kohler NE, Colket T (1999) Growth of the tiger shark,
Galeocerdo cuvier, in the western North Atlantic based on tag returns and length
frequencies; and a note on the effects of tagging. Fish Bull 97: 944–953. 11. Wintner SP, Dudley SFJ (2000) Age and growth estimates for the tiger shark,
Galeocerdo cuvier, from the east coast of South Africa. Mar Freshwater Res 51: 43–
53.
12. Wirsing AJ, Heithaus MR, Dill M (2006) Tiger shark (Galeocerdo cuvier) abundance and growth in a subtropical embayment: evidence from 7 years of standardized fishing effort. Mar Biol 149: 961–968.
13. Kneebone J, Natanson LJ, Andrews AH, Howell WH (2008) Using bomb radiocarbon analyses to validate age and growth estimates for the tiger shark,
Galeocerdo cuvier, in the western North Atlantic. Mar Biol 154: 423–434.
14. Romine JG, Grubbs RD, Musick JA (2006) Age and growth of the sandbar shark, Carcharhinus plumbeus, in Hawaiian waters through vertebral analysis. Environ Biol Fishes 77: 229–239.
15. Francis RICC (1988) Are growth parameters estimated from tagging and age-length data comparable? Can J Fish Aquat Sci 45: 936–942.
16. DeCrosta MA, Taylor LR, Parrish JD (1984) Age determination, growth and energetics of three species of carcharinid sharks in Hawai’i. In: Grigg RW, Tanoue KY, editors. Proceedings of the 2nd Symposium on Resource Investigations in the NWHI, Vol 2 UNIHI-SEA-GRANT-MR-84–01. Hono-lulu: University of Hawaii Sea Grant. pp. 75–95.
17. Cailliet GM, Goldman KJ (2004) Age determination and validation in chondrichthyan fishes. In: Carrier J, Musick JA, Heithaus MR, editors. Biology of Sharks and their Relatives. Boca Raton: CRC Press. pp. 399–447. 18. Francis RICC (1988) Maximum likelihood estimation of growth and growth
variability from tagging data. N Z J Mar Freshwater Res 22: 42–51. 19. Simpfendorfer CA (2000) Growth rates of juvenile dusky sharks,Carcharhinus
obscurus (Lesueur, 1818), from southwestern Australia estimated from tag–
recapture data. Fish Bull 98: 811–822.
20. Kohler NE, Turner PA (2001) Shark tagging: a review of conventional methods and studies. Environ Biol Fishes 60: 191–223.
21. Holland KN, Wetherbee BM, Lowe CG, Meyer CG (1999) Movements of tiger sharks (Galeocerdo cuvier) in coastal Hawaiian waters. Mar Biol 134: 665–675. 22. Ebert DA, Stehmann MFW (2013) Sharks, batoids, and chimaeras of the North
Atlantic. In: FAO Species Catalogue for Fishery Purposes. No. 7. Rome: FAO. 523 p.
23. Gulland JA, Holt SJ (1959) Estimation of growth parameters for data at unequal time intervals. Journ Cons CIEM 25: 47–49.
24. Welsford DC, Lyle JM (2005) Estimates of growth and comparisons of growth rates determined from length- and age-based models for populations of purple wrasse (Notolabrus fucicola). Fish Bull 103: 697–711.
25. McGarvey R, Ferguson GJ, Prescott JH (1999) Spatial variation in mean growth rates at size of southern rock lobster,Jasus edwardsii, in South Australian waters. Mar Freshw Res 50: 333–342.
26. Hussey NE, McCarthy ID, Dudley SFJ, Mann BQ (2009) Nursery grounds, movement patterns and growth rates of dusky sharks,Carcharhinus obscurus: a long-term tag and release study in South African waters. Mar Freshw Res 60: 571–583.
27. Natanson LJ, Kohler NE, Ardizzone D, Cailliet GM, Wintner SP, et al. (2006) Validated age and growth estimates for the shortfin mako,Isurus oxyrinchus, in the North Atlantic Ocean. In: Goldman KJ, Carlson JK editors. Special volume from symposium of the American Elasmobranch Society, July 2005. Environ Biol Fish 77: 367–383.
28. Natanson LJ, Mello JJ, Campana SE (2002) Validated age and growth of the porbeagle shark,Lamna nasus, in the western north Atlantic Ocean. Col Vol Sci Pap ICCAT 54: 1261–1279.
29. Skomal GB, Natanson LJ (2003) Age and growth of the blue shark (Prionace
glauca) in the North Atlantic Ocean. Fish Bull 101: 627–639.
30. Francis MP, Mulligan KP (1998) Age and growth of New Zealand school shark,
Galeorhinus galeus. N Z J Mar Freshwater Res 32: 427–440.
31. Simpfendorfer CA, Chidlow J, McAuley R, Unsworth P (2000) Age and growth of the whiskery shark,Furgaleus macki, from southwestern Australia. Environ Biol Fish 58: 335–343.
32. Sainsbury KJ (1980) Effect of Individual Variability on the von Bertalanffy Growth Equation. Can J Fish Aquat Sci 37: 241–247. doi: 10.1139/f80-031. 33. Tyler JA, Rose KA (1994) Individual variability and spatial heterogeneity in fish
population models. Rev Fish Biol Fisheries 4(1): 91–123. doi: 10.1007/ BF00043262.
34. Smith EB, Williams FM, Fisher CR (1997) Effects of intrapopulation variability on von Bertalanffy growth parameter estimates from equal mark–recapture intervals. Can J Fish Aquat Sci 54(9): 2025–2032. doi: 10.1139/f97-110. 35. Carlson JK, Corte´s E, Johnson AG (1999) Age and Growth of the Blacknose
Shark,Carcharhinus acronotus, in the Eastern Gulf of Mexico. Copeia 3(Aug. 2, 1999): 684–691.
36. Afonso AS, Hazin FHV, Barreto RR, Santana FM, Lessa RP (2012) Extraordinary growth in tiger sharksGaleocerdo cuvierfrom the South Atlantic Ocean. J Fish Biol 81: 2080–2085. doi:10.1111/j.1095-8649.2012.03455.x. 37. Simpfendorfer CA, Poulakis GR, O’Donnell PM, Wiley TR (2008) Growth rates
of juvenile smalltooth sawfishPristis pectinataLatham in the western Atlantic. J Fish Biol 72: 711–723.
38. Stevens JD, McLoughlin KJ (1991) Distribution, size and sex composition, reproductive biology and diet of sharks from Northern Australia. Aust J Mar Freshwat Res 42: 151–199.
39. Simpfendorfer CA (1992) Biology of Tiger Sharks (Galeocerdo cuvier) Caught by the Queensland Shark Meshing Program off Townsville, Australia. Aust J Mar Freshwater Res 43: 33–43.
40. Holmes BJ, Sumpton WD, Mayer DG, Tibbetts IR, Neil DT, et al. (2012) Declining trends in annual catch rates of the tiger shark (Galeocerdo cuvier) in Queensland, Australia. Fish Res 129–130: 38–45.
41. Beerkircher LR, Corte´s E, Shivji M (2002) Characteristics of shark bycatch observed on pelagic longlines off the southeastern United States, 1992–2000. Mar Fish Rev 64: 40–49.
42. Papastamatiou YP, Meyer CG, Carvalho F, Dale JJ, Hutchinson MR, et al. (2013) Telemetry and random walk models reveal complex patterns of partial migration in a large marine predator. Ecology 94: 2595–2606.
43. Wearmouth VJ, Sims DW (2008) Sexual segregation in marine fish, reptiles, birds and mammals: behavior patterns, mechanisms and conservation implications. Adv Mar Biol 54: 107–170.
44. Papastamatiou YP, Itano DG, Dale JJ, Meyer CG, Holland KN (2010) Site fidelity and movements of sharks associated with ocean-farming cages in Hawaii. Mar Freshw Res 61: 1366–1375.
45. Heithaus MR (2001) The biology of tiger sharks,Galeocerdo cuvier, in Shark Bay, Western Australia: sex ratio, size distribution, diet, and seasonal changes in cratch rates. Environ Biol Fishes 61: 25–36.
47. Branstetter S (1981) Biological notes on the sharks of the north central Gulf of Mexico. Contrib Mar Sci 24: 13–34.
48. Stevens JD (1984) Biological observations on sharks caught by sport fisherman of New South Wales. Aust J Mar Freshwater Res 35: 573–590.