CONSTRAINED COMPLEX BRAIN NETWORKS
REUBEN O’DEA1, JONATHAN J. CROFTS1, AND MARCUS KAISER2,3,4
Abstract. The study of dynamical systems defined on complex
networks provides a natural framework with which to investigate myriad features of neural dynamics, and has been widely under-taken. Typically, however, networks employed in theoretical stud-ies bear little relation to the spatial embedding or connectivity of the neural networks that they attempt to replicate. Here, we employ detailed neuroimaging data to define a network whose spa-tial embedding represents accurately the folded structure of the cortical surface of a rat and investigate the propagation of ac-tivity over this network under simple spreading and connecac-tivity rules. By comparison with standard network models with the same coarse statistics, we show that the cortical geometry influences pro-foundly the speed propagation of activation through the network. Our conclusions are of high relevance to the theoretical modelling of epileptic seizure events, and indicate that such studies which omit physiological network structure risk simplifying the dynamics in a potentially significant way.
1. Introduction
The newly emerging discipline of Network Science provides a general framework for representing, modelling and predicting the behaviour of complex systems belonging to areas as diverse as social science, biol-ogy and information technolbiol-ogy [1]. Motivated by the observation that most real-world networks fail to conform to the homogeneous Poisso-nian degree distribution admitted by Erd˝os-R´enyi random graphs [2], improved network models were constructed (most notably the
small-world modelof Watts and Strogatz [3] and the preferential attachment
modelof Barabasi and Albert [4]) that were capable of recovering many
of the interesting features displayed by real-world network data. Initial
Date: January 24, 2013.
Key words and phrases. spreading dynamics, network science, neuroscience, epilepsy.
investigations into complex networks focussed primarily on the char-acterisation of networks in terms of a small number of topological pa-rameters; however, more recently, interest has shifted towards under-standing the influence of network structure on the dynamic processes occurring upon them – see, for example, [5, 6] and references therein.
Such investigations are particularly relevant to biological systems, in which a well-defined network structure is frequently a key feature, the evolution and topology of which are presumed to affect relevant biological processes. A paradigm for such studies is that of neural sys-tems, which have been widely studied in this context with the aim of providing a more complete understanding of epilepsy and other neural conditions [7]. Epilepsy is characterised by recurrent and unpredictable instances of “excessive, or synchronous neuronal activity” (seizures) [8]; the synchronisation of neuronal activity in networks has therefore re-ceived significant attention, and network topology is considered to be a dominant factor affecting spreading dynamics [9, 10, 11, 12, 13, 14], independent of the specific model by which activation is transmit-ted across the network. A wide range of transmission models has been employed in the literature. Representative examples include sim-ple cellular automata-type spreading rules [11, 15] and pulse-cousim-pled- pulse-coupled-oscillators [9] (and references therein), of which integrate-and-fire mod-els [13, 16, 17] are a special case. We note that in,e.g.[9, 10, 11] (and in the present work), network nodes are to be interpreted as ‘neural units’ comprising many neurons, and representing a single cortical column, say. Detailed consideration of synaptic signalling models is therefore not appropriate.
A further essential aspect of neural systems is that they are spatially embedded –i.e., their nodes and edges are constrained to lie on a fixed geometric structure, and it is expected that these additional factors will further influence network dynamics. Indeed, though spatial networks have received considerable attention of late [18], the influence of spatial embedding upon network dynamics is not well understood.
media [28] — an organization that is different from the rounded shape of model organisms such as rodents or convoluted brain surfaces such as for humans. Note that this limitation not only relates to epilepsy modelling but also to studies of spreading depression [29, 30].
In this work, we seek to address the deficiency in neural network studies discussed above. We employ detailed spatial information ob-tained from freely-available neuroimaging data of a rat brain to de-fine a physiologically-relevant neural network and, via comparison with commonly-employed network architectures, determine the influence of the connectivity and complex surface geometry of the brain on seizure dynamics. We restrict attention to lattice-like network structures (i.e., networks that display significant clustering and long average path-lengths), and a basic spreading model in favour of the more complex signalling models outlined above, as the aim here is to highlight the contribution of spatial network properties to signal transmission. We also limit our current study to spreading on the brain surface; the role of long-distance white matter fibre tracts between brain regions is not part of this work.
2. Spatial complex networks
In this paper, we investigate the influence of network structure on the dynamics of the processes occurring upon them, with specific appli-cation to neural signalling. We achieve this by comparing the spreading dynamics of simulated neural activation within a rat cortex with those obtained on commonly-employed spatial networks. All of the networks examined herein are unweighted, undirected, and without loops.
A plethora of tools and techniques for characterising complex net-works exists [31]; however, in the context of spatial netnet-works not all of these measures remain relevant. An important feature of neural net-works is the propensity for nearby nodes to connect, and thus, such graphs tend to exhibit high levels of local clustering. In addition, ver-tex reachability (defined as the ability to travel between nodes i and
j following connections within the network) impacts significantly on spreading dynamics. In view of this, systematic comparison of the network models considered here will be effected via the clustering co-efficient, which is given mathematically as
(1) C = 1
N
N
X
i=1 Ci,
whereCi denotes the probability that any two neighbours of node iare
connected and N the order of the graph. Additionally, we employ the characteristic path-length, L, which is defined as the number of edges in the shortest path between two vertices, averaged over all pairs of vertices. We remark that if the network is not fully connected then the characteristic path-length diverges, as a disconnected pair corresponds to an infinite path.
2.1. Rat cortical network. Spatial coordinates defining the cortical surface of the rat were obtained from the Caret software package [32] and processed using the Caret Matlab toolbox. Figure 1(a) shows the cortical surface of the left hemisphere of the rat brain, with typical neural activity spreading obtained via numerical simulation (see §3) superimposed.
Restricting to the left hemisphere, we construct a cortical rat net-work, with nodes positioned on the Nrat = 9623 available data points
−4 −2
0 −6 −4 −2 0 2 4 6 −3 −2 −1 0 1 2 3 4 5 6 x y z (a)
0 0.2 0.4 0.6 0.8 1
0 0.1 0.2 0.3 0.4 0.5 0.6 0.7 0.8 0.9 1 x y (b)
0 0.2 0.4 0.6 0.8 1
[image:5.612.135.488.90.226.2]0 0.1 0.2 0.3 0.4 0.5 0.6 0.7 0.8 0.9 1 x y (c)
Figure 1. A typical simulation of spreading dynamics in spatially constrained networks. Blue dots denote ac-tivated nodes (colour online). (a) A spatial network em-bedded on the left-hemisphere of the rat cortex; (b) a 2D square lattice graph; (c) a 2D periodic random geometric graph.
path, calculated using the nearest-neighbour network defined in (i), between connected nodes exceeds a predefined number of steps, which is defined experimentally. While Euclidean distance is a reasonable estimate of physiological connection length in general [24], the third step is necessary to remove spurious edges which arise for larger, that are near in the ambient space, yet distant as measured on the cortical surface: shortest path length, defined via a simple mesh triangulation provides a simple method with which to measure this disparity.
2.2. Standard network models. To discern the importance of net-work structure on activation spreading dynamics, we compare the spread-ing dynamics observed on the cortical network defined in§2.1 with that observed on a uniform square lattice graph and on an ensemble of two-dimensional geometric random graphs [33], network structures typical of those employed in the literature [21, 22, 23].
To construct a random geometric graph we place uniformly and inde-pendentlyN nodes at random on the unit square, and form connections between pairs of nodes according to Euclidean distance. Similarly, a square lattice graph is obtained by forming distance-dependent con-nections within a N-point uniform square lattice on the unit square. Figures 1(b,c) illustrate these networks, and a typical simulation of neural activity.
For comparability with the cortical network outlined in §2.1, we choose N = 9604 (the closest square number to Nrat) and control the
the Caret Matlab toolbox to be S ≈221 (arbitrary units), which pro-vides a scaling: ˜r=r/√S. Additionally, we impose periodic boundary conditions.
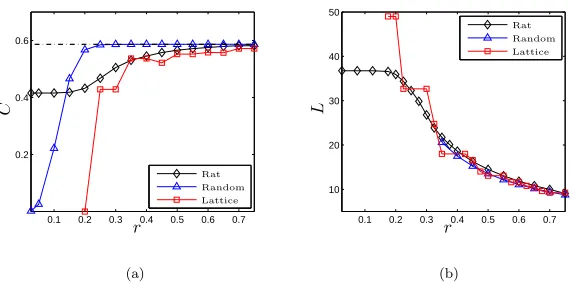
Figure 2 shows how the network measures C and L, with which we quantify differences between the three networks, vary with the connec-tivity distance, r. Ensemble measures for the random graph are calcu-lated from 10,000 realisations. These results indicate that the networks exhibit distinctly different features when restricted to short-range con-nections (smallr), while highly-connected networks are comparable. It is noteworthy that the value of the mean clustering coefficient for the random graphs tends to the theoretical value
(2) 1− 1
Γ 32√π
3 4
32
≈0.58650
obtained in [34], where Γ(x) denotes the gamma function.
We remark that for r < 0.2 we find ˜r < 1/√N, and therefore no connections exist in the square lattice graph (see Figure 2(a)). At
r= 0.2 the connectivity of the lattice graph corresponds to a four-point nearest-neighbour stencil (so that the connectivity matrix is analogous to a discrete Laplacian operator), and since nearest-neighbours of a vertex are not neighbours of each other, it follows thatC = 0. In addi-tion, note that due to interplay between the regular discrete structure of the lattice and our rule based upon Euclidean distance with which to add new edges, variation of the clustering coefficient for the lattice graph is non-monotone with respect tor. The mean degree of the other networks is d≈5 (data not shown). Lastly, we note that for r <0.35, the random graphs are not fully-connected, hence the absence of data in Figure 2(b).
3. Spreading dynamics
Propagation of activation within each neural network defined in§§2.1 and 2.2 was governed by a basic spreading model [11, 15], summarised as follows.
Nodes i are restricted to exist in one of two states: active (xi = 1),
or inactive (xi = 0). Starting from an initial activation state,
0.1 0.2 0.3 0.4 0.5 0.6 0.7 0.2
0.4 0.6
C
r
Rat
Random
Lattice
(a)
0.1 0.2 0.3 0.4 0.5 0.6 0.7 10
20 30 40 50
L
r
Rat
Random
Lattice
[image:7.612.164.450.112.253.2](b)
Figure 2. Network measures. The clustering coefficient
Cand average path lengthLof each network plotted as a function of the connectivity distance,r. The dot-dashed line in (a) indicates the asymptote provided by Equation (2). Data for the random graph is calculated from 10,000 realisations; in the parameter range r ∈ [0.35,0.5] the maximum standard deviation of C and L is σ = 0.0016 and 0.0301, respectively.
on spreading dynamics provides a convenient and compelling method with which to highlight the differences imparted by the networks under consideration. We choose the mean fraction of activated nodes as our key metric with which to investigate the different networks. Ensemble measures of network dynamics on the random graphs and rat network were constructed from 10,000 simulations; behaviour in the uniform lattice is identical for all initial activation positions.
cortical columns, rather than long-range white matter fibre tracts, say. We therefore restrict attention to connection distances r ∈ [0.35,0.5], leading to mean degrees in the cortical network hdrati ∈ [17.59,37.36].
Whilst actual estimates for mean degree in the rat cortex are not avail-able, such connectivity is typical of that employed in the literature (see,
e.g. [9, 10, 11] and references therein), particularly when one accounts for the large spread of observed degrees (e.g., for r = 0.35 the degree ranges from 8 to 48 whilst for r = 0.5 it lies between 20 and 87), and so serves to illustrate our methodology. For brevity, in the figures that follow, we illustrate the differences in spreading dynamics obtained in each network for the choices r= 0.35 and r= 0.5.
Figure 1 shows a typical pattern of activation at an illustrative time-point in each of the three networks, which serves to highlight clearly how differences in the underlying network connectivity are made man-ifest in the spreading of activation through the network. We remark that patterns of excitation are ‘well-defined’ and uniform in the rat and lattice graphs, with all nodes within a region activated, while in the random graphs, lack of connectivity can lead to bottlenecks (here, we choose r= 0.25 to highlight these structural differences).
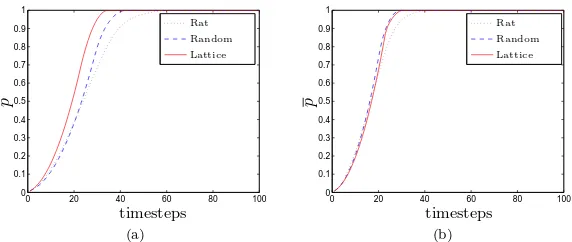
Figure 3 shows the spread of activation through each network, as measured by the fraction of activated nodes (averaged over all in-stances). Figure 3(a) indicates that for lower network connectivity (r = 0.35; the mean degree in each network was comparable: hdrati=
17.59, hdrandi = 16.09 and dlatt = 20) the activation speed in each
of the three networks differs significantly: the lattice graph requires dramatically fewer timesteps to achieve entire network activation; the cortical network is the slowest of the three. In fact, we observe a 1.88-fold and 1.45-1.88-fold increase in activation time in the rat network when compared to the lattice and random graphs, respectively. For more highly-connected networks (r= 0.5), the cortical network remains the slowest to activate; however, the lattice and random graphs now dis-play similar activation rates, with the uniform lattice being marginally faster. The delay imparted by the cortical network is now 1.65-fold (lattice) and 1.46-fold (random graphs).
Figures 4 and 5 highlight the influence of initial activation position on the spreading dynamics, which is quantified by the time to full-network activation, t∗. For the values of connectivity distance,r, analysed here, full network spreading was observed for all networks independent of topology. Therefore, all simulations contributed to the calculation of
t∗.
0 20 40 60 80 100 0
0.1 0.2 0.3 0.4 0.5 0.6 0.7 0.8 0.9 1
timesteps
p
Rat Random Lattice
(a)
0 20 40 60 80 100
0 0.1 0.2 0.3 0.4 0.5 0.6 0.7 0.8 0.9 1
timesteps
p
Rat Random Lattice
[image:9.612.164.450.113.234.2](b)
Figure 3. The evolution of the mean fraction of acti-vated nodes, p, in the rat network, random graphs and lattice for different connectivity distances: (a) r = 0.35, (b) r= 0.5.
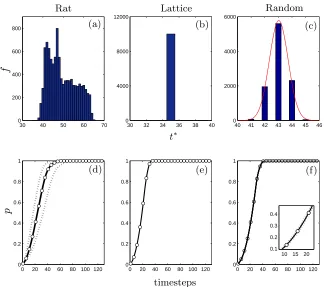
show the corresponding activation spread for each simulation, together with the ensemble mean. The delta-function obtained in Figure 4(b) and the corresponding results shown in Figure 4(e), reflect the fact that the network dynamics are identical for all realisations, due to the uniform structure throughout the lattice, and the periodic boundary conditions. In contrast, Figures 4(a) and (d) indicate a very wide spread of activation times, and with no clear distribution, in the corti-cal network. In the random graphs, t∗ displays small variation on each realisation; a wider spread is exhibited for a less well-connected net-work (data not shown). As highlighted by Figure 4(c), this distribution is well-characterised by a Gaussian with mean µ= 43.03 and variance
σ = 0.6901 (p < 0.01). The observed distributions of spreading dy-namics for the cortical and the random networks (Figures 4(a) and 4(c) respectively) were found to differ significantly (p <10−5 over the
investigated parameter range) according to the Kolmogorov-Smirnov statistic.
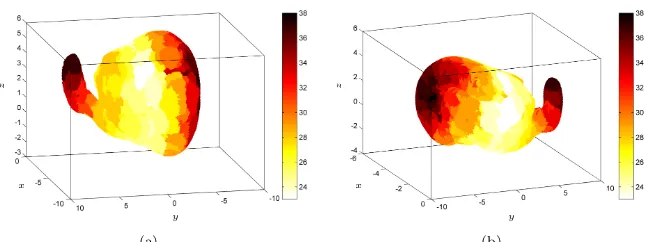
In Figure 5 heat maps are presented to highlight those initial acti-vation sites in the cortical network which provide significantly higher full-network activation speeds. These results indicate that the differ-ences in activation time shown in Figure 4 are due to the geometric structure of the rat brain and the presence of folded and smooth re-gions in the rat cortical surface.
0 20 40 60 80 100 120 0
0.2 0.4 0.6 0.8 1
40 41 42 43 44 45 46
0 2000 4000 6000
30 32 34 36 38 40
0 4000 8000 12000
30 40 50 60 70
0 200 400 600 800
0 20 40 60 80 100 120
0 0.2 0.4 0.6 0.8 1
0 20 40 60 80 100 120
0 0.2 0.4 0.6 0.8 1
10 15 20
0.1 0.2 0.3 0.4
timesteps
(a) (b) (c)
(d) (e) (f)
t∗
f
p
[image:10.612.145.470.112.399.2]Rat Lattice Random
Figure 4. Simulation results indicating the variabil-ity in activation dynamics in each network. Panels (a), (d) contain results in the cortical network; (b), (e), the lattice; and (c), (f) the random graphs. Upper panels (a)–(c): Histograms showing the time to full activation
t∗. In (c), a comparison with a Gaussian distribution (µ = 43.03, σ = 0.6901) is also shown. Lower panels (d)–(f): The evolution of the mean fraction of activated nodes in each network (white circles), together with a confidence interval of width 2σ. The connectivity dis-tance is chosen as r= 0.35.
x
y
z
(a)
x
y
z
[image:11.612.145.473.119.240.2](b)
Figure 5. Heat maps indicating the dependence of ac-tivation dynamics on the initial acac-tivation site. The colours of each region indicate the time to full network activation, t∗, associated with initial activation in that region (colour online). Panels (a) and (b) show rotated views; in each caser = 0.5.
dependence on activation progression on initiation site are pertinent to observations in epilepsy, as not all brain regions have the same proba-bility of being starting points for seizures. We remark, however, that the concept of a specific focal point of seizure origin from which seizure activity spreads (due to local abnormal connectivity) has been criti-cised (see e.g. [36]), and alternative hypotheses presented [37, 38]. We do not discuss this further as our focus here is on the global network structure imparted by the rat cortex embedding and its effect on acti-vation propagation.
initiation and progression (in particular, those highlighting the impor-tance of the site of initiation within the network) are not well-captured by such approaches.
4. Discussion
In this paper, we have investigated numerically the influence of the structure of a spatially-embedded complex network on the dynamics of the processes which occur upon it, with application to the development of improved theoretical models of the progression of epileptic seizures and spreading depression over the cortical surface.
The key feature of this work is that we employ neuroimaging data from the left hemisphere of a rat brain to define a neural network whose spatial embedding represents accurately the structure of the cortical surface. Typically, theoretical studies of neural network dynamics em-ploy uniform lattices or random graphs in 1D or 2D: their focus being on in-depth analysis of various theoretical connectivity rules (e.g.small world or scale-free networks) or signalling processes on the network dy-namics. Here, we define connectivity within our cortical network by a simple criterion based on Euclidean distance (modified to account for the folded cortical structure), and employ a basic spreading rule to govern the propagation of activation. In this way, we highlight clearly the influence of physiologically-relevant network structure on seizure dynamics, in isolation.
activity initiation: a dramatic spread in the number of time-steps re-quired to achieve full network activation is observed in the rat network, even in the case of a highly-connected network (r= 0.5,hdrati= 37.36).
Small variation is observed in the random graph; the dynamics on the lattice graph is independent of initiation site. For less well-connected random graphs (r = 0.35, hdrandi = 16.09), the variation is increased;
however, the differences between all three networks remain significant (data not included). Moreover, our simulations highlight that, across the parameter range investigated here, different initial activation sites lead to approximately a 1.7-fold reduction in full-network activation time, due to variation in connectivity across these regions.
We remark that epileptic seizure events are extremely rare in wild-type rodents, and characteristics of epileptic activity in animal models can differ from those observed in humans [35]. However, our initial study employing a network based upon the cortex of a healthy rat has highlighted the potential importance of geometric structure in ac-tivation dynamics; similar investigations in a network whose spatial embedding represents the convoluted human cortical surface therefore forms important ongoing work. In addition, future work will investigate how our predictions are altered under (i) a signal transmission model which represents more accurately the behaviour a neural unit and (ii) the introduction of long-range connections representing white-matter structural connectivity.
Acknowledgements
M. Kaiser was supported by the WCU program through the KOSEF funded by the MEST (R31-10089), EPSRC (EP/G03950X/1), and the CARMEN e-science project (http://www.carmen.org.uk) funded by EPSRC (EP/E002331/1).
References
[1] Newman, M. E. J. 2010Networks: an Introduction.Oxford University Press [2] Erd˝os, P. & R´enyi, A. 1956 On Random Graphs.Publ. Math.6: 290–297 [3] Watts, D. J. & Strogatz, S. H. 1998 Collective dynamics of ‘small world’
networks.Nature 393: 440–442
[4] Barabasi, A. L. & Albert, R. 1999 Emergence of scaling in random networks.
Science 286: 509–512
[5] Arenas, A., D´ıaz-Guilera, D., Kurths, J., Moreno, Y. & Zhou, C. 2008 Syn-chronization in complex networks.Phys. Rep. 469: 93–153
[6] Barrat, A., Barth´elemy, M. & Vespignani, A. 2008Dynamical processes on complex networks.Cambridge University Press
[7] Sporns, O. 2010Networks of the Brain.The MIT Press
[8] Fisher, R.S., Boas, W.E., Blume, W., Elger, C., Genton, P., Lee, P. & Engel Jr, J. 2005 Epileptic seizures and epilepsy: definitions proposed by the Inter-national League Against Epilepsy (ILAE) and the InterInter-national Bureau for Epilepsy (IBE). Epilepsia 46(4): 470–472
[9] DeVille, R. & Peskin, C. 2012 Synchrony and asynchrony for neuronal dy-namics defined on complex networks.Bull. Math. Biol.74(4): 769–802 [10] Kaiser, M. & Hiletag, C. 2010 Optimal hierarchical modular topologies for
producing limited sustained activation of neural networks.Frontiers in Neu-roinformatics 4(8) (doi: 10.3389/fninf.2010.00008)
[12] K¨otter, R. & Sommer, F. T. 2000 Global relationship between anatomical connectivity and activity propagation in the cerebral cortex.Phil. Trans. R. Soc. B, 355: 127–134
[13] Roxin, A., Riecke, H. & Solla, S.A. 2004 Self-sustained activity in a small-world network of excitable neurons.Phys. Rev. Lett.92(19): 198101
[14] Kramer, M. A., Eden, U. T., Kolaczyk, E. D., Zepeda, R., Eskandar, E. N. & Cash, S. S. 2010 Coalescence and fragmentation of cortical networks during focal seizures.J. Neurosci.30(30): 10076-10085
[15] Newman, M.E.J. 2005 Power laws, Pareto distributions and Zipf’s law. Con-temporary physics 46(5): 323–351
[16] Comin, C., Batista, J. L. B., Costa, L. da F., Traven¸colo, B. A. N. & Kaiser, M. 2012 Linking network structure and transient and equilibrium integrate-and-fire dynamics.Int. J. Bifurcat. Chaos (In Press)
[17] Netoff, T.I., Clewley, R., Arno, S., Keck, T. & White, J.A. 2004 Epilepsy in small-world networks.J. Neurosci.24(37): 8075–8083
[18] Bath´elemy, M. 2011 Spatial Networks. Phys. Rep.499: 1–101
[19] Sotero R.C., Trujillo-Barreto N.J., Iturria-Medina Y., Carbonell F. & Jimenez J.C. 2007 Realistically coupled neural mass models can generate EEG rhythms.Neural Computat.19(2): 478–512
[20] Taylor P.N., Goodfellow M., Wang Y. & Baier G. Towards a large-scale model of patient-specific epileptic spike-wave discharges. Biol. Cybern. DOI 10.1007/s00422-012-0534-2
[21] Goodfellow, M., Schindler, K. & Baier, G. 2012 Self-organised transients in a neural mass model of epileptogenic tissue dynamics. NeuroImage 59: 2644– 2660
[22] Netoff, T. I., Clewley, R., Arno, S., Keck, T. & White, J. A. 2004 Epilepsy in small-world networks.Neurobiol. Dis.24(37): 8075–8083
[23] Rothkegal, A. & Lehnertz, K. 2009 Multistability, local pattern formation, and global collective firing in a small-world network of nonleaky integrate-and-fire neurons.Chaos 19: 015109
[24] Kaiser, M. 2011 A tutorial in connectome analysis: Topological and spatial features of brain networks.NeuroImage 57: 892–907
[25] Winfree, A.T. 1994 Persistent tangled vortex rings in generic excitable media.
Nature 371(6494): 233–236
[26] Kim J.W., Roberts J.A. & Robinson P.A. 2009 Dynamics of epileptic seizures: evolution, spreading, and suppression.J. Theor. Biol.257(4): 527–32 [27] Traub, R.D., Duncan, R., Russell, A.J.C., Baldeweg, T., Tu, Y.,
Cunning-ham, M.O. & Whittington, M.A. 2010 Spatiotemporal patterns of electrocor-ticographic very fast oscillations (>80 Hz) consistent with a network model based on electrical coupling between principal neurons.Epilepsia51(1): 1587– 2597
[28] Wiener, N. & Rosenbluth, N. 1946 The mathematical formulation of the prob-lem of conduction of impulses in a network of connected excitable eprob-lements, specifically in cardiac muscle. Arch. Inst. Cardiol. Mex.16: 205–265
[30] Dahlem, M. A., Schneider, F. M. & Scholl, E. 2008 Efficient control of tran-sient wave forms to prevent spreading depolarizations.J. Theor. Biol.251(2): 202–209
[31] Costa, L. da F., Rodrigues, F. A., Travieso, G. & Villas Boas, P. R. 2007 Characterization of complex networks: A survey of measurements.Adv. Phys.
56(1): 167–242
[32] Van Essen, D. C. 2012 Cortical cartography and Caret software.NeuroImage
62(2): 757–764
[33] Penrose, M. 2005 Geometric Random Graphs.Oxford University Press [34] Dall, J. & Christensen, M. 2002 Random geometric graphs. Physical Review
E 66: 016121
[35] Roopun, A. K., Simonotto, J. D., Pierce, M. L., Jenkins, A., Nicholson, C., Schofield, I. S., Whittaker, R. G., Kaiser, M., Whittington, M. A., Traub, R. D. & Cunningham, M. O. 2010 A nonsynaptic mechanism underlying interictal discharges in human epileptic neocortex.Proc. Natl. Acad. Sci. USA
107(1): 338–343
[36] Spencer, S. S. 2002 Neural networks in human epilepsy: evidence of and implications for treatment. Epilepsia 43(3): 219–227
[37] Stead, M., Bower, M., Brinkmann, B.H., Lee, K., Marsh, W.R., Meyer, F.B., Litt, B., Van Gompel, J. & Worrell, G.A. 2010 Microseizures and the spa-tiotemporal scales of human partial epilepsy.Brain 133(9): 2789–2797 [38] Goodfellow, M., Taylor, P.N., Wang, Y., Garry, D.J. & Baier, G. 2012
Mod-elling the role of tissue heterogeneity in epileptic rhythms.Eur. J. Neurosci.
36(2): 2178–2187
[39] Eguiluz, V. M., Chialvo, D. R., Cecchi, G. A., Baliki, M. & Apkarian, A. V. 2005 Scale-free brain functional networks.Phys. Rev. Lett.94(1): 018102 [40] Achard, S., Salvador, R., Whitcher, B., Suckling, J. & Bullmore, E. 2006
A resilient, low-frequency, small-world human brain functional network with highly connected association cortical hubs.J. Neurosci.26(1): 63–72 [41] Sporns, O., Honey, C. J. & K¨otter, R. 2007 Identification and classification
of hubs in brain networks.PLoS ONE 2(10): e1049
[42] Kaiser, M., Martin, R., Andras, P. & Young, M. P. 2007 Simulation of robust-ness against lesions of cortical networks.Eur. J. Neurosci.25(10): 3185–3192 [43] Zamora-Lopez, G., Zhou, C. & Kurths, J. 2010 Cortical hubs form a mod-ule for multisensory integration on top of the hierarchy of cortical networks.
Front. Neuroinform.4: 1 (doi: 10.3389/neuro.11.001.2010)
1
School of Science and Technology, Nottingham Trent University, Nottingham, NG11 8NS, UK
2
School of Computing Science, Newcastle University, Newcastle upon Tyne, NE1 7RU, UK
3
Institute of Neuroscience, Newcastle University, Newcastle upon Tyne, NE2 4HH, UK
4