Recommending rides:
Psychometric profiling in the theme park
Stefan Rennick Egglestone
1, Amanda Whitbrook
2, Julie Greensmith
1, Brendan Walker
3, Steve
Benford
1, Joe Marshall
1, David Kirk
1, Holger Schnädelbach
1, Ainoje Irune
1, Duncan Rowland
1School of Computer Science University of Nottingham
Jubilee Campus Wollaton Rd. Nottingham, NG8 1BB
{sre,jqg,sdb,jqm,dsk,hms,
aai,dar}@cs.nott.ac.uk
BAE Systems
Systems Engineering Innovation Ctr. Loughborough University
Holywell Park Loughborough, LE11 3TU
[email protected]
Aerial 42 Murchison Rd.
London E10 6NB
[email protected]
ABSTRACT
This paper presents a study intended to inform the design of a recommender system for theme park rides. It examines the efficacy of psychometric testing for profiling theme park visitors, with the aim of establishing a set of measures to be included in a visitor profile intended for use in a collaborative recommender system. Results presented in this paper highlight the predictive value of a number of psychometric measures, including two drawn from the ―Big Five‖ personality inventory, and one drawn from the ―Sensation Seeking Scale‖. The paper discusses general research challenges associated with the integration of psychometric testing into recommender systems, and describes planned future work on a theme park recommender system.
Categories and Subject Descriptors
H.3.3 [System and Software]: User profiles and alert services
1.
INTRODUCTION
Theme parks are an important form of entertainment, with a long history and a substantial economic impact [16]. Walt Disney Attractions, the largest theme park group in the world, catered for more than 116.5 million visitors worldwide in 2007, while Merlin Entertainment, the second largest, catered for 32.1 million [19]. Visitors arriving at a theme park are faced with a bewildering array of attractions, typically many more than they can experience in the limited time available, and so picking the right ones becomes a critical choice. While some information is available to guide visitors, including basic ratings provided by the park as well as external review websites, there is currently little attempt to personalize this to individual preferences or personalities.
The core question addressed by this paper is therefore: what kind of personal profiling information can help predict a good ride experience? The answer could help us personalize entertainment experiences and inform the design of ‗recommender systems‘ [1,14], a technology already of interest to the wider leisure sector [3,4,5]. Our long term challenge is therefore the construction of a theme park recommender system, especially for new visitors who lack the knowledge required to optimize their choices. There are a number of factors which might be considered when implementing
such a system. Firstly, time is a limited resource for many visitors, and needs to be distributed among a number of rides, many of which might have large queues. Secondly, new visitors require recommendations for rides that suit their personal tastes and tolerances; a poor choice may lead to either an uncomfortable experience, or one that is disappointingly tame. While repeat visitors are likely to know a particular theme park better, they may require recommendations that provide variety, or which reflect changing tastes and capabilities as they mature (especially for younger riders). Finally, a new generation of robotic rides allow for a large number of different programs to be run on just one physical device [15], thereby effectively increasing the ride count in a park, and also increasing the choice available to visitors.
Given these factors, we can argue that a complete solution would require a hybrid approach [1], with the capability of integrating a variety of different types of information gathered from the park and its visitors. At the core of such a system, however, might be the ability to generate a set of collaborative recommendations for visitors (or groups of visitors). Implementing the collaborative component of such a system requires the definition of a metric to be used to identify previous visitors who were similar, and a common approach within recommender systems research for calculating such a metric is the construction of profiles for users of such systems. In the context of the theme park, however, an open question is the composition of such a profile. What information should we record for each visitor to allow the generation of a set of recommendations?
Anecdotal observations, from several years of working with ride designers, operators and the public in this setting (see [16] for an example) suggest that personality is a key predictor for ride choice, which has led us to the hypothesis that measures of personality should be included in profiles for a theme park recommender system. This paper presents an evaluation of this hypothesis, through an investigation into the efficacy of two commonly-used psychometric measures of personality. Through an analysis of data collected during a study at a major theme park, we present results that highlight the predictive power of psychometric testing for ride experience, and demonstrate how these results can be used to identify similarities and differences between riders. More broadly, we discuss the relevance of psychometric profiling to recommender systems research, and the challenges involved in utilizing psychometric data.
2.
DATA COLLECTION METHODOLOGY
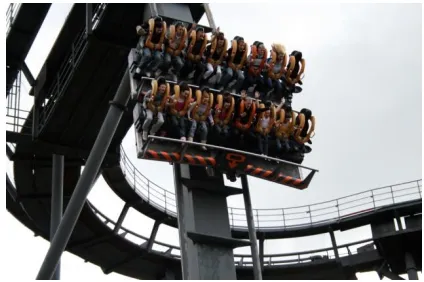
The study presented in this paper took place in the summer of 2007, at Alton Towers, a theme park in the UK [2]. The ride was Oblivion, an iconic coaster featuring a near-vertical drop into an underground tunnel, which is shown in figure 1 below. 72 healthy participants aged between 16 and 70 were recruited for this study, through emails circulated to a variety of organizations and local media, and were then split into 9 groups of 8 riders, each of whom was allocated a unique identifier (ID). Each group was also allocated an arrival time for their session, and a carefully scheduled set of activities to take place in the session. Of the 72 volunteers, 59 actually arrived at the park and took part. This meant that not all groups had their full complement of 8 riders.
For all groups, their session at the park began with an introductory talk, which described its content and purpose. Following this talk, participants were provided with paper consent form, which detailed the data to be collected during the session, and the research purposes for which it was to be used. Signed consent forms were collected by staff, and placed into cardboard dossiers, which had been labeled with the pre-allocated IDs. These were used throughout the event to collate information provided by participants. To guard against identity confusion, participants were asked to hold a board onto which their ID had been written, and were then photographed. In addition, all paper forms generated during the event were labeled with the allocated IDs.
Following on from these initial activities, participants were taken to a quiet area, and were provided with a set of paper forms designed to collect information to form their personal profile. The content of these forms is described in section 2.1 below. Participants were then taken to Oblivion, and allowed to experience one ride each, during which a set of video, audio and physiological data reflecting their experience was captured using a set of wearable equipment constructed by the authors. Data collected during this phase of the event is not relevant to this paper. After this equipment was removed, participants were provided with a second set of paper forms which they used to quantify their experience. The content of these forms is described in section 2.2 below.
[image:2.612.67.279.543.684.2]After the event, all information collated in the dossier was manually entered into a database, and was cross-checked. During this process, three profiles were found to be incomplete and were discarded. The analysis presented in this paper therefore focuses on data from the remaining 56 participants.
Figure 1 Vertical drop on Oblivion
2.1
Profiling information collected
Profiling data collected using the initial set of paper forms defines a set of descriptive dimensions for each participant. The process of choosing these dimensions involved discussions with professional psychologists, ride enthusiast groups and the direct experience of one of the authors as a professional ride designer. Our focus in constructing this profile was on selecting appropriate psychometric measures of personality, but we also included certain demographic factors, namely age, gender and ride_count. The latter was an estimate of the number of times that each participant had previously ridden Oblivion.
In terms of psychometric profiling, our chosen psychometric measures were the Big Five [8] and the Sensation Seeking Scale [21]. These are two contrasting tests, both of which have an extensive history of use in psychological research, and both of which are applicable in the context of the theme park. Of these, the Big Five is more general-purpose, and attempts to categorise participants on five, orthogonal personality dimensions, namely:
Extraversion, Agreeableness, Conscientiousness, Neuroticism and
Openness to Experience. In comparison, the Sensation Seeking Scale is more specifically-focused on an assessment of sensation-seeking aspects of individual personality, and categorises participants on four orthogonal dimensions: Thrill Seeking,
Experience Seeking, Disinhibition and Boredom Susceptibility. For both, participants are allocated a score between 0 and 10 on each dimension, which is calculated through the application of a standardised algorithm, operating on answers to a set of questions, which were provided to participants on paper sheets. During the data capture process, scores on personality dimensions were always calculated and cross-checked by researchers with previous research expertise in the use of these two tests.
2.2
Ride experience information collected
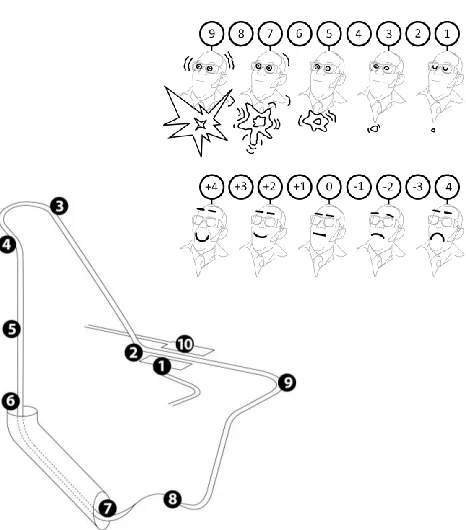
To allow participants to quantify their experience on Oblivion in a consistent way, we provided them with paper copies of an abstract map of Oblivion, through which an experienced ride designer had identified ten key points. This map is shown on figure 2 on the following page, and identified points are: waiting on the ride; at the bottom of the climb; at the top of the climb; hanging over the drop; during the drop; entering the tunnel; exiting the tunnel; the final bump; and approaching the station. For each point, participants were asked to quantify their emotional response by supplying two numbers, one defined by a dimension of arousal, and another by a dimension of valence. In this context, arousal
Figure 2 Ride map (main) and SAM (insert)
3.
DATA ANALYSIS
In analysing the profiling and ride experience data that was collected, our approach has been to investigate whether profiling, performed in advance of a ride, could be used to divide participants into groups who report statistically different experiences on the rides. Our findings, presented below, indicate that it can, and we discuss these results, and their implications for a ride recommender system, later in this paper. Firstly, however, we present the data that we have gathered, and the analysis that we have performed on it. This procedure consists of three items of work.
Firstly, in section 3.1, we provide a set of descriptive statistics which have been calculated from our data. Since there was no attempt to control the composition of this sample, these descriptives provide some evidence to help us understand the generalisability of our findings. In addition, certain features of these distributions have implications for our analysis procedures; in particular, evidence for a lack of normality in variables requires the use of non-parametric statistics in analyses
Secondly, in section 3.2, we illustrate the use of Spearman rank correlation, a non-parametric correlation tool, to search for linear relationships between variables defined by our profiling dimensions and variables defined by ride experience data (the
DVs). Through our use of this procedure, we identify four candidate dimensions for inclusion in a similarity metric, three of which have been drawn from the psychometric tests, and one of which has been drawn from demographic data.
Finally, in section 3.3, we present an exploration into the use of a k-means clustering algorithm to group participants using various combinations of these dimensions. In order to compare the ride experiences of participants in these groups, we employ the Kruskall-Wallis test, a non-parametric equivalent of ANOVA, to search for statistically significant differences in experience as indicated by self-report. Through our use of this test, we present
evidence that grouping participants based upon our candidate dimensions produces groups with a significantly different ride experience, which suggests that assessment against those dimensions is a useful procedure when calculating a similarity metric for a future recommender system.
3.1
Descriptive statistics
The following subsection summarizes descriptive statistics for the 56 participants on a number of variables defined from the profiling tools, and from ride experience data. For each variable in the profiling tool, data is presented to indicate its minimum (Mn), maximum (Mx), average (Av), spread (Sp), skew (Sk) and kurtosis (K). The table also includes a p-value calculated by applying the Shapiro-Wilks test, which is used to test for normality in data. For each dimension, if this test indicates a non-normal distribution of data (indicated by a p-value of less than 0.05), then the median and inter-quartile range have been used as measures of average and spread. If, however, there is no evidence for non-normality, then mean and standard deviation are used instead.
3.1.1
Descriptives for the demographic dimensions
Of the 56 participants involved in this analysis, 35 were male, and 21 were female. In addition, Table 1 summarizes descriptive statistics for the distribution of data on the variables age and ride_count. Application of the Shapiro-Wilks test provides evidence for non-normality on both of these dimensions. In both cases, this seems to have been caused by a positive skew (i.e. a greater proportion of our sample tends towards the lower end of each dimension).
Table 1 Descriptive Statistics for demographic data
Variable Mn Mx Av Sp Sk K p
Age 16 68 23.0 9 2.3 6.4 0.00
ride_count 0 200 10.0 55 1.75 2.32 0.00
3.1.2
Descriptives for the Big Five
[image:3.612.321.555.573.662.2]Table 2 below presents descriptive data for the dimensions defined by the Big Five personality inventory. As indicated in Section 3.1 above, data items for these variables are calculated from answers to a standardized questionnaire, and always lie between 0 and 10. The only variable for which there is evidence of non-normality is in Conscientiousness, a dimension which in our sample appears to be negatively skewed. We have not been able to find comparative data for the whole UK population.
Table 2 Descriptive Statistics for the Big Five
Variable Mn Mx Av Sp Sk K p
Extraversion 3.7 6.8 5.2 0.8 0.0 -1.0 0.08
Agreeableness 4.1 7.0 5.5 0.7 0.1 -0.9 0.27
Conscientio -usness
1.8 6.7 5.1 1.1 -1.1 -0.9 0.00
Openness 4.0 6.8 5.4 0.8 -0.1 -1.0 0.17
Neuroticism 2.7 6.9 4.6 0.9 -0.2 0.2 0.16
3.1.3
Descriptives for the Sensation Seeking Scale
with the Big Five, values for each dimension lie between 0 and 10. Use of the Shapiro-Wilks test shows that the Thrill_seeking,
Experience_seeking and Disinhibition dimensions are not normally distributed, and the descriptive statistics show that there is a negative skew (i.e. more participants provide values towards the top end of these scales). These results bear similarities to other groups that might commonly be labeled as sensation seeking, as reported in previous research [21].
Table 3 Descriptives for the Sensation Seeking Scale
Mn Mx Av Sp Sk K p
Thrill_ seeking
2 10 8.0 4.0 -0.5 -0.8 0.00
Experience_ seeking
2 10 6.0 3.0 -0.2 -0.8 0.03
Disinhibition 1 10 7.0 4.0 -0.4 -0.8 0.01
Bordem_ susceptibility
0 9 4.0 3.0 0.3 -0.4 0.08
3.1.4
Descriptives for self-reported experience data
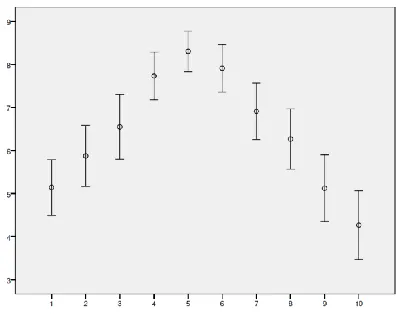
Figure 2 below plots a graph of participant reports of arousal. This consists of mean values at each of the 10 points on the ride defined in Figure 1, along with error bars defined by a 99% confidence interval. This is another measure of spread; it indicates the range within which 99% of the population that the sample has been drawn from would be expected to fall. The graph shows that the average participant reported a peak of arousal during the drop (point 5), and felt less aroused at the end of the ride (point 10) than at the start (point 1). There is, however, a significant spread in this data, especially for points near the start and end of the ride, indicating that participants are reporting a variety of different emotional experiences during the ride.
[image:4.612.333.536.69.248.2] [image:4.612.71.272.524.684.2]Similarly, Figure 3 below plots a graph of participant reports of valence, plotted with 99% confidence intervals. Key observations here are that the average participant felt most negative whilst waiting for the drop (point 4), and most positive at its end (point 7). However, point 4 features the largest spread in data, which once again indicates that people had very different experiences at some points (although by point 7, the spread was much smaller).
Figure 3 Self-report of arousal for all ten ride points x-axis: point on ride y-axis: self-report of arousal
Figure 4 Self-report of valence for all ten ride points x-axis: point on ride y-axis: self-report of valence
3.2
Correlation analysis
Having summarized our data, we now explore the relationship between the user‘s profiles and their self-reported experiences. For this we use Spearman rank correlation analysis to highlight potential linear relationships between IVs (the dimensions from our profiling tool) and DVs (the self-reported values of arousal and valence at various stages during the ride). Spearman rank correlation is designed to be applicable both to normally and non-normally distributed data and it produces two values; r (with range -1 to 1) and p (with range 0 to 1). The magnitude of r
represents the quality of correlation or the strength of the relationship between the two variables, and p represents the probability that the relationship is caused by random variation in the data. A significance level of p=0.01 is chosen here in order to highlight only those correlations that are indicative of particularly significant relationships. This represents a more rigorous level of significance than the more commonly used level of p=0.05, a choice which is important when a large number of correlations are calculated. Since a stringent significance level is used and this is an exploratory study, we have opted to consider relatively small r
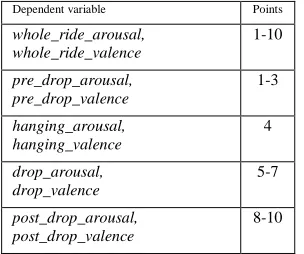
values (i.e. ones in the range 0.1 to 0.3) as being potentially interesting for further consideration. Note that for the purposes of correlation, numerical values of 0 and 1 were assigned to the male and female categories of the gender variable respectively. Following preliminary analysis and discussions about the ride experience, we decided that collapsing the ten experience sample points along the ride into a smaller number of stages would enable a more meaningful and manageable presentation of results. In particular, we identified four key stages of the ride experience:
pre_drop – from being strapped into the seat at the start to having climbed to the top of the ramp (sample points 1 to 3);
hanging – over the drop looking down into the tunnel for several seconds (point 4);
drop – the plummet into and through the tunnel (5 to 7);
post_drop – the climb back up to the station, slowing down and returning to the start (8-10).
been investigated separately. To provide evidence that our ride stages represent distinct elements of the ride experience, we have made use of the Kruskell-Wallis test to analyze both predicted and actual arousal and valence scores at the different ride points and sections. These reveal significant differences, at a 0.01 confidence level, in all cases. This indicates that rider experience does differ significantly for these variables between these points and sections of the ride.
Table 4 Summary of definitions of dependent variables
Dependent variable Points
whole_ride_arousal, whole_ride_valence
1-10
pre_drop_arousal, pre_drop_valence
1-3
hanging_arousal, hanging_valence
4
drop_arousal, drop_valence
5-7
post_drop_arousal, post_drop_valence
[image:5.612.317.561.330.481.2]8-10
Table 5 below summarizes correlations between the DVs that are self-reports of arousal and valence across the whole ride and its four sub-stages, and the IVs gender, age and ride_count. Empty cells indicate correlations that are not significant at the 0.01 level, and are therefore not of interest in this analysis.
An interesting result from this table is that there are few significant correlations for age and gender, although females do appear to feel more negative during the drop than do males. Riders with greater experience of the ride are a little less aroused over the whole ride, feel more positive while waiting to drop, and feel less aroused both during and after the drop. Riders with less experience also feel more positive after the drop; this may be a reflection of a feeling of relief at having ―survived‖ a very intense and possibly fearful experience. These results suggest that
[image:5.612.72.280.539.695.2]ride_count is an interesting variable to include in a profiling tool, as it has an effect on how rides are experienced.
Table 5 Significant correlations for arousal and valence against demographic data
Variable gender age ride_count
whole_ride_arousal - - -0.191
pre_drop_arousal - - -
hanging_arousal - - -
drop_arousal - - -0.309
post_drop_arousal - - -0.287
whole_ride_valence -0.149 - -
pre_drop_valence - - -
hanging_valence - - 0.359
drop_valence -0.303 - -
post_drop_valence - - -0.275
3.2.1
Correlations with dimensions in the personality
inventories
Table 6 below summarizes results for dimensions in the two personality inventories, and again, empty cells indicate a lack of a significant correlation. Dimensions showing no correlations are also omitted from the table for brevity.
The only dimensions showing significant correlations here are
Extraversion, Openness and Thrill_seeking. These exhibit some interesting relationships, which seem to fit with previous observations of rider behaviour. In particular, extroverts (who may be more likely to enjoy expressing themselves loudly during their ride experience) tend to feel more positive throughout the whole ride, while building up to the drop, and during the drop, whilst those who are open to experience are likely to feel more aroused and positive by the whole ride, more aroused during the drop, and more positive at the end of the ride. Equally, thrill seekers tend to feel less aroused across the whole ride, and also during the build up to the drop. This reflects previous research, which suggests that thrill seekers need more sensory input to generate the same level of arousal during an experience [21].
Table 6 Significant correlations for arousal against dimensions in personality inventories
Variable Extraversion Openness Thrill_seeking
whole_ride_arousal - 0.118 -0.142
pre_drop_arousal - - -0.239
hanging_arousal - - -
drop_arousal - 0.211 -
post_drop_arousal - - -
whole_ride_valence 0.239 0.113 -
pre_drop_valence 0.302 - 0.240
hanging_valence - - -
drop_valence 0.233 - -
post_drop_valence - 0.233 -
3.3
Cluster analysis
The correlation analysis in the previous sub-section identified
ride_count, extraversion, openness and thrill_seeking as candidate dimensions to predict ride experience. The next step in our analysis is to use cluster analysis to explore the extent to which these dimensions can be used to group participants as a basis for the collaborative generation of recommendations. Our method is to use these dimensions to cluster participants into groups, and then to search for evidence of differences in ride experience between the memberships of these groups. Our chosen clustering algorithm is k-means, as implemented by SPSS version 15.0 for Windows [16]. This algorithm uses Euclidean distance to evaluate group membership for clusters leading us to scale the ride_count
The relative contribution of each dimension to a particular clustering can be evaluated through use of an F-value, as provided by SPSS. Initial clustering of participants relative to all four dimensions produced a clustering which was always dominated by the ride_count and thrill_seeking dimensions, regardless of the choice of how many clusters to split the data into. Table 7 below provides an illustrative example, which cites F-values generated when a target of 3 clusters was chosen.
Table 7 F-values for initial clustering
Ride_count Thrill_seeking Extraversion Openness
47.1 44.6 1.9 2.2
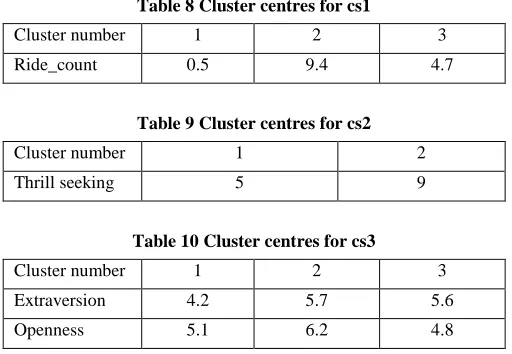
[image:6.612.47.303.336.513.2]The next step was to split the set of dimensions into three subsets for further exploration, and to generate a clustering for each. Of these, cluster set 1 (cs1) is generated using ride_count, cluster set 2 (cs2) is generated using thrill_seeking, and cluster set 3 (cs3) is generated in relation to extraversion and openness. Tables 8, 9 and 10 below present details of cluster centres for each. In each case, a subjective choice has been made as to the most ―natural‖ number of clusters to split the data into.
Table 8 Cluster centres for cs1
Cluster number 1 2 3
Ride_count 0.5 9.4 4.7
Table 9 Cluster centres for cs2
Cluster number 1 2
Thrill seeking 5 9
Table 10 Cluster centres for cs3
Cluster number 1 2 3
Extraversion 4.2 5.7 5.6
Openness 5.1 6.2 4.8
For these three sets of clusterings of participants, the Kruskall-Wallis test was then used to examine the statistical significance of any difference in ride experience between the membership of the clusters in the set, in relation to the variables that have been defined from arousal and valence data, as listed in table 4. Using a significance level of 0.05, table 11 below now summarizes the results of the application of this test. Blank cells indicate a test result that was not significant, whilst in other cells, the p-value calculated by Kruskal-Wallis has been included. Data in this table shows that, of the tests that were carried out as part of this process, only eight failed to indicate significance. This provides substantial evidence that, in the case of this group of participants, assessing participants against the ride_count, thrill_seeking,
extraversion and openness dimensions provides an effective method for generating groupings of riders who will report a similar experience on Oblivion.
Table 11 Results of Kruskall-Wallis test
cs1 cs2 cs3
whole_ride_arousal 0.000 0.003 0.007
pre_drop_arousal 0.040 0.001
hanging_arousal 0.005
drop_arousal 0.003 0.017 0.003
post_drop_arousal 0.003 0.004
whole_ride_valence 0.000 0.005 0.000
pre_drop_valence 0.000 0.000
hanging_valence 0.025 0.029
drop_valence 0.001 0.001
post_drop_valence 0.009 0.006
4.
DISCUSSION
Analysis presented in section 3 has provided evidence that psychometric profiles, captured in advance, can be used to generate groupings of riders who will report a significantly different experience. This section now provides an evaluation of the methodology and evidence that has featured in this paper. We also discuss more general issues in relation to the use of psychometric profiling in recommender systems research, and then conclude with a statement of future research required to produce an effective theme park recommender system.
4.1
Evaluation of study methodology
4.1.1
Selection of participants
The study presented in this paper has involved the analysis of data collected from 72 volunteers. Because we engaged with local media, then a significant number of people had the chance to take part, raising our chance of achieving a reasonably fair sampling from the local population. However, there are a number of sources of sampling error that may have influenced our results. In particular, participants were selected on a first-come, first-served basis, and the study took place across three week days. In both of these cases, we wonder if our sampling procedure may have produced a bias towards participants who were already theme park enthusiasts, as such individuals may have been more likely to apply for such a study, and to be prepared to take a holiday from work to take part. There may be some evidence for this in the demographic data supplied in section 3.1 above - for example, the average number of previous rides on Oblivion is 10.0, which seems quite high. If this is the case, then further studies, with participants who were less experienced in the theme park may provide better evidence for the use of profiling in this context.
4.1.2
Use of correlation to identify variables
experience at the park, a situation which may not be desirable. We wonder, therefore, how to optimize the selection of dimensions for a future profiling tool and suggest this as a question for further research.
4.1.3
The need to consider more rides
Data collected through this study has been used to highlight the efficacy of psychometric testing in predicting experience on one ride – Oblivion. However, further useful evidence on this topic would be provided through a similar study that investigated relationships between profiling and experience on multiple rides. In particular, it would be interesting to consider rides that are very different to Oblivion. We wonder whether such a study would illustrate different relationships between profiling dimensions and ride experiences, thereby allowing the clustering model presented in this paper to be extended.
4.1.4
Limitations on the use of self-report to capture
ride experience
Throughout the study described in this paper, we have chosen to use self-reports, made immediately after the ride, as a means of quantifying ride experience. Interviews with participants have suggested that, for them, this was a comprehensible and rational choice. However, there are a number of open issues around the use of such self-report data in this context. In particular, it is possible that deficits in the human capacity for memory for such an intense experience may mean that such self-reports are not fully accurate representations of the actual experience that individuals experienced.
We are currently actively investigating alternatives to self-report in assessing individual experience, using some of the other channels of data that were collected during the study which has featured in this paper. Candidates include physiological responses to the ride, patterns of eye movement, vocalizations (such as screaming, swearing, or staying unusually quiet), or potentially some composite of all of these measures. Future publications will feature a comparison between these different measures, which will therefore inform future developments in these areas.
4.2
Psychometric profiling for recommender
systems
Although the primary contribution of this paper is a proof-of-concept study for a theme park recommender system, a secondary contribution is the provision of evidence for the efficacy of psychometric procedures in recommender systems research. Because psychometric testing has been designed to provide a direct quantification of personality, and because so many of the decisions that we make are influenced by our personality, rather than just our demographic identify, the authors believe that, in some cases, the inclusion of psychometric information in profiles could be a useful technique to aid the development of future recommender systems. There are however, a number of issues to consider when using psychometric testing in this way, and this section now provides a brief overview.
Firstly, psychometric testing procedures tend to require a substantial amount of information to be provided by a participant. In the case of the Big 5 personality inventory, for example, a total of 44 questions were asked, each of which required the provision of a numerical answer. There are many other personality inventories with a larger question count, although there are also more specialized inventories with a smaller count. In specific cases, studies such as the one provided in this paper could seek to
minimize the number of questions required through an analysis which seeks to identify those dimensions which are most relevant, but it may well be the case that psychometric personality testing is only useful for systems that recommend high-value items, where a participant is prepared to invest time to get the best recommendation. The authors believe that the theme park is a good example of such a setting, given the high cost and limited time involved in a theme park visit. Another interesting example is provided by the adoption of personality testing techniques by a number of on-line dating services, in which this technique has been deployed to allow automatic recommendations of potential life-partners for a subscriber. Examples of UK-orientated services that make use of personality testing include Parship [12], MatchAffinity [11] an eHarmony [6]. Each of these features a lengthy questionnaire, answers from which are then used in a proprietary algorithm to generate a recommendation for other users for the user to contact.
Beyond issues of the amount of time that users need to invest to generate a psychometric profile, however, there is a secondary issue; evidence from large, global studies has indicated that the results of psychometric tests can be culturally specific. An example of this situation is provided through research into 5-dimensional models of personality, of which the Big Five, deployed in research presented in this paper, is one example. Studies have shown that a 5-dimensional model of personality is the most effective across most of the world‘s population, but that, for certain populations, a factor with a different number of dimensions is more effective [18]. This observation, though not fully understood, has been repeated across a number of large, global studies, and therefore seems to be reliable. The implication for the use of psychometric testing methods in recommender systems research is therefore that care must be taken in the selection of tests, and that validation work must be carried out within the population for which a particular recommender system is intended.
5.
CONCLUSIONS AND FURTHER WORK
This paper has presented evidence that psychometric personality profiling can be used to identify groups of individuals who will report a similar experience on a ride. Beyond this initial study, further work will be required to allow the construction of a theme park recommender system. Extensions to increase the scope of this particular study have been presented in section 4.1 of this paper. In the remainder of this paper, however, we want to suggest three challenging areas that would need to be considered if such a system were to be actively constructed.
Generating recommendations for groups
Discussions with management at Alton Towers indicate that the vast majority of guests at theme park arrive in groups, which suggests the need for a system whose recommendations integrate across the personalities and demographics of group members. The development of a collaborative ride recommender system for groups is an interesting challenge, and one which could build on previous research within the field [13]. The authors believe that the construction of such a system might require further sociological research into the nature of group behaviour in the theme park, which may then inform future study design.
Generating recommendations for collections
to a set of observations by Hansen and Golbeck [7], which highlight the need to generate collections that provide a coherent experience. Hansen and Golbeck provide the example of a mix-tape (or compilation mix-tape), and argue that, above and beyond the individual value of tracks in such a selection, the composition of such a mix depends upon at least two further constraints, which they label co-occurrence interaction effects and order interaction effects. Co-occurrence interaction effects take place when a number of songs sound particularly good together and therefore take on a value which is greater than the sum of the values of the individual tracks. Order interaction effects take place when a particular song has a value at a particular place in a playlist (for example, to start off the collection in an energetic way, or to conclude it in a relaxing way). Based upon these observations, Hansen and Golbeck argue for the development of recommender systems for collections of items and this is an approach which clearly makes sense for a ride recommender system. In particular, we might need to consider the motivation of participants for their day in the park and the physical and mental impact on riders of the extreme nature of theme park rides. The collection effects defined by Hansen and Golbeck and the ride characterizations referred to above suggest we have to consider questions such as:
1. Should we choose to sequence a number of thrilling rides, to provide an experience that is intense as possible, or should we sequence a thrilling ride with a gentler ride that has an interesting theming, in order to highlight the best elements of both types?
2. Should we start the day with a thrilling ride, to get visitors energized for the day, or should we start the day with a gentle ride, to account for them only just having eaten breakfast?
5.1
Integrating with park systems
The development of an effective recommender system for theme park rides would be likely to require an effective integration with existing theme park systems to work well, and a business model that made this possible. An integration with on-line ticketing systems [2] might facilitate the collection of profiling data, and recommendations could be delivered through interactive maps [2] or mobile devices. For a collaborative system, users would need to provide their own assessments of rides, or ride features, and this could be provided through situated displays located near rides. In addition, an intelligent recommendation system might make use of predictions for visitor numbers and queuing durations, potentially provided through existing systems that have been designed to facilitate park management.
6.
ACKNOWLEDGMENTS
This work was supported by the UK EPSRC, through both the Horizon Digital Economy Hub (EP/G065802/1) and the Mixed Reality Laboratory platform award (EP/F03038X/1).
7.
REFERENCES
[1] Adomavicius, G. and Tuzhilin, A. (2005). Towards the next generation of recommender systems: a survey of the state-of-the-art and possible extensions. IEEE Transactions on Knowledge and Data Engineering. 17:6.
[2] Alton Towers corporate website. http://www.altontowers.com/
[3] Brown, B., Chalmers, M., Bell, M., Macoll, I. and Hallm M. (2005). Sharing the square: collaborative leisure on the city streets. Proceedings of ECSW 2005, Paris, France.
[4] Delgado, J. and Davidson, R. (2002). Knowledge bases and user profiling in travel and hospitality recommender systems. Proceedings of ENTER 2002, Innsbruck, Austria.
[5] Duchenaut, N., Partridge, K., Huang, Q., Price, B., Roberts, M., Chi, E.H., Bellotti, V. and Begole, B. (2009). Collaborative filtering is not enough? Experiments with a mixed-model recommender for leisure activities. 17th International conference on user-modelling, adaptation and personalization. Trento, Italy.
[6] eHarmony
http://www.eharmony.co.uk
[7] Hansen, D. and Golbeck, J. (2009). Mixing it up: recommending collections of items. Proceedings of CHI 2009, Boston, MA, USA.
[8] John, O. P., Donahue, E. M., & Kentle, R. L. (1991). The Big Five Inventory—Versions 4a and 54. University of California, Berkeley, Institute of Personality and Social Research..
[9] Lang, P.J. (1980). Behavioral Treatment and Bio-Behavioral Assessment: Computer Applications In Sidowski, J.B., Johnson, H.J. and Williams, T.A. (Eds.) Technology in Mental Health Care Delivery Systems, pp. 119-137.
[10] Larsen, R.J., Diener, E. (1992) Promises and Problems with the Circumplex Model of Emotion. Review of Personality and Social Psychology, No. 13. (pp. 25-59). Sage Publications, Thousand Oaks, CA, USA.
[11] MatchAffinity
http://www.matchaffinity.co.uk
[12] Parship
http://www.parship.co.uk
[13] Recio-Garcia, J.A., Jimenez-Diaz, G., Sanchez-Ruiz, A.A. and Diaz-Agudo, B. (2009). Personality aware recommendations to groups. Proceedings of the third ACM conference on recommender systems. New York, USA.
[14] Resnick, P., Varian. R., Recommender Systems, Communications of the ACM, 40 (3), 56-58, March 1997.
[15] RoboCoaster corporate website http://www.robocoaster.com/
[16] Schnädelbach, H., Rennick Egglestone, S., Reeves, S., Benford, S. and Walker, B. (2008) Performing Thrill: Designing Telemetry Systems and Spectator Interfaces for Amusement Rides. Proceedings of CHI 2008, Florence, Italy
[17] SPSS software http://www.spss.com/
[18] Szirmak, Z., & De Raad, B. (1994). Taxonomy and structure of Hungarian personality traits. European Journal of Personality, 8, 95-117.
[19] The Theme Entertainment Association. (2007). Attraction attendance report. Published at:
http://www.connectingindustry.com/downloads/pwteaerasupp.pdf
[20] Tower Almanac
http://www.towersalmanac.com/