Environment
Internal Visual Learning Lab Report
September 2007
Ben Moss
School of Computer Science and Information Technology
University of Nottingham
[email protected]
Abstract
This report discusses one of the challenges faced in the teaching and learning of introductory com-puter programming. The demographic of students has changed considerably in recent years, and teaching styles must adapt accordingly to suit the change in learning styles. Some of the issues involved in mak-ing these changes are discussed, before introducmak-ing a method for calculating the relative difficultly of a con-cept based on the submission rate and average mark of its exercises. This method was applied to the re-sults of students’ programming exercises throughout a semester to identify one concept area that is particu-larly problematic - Arrays.
A customized visual learning environment for in-teractive animation of programming code was devel-oped, allowing students to visualize code and the af-fects of any changes they make. In addition, a de-ployment wizard was developed to allow a practitioner to integrate the learning environment with their ex-isting learning material with minimal effort. These tools were then used to create a demonstration learn-ing resource targeted towards the concept of Arrays.
1
Introduction
TheProgramming module G51PRG is core to all
undergraduate degree programmes in the School of Computer Science and Information Technology (ap-proximately 150 students per year). Running over two semesters, the first semester provides an intro-duction to programming concepts and the tools used, whereas the second semester focusses more on appli-cation of these concepts in combination with other advanced topics. The module is based around the
Java programming language.
The first semester is divided into eight distinct units that roughly equate to different core concepts, and previously-completed units are typically prereq-uisites for their successors. A major part of the learn-ing and assessment process is a set of weekly program-ming exercises, which are automatically assessed via
the CourseMarker system, based on several criteria
(e.g. functionality, quality, methodology, complete-ness, etc.). Between one and three exercises are set each week, and students are encouraged to work on them in their own time, but assistance is provided by postgraduate demonstrators in weekly lab sessions.
from a wide range of academic departments, includ-ing engineerinclud-ing, humanities and business. The dif-fering backgrounds and expectations in this diverse student group require alternative methods from the classical teaching and learning styles used for intro-ductory programming. This “new breed” of program-ming student tends to struggle with many of the con-cepts which are critical for learning programming, particularly when skills such as spatial awareness and abstraction are involved. Students are often confused by the syntax of the code, which can inhibit and re-move them from the semantics of the exercise’s un-derlying problem.
In a response to the changes in the demographics of programming students, numerous research has in-vestigated problems concerning the visualization of program execution [2]. For example, code syntax can be encapsulated in visual objects to allow stu-dents to concentrate on what the code means (its semantics), rather than how it is represented (its syn-tax). Many institutions use passive visualization in course notes to cover concepts such as arrays, meth-ods and objects by use of single diagrams (statically) or by use of animation (dynamically). However, cre-ating passive teaching resources is time consuming and can be difficult to maintain. Further research has addressed these problems by developing interac-tive methods that can automatically generate dia-grams and animations from samples of program code [1]. This interactive method is typically seen as a time-saving mechanism for the lecturer, but if such mechanisms were presented to the student, then they could be encouraged to develop a deeper understand-ing of topics through experimentation with different aspects of their program code (i.e. they can actu-ally see the affects of adding, deleting, moving and substituting code fragments).
Despite the time-saving capabilities of existing code animation technologies, it is generally under uti-lized in introductory programming modules. Two suggested reasons for the narrow adoption of such visualization software are:
• A lack of dissemination amongst practitioners (i.e. teachers are not aware that such teaching aids exist);
• The typical steep learning curve for practitioners to embed it into their current teaching practices, and for students to use it in their learning pro-cess.
2
Aims and Objectives
The overall aim of this project is to automatically visualize the execution of program code to comple-ment the teaching experience for practitioners of in-troductory programming and the learning experience of their students. This aim will be achieved through the following objectives:
• To determine concepts students find most dif-ficult, using evidence from our automated-assessment system (CourseMarker);
• To select one of these difficult concepts where teaching and learning can be enhanced by visu-alizing the execution of program code;
• To develop a system for creating and deploying visual teaching and learning resources;
• To demonstrate use of the system through a range of examples within the selected difficult concept, exploiting the interactive visual learn-ing aspect of the system, allowlearn-ing students to ex-periment freely by modifying the example code.
Additionally, the system should have the following practitioner-oriented goals:
• Usable: To minimize the extra knowledge re-quired by the practitioner to create and deploy program code visualizations as visual learning resources.
• Malleable: To minimize the effort required to make small changes to an existing visual learning resource that was created with the same system (e.g. correcting small mistakes, or making regu-lar yearly changes).
The system also aims to achieve the following student-oriented goals:
• Usable: To provide a system that students can use effectively, with little or no training.
• Interactive: To allow students the ability to view animations of both code examples from the notes and their own coursework code at any stage during its development.
3
Methodology
The project was conducted in three phases. The first stage involved analysis of the extant data from
CourseMarker. This was followed by customization
of the Jeliot system for closer integration with the module’s requirements. The third stage involved de-velopment of a software wizard, that enables a prac-titioner to create instances of the customized Jeliot
system for specific code examples without requiring any additional technical knowledge. The final stage ties the previous stages together as a demonstration in the form of an on-line lesson. This lesson ad-dresses one of the problems found by analysis of the extant data using visual examples provided by the customized Jeliot system, and was developed using the software wizard.
3.1
Analysis
To determine the introductory programming con-cepts that students find difficult, the CourseMarker
results for semester 1 of the 2005-06 academic year were analysed. These results are comprised of an integer percentage representing the overall exercise score, for each exercise, and for every student. Stu-dents have the option of whether to submit each ex-ercise, but non-submission results in an exercise score of zero. However, it is possible to determine between a submitted and non-submitted exercise score of zero, the former case being a rare occurrence. Each exer-cise belongs to a unit, which may contain one or more exercises designed to test the core programming con-cept of that unit. In an effort to remove any bias, students who did not complete semester one due to
transfer, withdrawal, or suspension of the course were not included in the analysis.
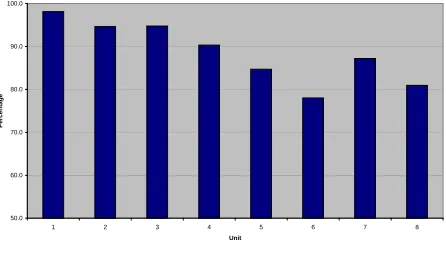
For each of the eight units, two values were deter-mined from the data. Theaverage submission rateis the percentage of a unit’s exercises for which a stu-dent solution was submitted. It was assumed that this value would provide an indication of a unit’s dif-ficulty, since more difficult exercises typically result in less students attempting and submitting their so-lutions (see Figure 1).
Average Submission Rate
50.0 60.0 70.0 80.0 90.0 100.0
1 2 3 4 5 6 7 8
Unit
P
e
rc
e
n
ta
g
[image:3.612.314.536.255.379.2]e
Figure 1. Average Submission Rate
The average submitted mark is the average score
of a unit’s submitted exercises. It was assumed that this value would provide an indication of a unit’s dif-ficulty, since more difficult exercises typically result in lower marks for submitted solutions (see Figure 2).
Average Submitted Mark
50.0 60.0 70.0 80.0 90.0 100.0
1 2 3 4 5 6 7 8
Unit
P
e
rc
e
n
ta
g
e
Figure 2. Average Submitted Mark
[image:3.612.314.537.495.623.2]submit-ted mark values were combined to form an average
difficulty metric, which is a single comparative value
for each unit (see Equation 1).
dif f iculty =submissionrate×submittedmark (1)
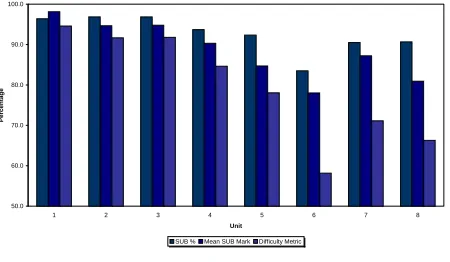
The average difficulty metric is intended to mea-sure the comparative difficulty of each introductory programming concept (see Figure 3). For overall comparison, all three averages are included in Fig-ure 4.
Average Difficulty Metric
50.0 60.0 70.0 80.0 90.0 100.0
1 2 3 4 5 6 7 8
Unit
P
e
rc
e
n
ta
g
[image:4.612.76.299.262.381.2]e
Figure 3. Average Difficulty Metric
All Averages
50.0 60.0 70.0 80.0 90.0 100.0
1 2 3 4 5 6 7 8
Unit
P
e
rc
e
n
ta
g
e
SUB % Mean SUB Mark Difficulty Metric
Figure 4. All Averages
The results indicate a downward trend in both sub-mission rate and average mark as the semester pro-gressed, and this trend is amplified in the average difficulty metric. In all three values, Unit 6 (Arrays) is anomalous to the gradual downward trend, being
markedly lower than other units, and the only unit with an average difficulty metric below 60%.
In programming, arrays are abstract container-like structures used for storing a list of values. For ex-ample, an array might be used to store a list of each item’s price when paying for shopping at a super-market checkout, or a list of lap times in an athlet-ics event. Arrays are typically taught using draw-ings or diagrams that depict an array as a series of connected boxes, in which their values can be writ-ten. However, visualizing arrays in this manner can be extremely time consuming, particularly when the contained values change.
3.2
Jeliot Customization
To develop a system for creating and deploying vi-sual teaching and learning resources a brief survey of code animation tools was conducted. The survey indicated that theJeliotsystem would be highly suit-able for this project for the following reasons:
• Java code animation: The system animates code written in the Java programming lan-guage, which is the language used throughout
theG51PRG module.
• Low-level visualization: The system is well-suited for visualizing low-level programming con-structs such as variables and control blocks, as opposed to high-level constructs such as data structures and object-oriented structures. Low-level constructs are covered in introductory pro-gramming, whereas high-level constructs tend to be taught in more advanced modules.
• Interactive: The system allows students to modify examples and instantly visualize the ef-fects of their modifications.
• Web deployable: The system incorporates
Java Web Start technology, which allows it to
be deployed via the Web.
[image:4.612.75.300.443.574.2]to change, improve, and redistribute it in mod-ified or unmodmod-ified form. This allows the soft-ware to be customized for local integration with existing teaching and learning resources.
• Written in Java: The system itself has been developed using the Java programming lan-guage, allowing better integration with other Java-based software used as part ofG51PRGfor teaching and learning.
The first stage ofJeliot’s customization concerned integrating the existingG51PRG IO (input/output) system into Jeliot. Student’s often find Java’s IO too complex at the introductory level, and therefore
G51PRG students are given an alternative method
that simplifies the processes. Similarly, the Jeliot
system also provides its own simplified alternative, but this is not directly compatible with theG51PRG
simplification. Therefore it was necessary to integrate
theG51PRGIO method into theJeliotsystem to
al-lowG51PRG students to visualize their own exercise
solutions inJeliot without them having to make sig-nificant changes to their solutions.
The second stage of customization involved several changes to the Jeliot GUI. The layout was modified to maximize the size of the visualizations, and the controls were organized in a more logical manner. To better integrate the system with existing teach-ing and learnteach-ing practice, a new colour theme and icon set was created.
3.3
Wizard Development
TheJeliot system is primarily designed as a
learn-ing tool, whereby students create and edit their code usingJeliot as desktop software to visualize the pro-gram execution. Despite being deployable via Java’s
Web Start, the Jeliot system is not well-suited for
teaching practitioners to deploy a visualization for a specific code example. In other words, for a practi-tioner to allow their students to visualize a code ex-ample via the Web, the students would need to launch
Jeliot viaWeb Start, download/copy the code
exam-ple from the Web, then open/paste the code examexam-ple
intoJeliot. It would be far simpler, ifJeliotcould be
launched with the code example pre-loaded.
For a code example to be pre-loaded whenJeliot is launched, several steps are needed that require com-plex technical knowledge of the Jeliot system and Java’sWeb Start technology. A softwarewizard was developed to simplify this process, by leading the user through a sequence of simple steps, and gathering the required information to perform this complex task.
WhenJeliot is launched, it loads a default template
Java code example. This default template is archived into the singleWeb Start file, which is built through anantbuild script that incorporates compilation and code signing. The overall process is comprised of four stages:
1. Incorporating a user-specified code example into the source material, which is used to buildJeliot. The code example is translated into an internal format that Jeliot can interpret and built into a resource file using a default skeleton resource file.
2. Creating a build file from a user-specifiedJDK
installation path and a default skeleton build file.
3. Creating a Java Web Start JNLP file from two user-specified values (a name and a URL) and a default skeletonJNLP file.
4. Executing the generated build file to build an executable Jeliot jar file from the source mate-rial generated in the first stage. The jar file is then digitally signed using a predefined crypto-graphickey store, and the deployableWeb Start
files are generated and packaged into a release folder, ready for copying to the Web server.
3.4
Demonstration
carefully chosen to demonstrate the key concepts of arrays, whilst fully exploiting the use of visualiza-tion for greater impact. Students can also experiment freely by modifying the example code as part of their self study. The demonstration has been integrated with the existing Web-based teaching materials for
theG51PRG module.
4
Conclusions
The analysis stage of this project showed a grad-ual downward trend in both the submission rate and average mark of students throughout the semester. This pattern was amplified in the average difficulty metric, which combines the students’ submission rate and average mark. The downward trend sug-gests that the module’s units become more difficult throughout the module, which is both intended and expected. The result for Unit 6 (Arrays) was anoma-lous to the gradual downward trend, being markedly lower than other units for all measurements, and the only unit with an average difficulty metric below 60%. This anomalous result suggests that Unit 6 covers a concept that the students find more diffult than any of the others covered in the semester. From previous experience of the teaching staff involved, it was ex-pected that the concept of Arrays would be the most difficult, but this is not intentional, and is a problem that needs to be addressed.
In order to address the problem, the Jeliot sys-tem was customized for integration with theG51PRG
module. The customizations were focussed around ease of use for the students; providing seamless inte-gration with existing teaching materials and software. A software wizard was developed for practitioners to easily deploy instances of the customized Jeliot sys-tem. The wizard devolves all the complexities of de-ploying an example visualization into existing teach-ing material by guidteach-ing the user through a simplified decision-making process.
Having developed a visualization environment that could be integrated into existing teaching materi-als using the deployment wizard, a demonstration project was created. The demonstration was based around extending existing lecture notes and example
code to produce two lessons (Basic and Intermedi-ate) on the concept of Arrays. The lessons incorpo-rate “one-click” visualizations of the code that can be viewed by students. The visualizations are in-teractive, allowing students to modify the code and instantly see the affects of their changes in the visu-alizations.
The scope and depth of this project have been lim-ited by its relatively short duration (8 weeks). The main impacts of this limitation were in the analy-sis and demonstration stages. Other factors might have an affect on trends in the average mark and submission rate of a unit’s exercises. For example, the weighting of exercises, the time taken to com-plete a unit, and clashes with deadlines for other coursework or social events occurring at the time of study/assessment. Future work should consider stu-dent results over several years to minimise the impact of external factors.
Throughout this research, priority was placed on developing a generic system that could be useful in any of the concepts, rather than identifying and de-veloping materials for the most problematic concept. Moreover, it was deemed that user trials would not be effective in such a short time period, and could not be scheduled to coincide with the Unit 6 learn-ing. Future work should consider running user trials to coincide with student learning for Unit 6, and com-paring the resulting difficulty metrics with previous years’ results.
The deliverables of this project have been dissem-inated via the Web, for maximum exposure.
References
[1] E. S. J. T. Mordechai Ben-Ari, Niko Myller. Perspectives on program animation with jeliot.
Springer: Software Visualization: International Sem-inar, 2269:618–621, 2002.
[2] U. Z. T. Crews. The flowchart interpreter for intro-ductory programming courses. In28th Annual
Fron-tiers in Education Conference, volume 1, pages 307–