http://www.scirp.org/journal/ijcns ISSN Online: 1913-3723
ISSN Print: 1913-3715
Distributed Middlebox Placement Based
on Potential Game
Yongwen Li, Zhiyi Qu
School of Information Science & Engineering, Lanzhou University, Lanzhou, China
Abstract
In this paper, we analyse the deployment of middlebox. For a given network information and policy requirements, an attempt is made to determine the optimal location of middlebox to achieve the best performance. In terms of the end-to-end delay as a performance optimization index, a distributed mid-dlebox placement algorithm based on potential game is proposed. Through extensive simulations, it demonstrates that the proposed algorithm achieves the near-optimal solution, and the end-to-end delay decreases significantly.
Keywords
Middlebox Placement, Performance Optimization, Potential Game, Matching Graph, Distributed Algorithm
1. Introduction
In order to manage users’ communication, improve safety and performance the operators widely deploy middlebox services in their own network, such as deep packet inspection (DPI), firewall, proxy, intrusion detection and prevention (IDP), network address conversion (NAT), etc. The service chain is defined as a middlebox sequence that should be traversed in a pre-specified order. Recently, the academic and industrial domains have done a lot of efforts on how to im-plement the service chain efficiently [1] [2] [3]. According to the predefined se-quence of strategies, the routing is transmitted from one middlebox to another. However, no matter what program is used to achieve the service chain, there will be such a problem that in the network where the deployment of middlebox is placed in order to make the performance of the overall strategy for the imple-mentation of overall strategy.
This paper mainly solves the problem of middlebox deployment. In particular, according to the traversal sequence of the policy, we aim to find the best location
How to cite this paper: Li, Y.W. and Qu, Z.Y. (2017) Distributed Middlebox Place-ment Based on Potential Game. Int. J. Commu-nications, Network and System Sciences, 10, 264-273. https://doi.org/10.4236/ijcns.2017.105B026
of the deployment of middlebox. Instead of the shortest path passing from the entry point to the exit point, in which traffic route from the entrance to a num-ber of middlebox one by one, and then exit the outlet. Obviously, the overall path will be exaggerated, which will result in a long end-to-end delay. Therefore, in this work, we consider the total end-to-end delay as the optimization index of the policy implementation, which is also adopted in [4], and use this optimiza-tion index to evaluate the performance of proposed middlebox deployment scheme. In the network function virtualization (NFV) [5], the problem is more meaningful since you can easily move one form of middlebox software running on commodity hardware. In NFV, you can use the deployment algorithm more often to determine the best location of middlebox periodically.
In this paper, a distributed middlebox placement based on potential game is proposed to decrease computation complexity. Through the definition of the service queue middlebox for the participants in the game, to minimize the total end-to-end delay as the goal, we design the game strategy and utility function, give the potential game proved that, and according to the definition of ordinal function and analysis of change, it can be proofed that Nash equilibrium point exists in the model. Based on this potential game model, a distributed algorithm is proposed. Through numerical results, the proposed distributed algorithm can reduce the system end-to-end delay significantly compared with the random placement. On average, the end-to-end delay will be reduced by 34%. In addi-tion, it shows that the performance of the proposed distributed algorithm ob-tains the near-optimal solution.
2. Methodology
2.1. System Model
These G=( , )S E is utilized to express underlying network, where S denotes
the switch set, E denotes the link set. For each switch sl∈S, C s( )l represents
the available resource of switch sl in deploying middlebox, and resource
represents the number of available ports in server or the computing resources of
the server. In addition, 1 2,
p l l
d represents the delay from route s1 to route s2,
that is the total delay of all links on the route. Then, a format model is given to describe the strategy. The P is used to describe provision set of policy, the
provi-sion of each policypk∈P, which is defined as
1 2
{ , , , , nk, }
k k k k k k
p = i m m m e
where ik and ek denotes input switch and output switch, respectively,
i k
m
represents the data stream of this policy adopted by the i-th middlebox, and nk
represents the number of middlebox of this policy. Further, we use Q to
represent the set of middleboxes to be deployed, and R q( )i to represent the
required resource to deploy middlebox qi∈Q.
2.2. Problem Formation
From the above definition, we need to determine the location of each middlebox.
,
i l
x is utilized to represent the deployment scenario of the middlebox. When
, 1
i l
, 0
i l
x = . Then, the following constraints are obtained.
, 1, . l
i l i
s S
x q Q
∀ ∈
= ∀ ∈
∑
(1),
( ) ( ), .
i
i i l l l
q Q
R q x C s s S
∀ ∈
≤ ∀ ∈
∑
(2), 0, , \ .
i l i l i
x = ∀ ∈q Q∀ ∈s S S (3)
Condition (1) ensures that each middlebox is only deployed in a switch condi-tion (2) guarantees that the total resource requirements in a local deployment middlebox do not exceed resource performance. Condition (3) indicates that middlebox with special requirements can only be deployed in a specific area.
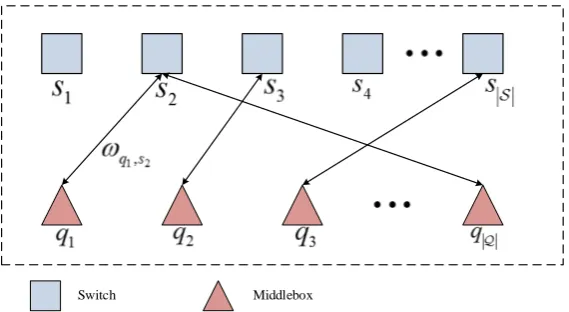
a) Induction problem using matching graph
The main problem of this paper is how to deploy the middlebox to minimize the system delay. This paper mainly uses the matching graph to explain how to
deploy middleboxed, as shown in Figure 1. Where ωq si,j represents the weight
of middlebox qi located in switch sj, which is defined as sum link delay from
the middlebox qi to the next hop. When the last hop of middlebox qi is the end
node, the ωq si, j contains the link delay of starting node to qi. From the above
definition, the overall delay of the system is:
,
i j i tot
q s q
D ω
∈ =
∑
, (4)
where the weight ωq si, j is related to the matching of other middleboxes, which
are determined by the decision variables xi l,.
b) Analysis of the reasons for the problem difficulty
From the above analysis based on matching graph, we can observe that if the
matching position of any middlebox qi changes, and the weight value of other
middleboxes may vary with unchanged matching position. The edge weight of the matching graph is influenced by each other, thus it becomes very difficult to obtain the maximum matching problem as shown in Figure 1. Furthermore, we
can see that if middlebx qi changes its matching position, then the weight of
edges, whose next hop is qi, also changes. Therefore, we modify the definition
[image:3.595.232.517.561.717.2]of weights, and use the growth trend to design distributed algorithm.
Figure 1. Problem model with matching graph.
2.3. Definition of Potential Game
Potential game (PG) [6] is an effective model for the change of the trend, and the most important one is the definition of utility, the effective policy space and the definition of the optimal policy.
1) According to the above analysis, the game model is defined as
( , , )
=
, where represents the number of game players,
represents strategy space, and represents network performance of any
play-er. From the above analysis, the utility of middlebox qi is related to the start
edge and the weight of the next hop edge, so the utility of any player is defined as:
,
, , ,
i k j k j
k i
l j
l
q i l q p q p q p
s
s q
x ω I d
∈ ∈ ∈
=
∑
+∑ ∑
, (5)
Compared with ωq si,j , this definition increases the weight of the edge with
the next hop to the middlebox. Here Ia b, is the indicative symbol that if a=b,
, 1
a b
I = , or Ia b, =0.
2) It is clear that the feasible strategy space of any middlebox qi is to select
some switch, which also meets the constraint of the switch port capacity.
Definition 1: The optimal strategy of the participants. The optimal policy
for any middlebox qi is the minimum utility that can be obtained in a feasible
space when the location of the other middlebox is not changed, that is
max ( , ), ,
n n n n
x∈U x x− ∀ ∈n (6)
where n represents middlebox, xn represents strategy of n, x−n represents the
strategy of other middlebox except n. The above formula represents the best strategy for the current middlebox, which is based on the same location of the other middlebox.
3) According to the definition of the above utility function and the strategy space, we also need to prove that this game model is a potential game.
Theorem 1: The game model defined as =( , , ) is a potential game.
Proof: We first define the ordinal function as
, , ( ) i i l l q s i l q s
F x x ω
∈ ∈
=
∑ ∑
. Then, we prove that any varying in the layout of the
middlebox will bring a change in its own utility function and change the value of ordinal function with the same trend. Assuming that the layout of a middlebox
i
q has changed, from the switch sl to switch sl, the utility function of the
middlebox varys as follows:
1 2 , , , , , , , , , , , , , , , ,
i i k j k j
l k j
k j k j
l k j
l l
i l
i l
i l
k j k j k j k j
k j k
i
j l
q q i l p q p q
s p q
i l p q p q
s p q
i l i l s
q s
q s
q s q s s
U
p q p q p q p q
p q p q
U
x I d
x I d
x x
I d I d
where ∆U1 represents the delay varying of the edge with qi as the starting
point and ∆U2 represents the delay varying of the edge with qi as the next
hop. Similarly, the ordinal function of the change is shown below:
1
, ,
, ,
, ,
, ,
( ) ( )
i l i
i l i l
i l i
l
l
l l
i l i l
q s q s
i l i
q s l
q s q
s
U
q s s
s
F x F x x x
x x F
ω ω
ω ω
∈ ∈ ∈ ∈
∈ ∈
∆
− = −
= − + ∆
∑ ∑
∑ ∑
∑
∑
(8)
where ∆F22 indicates the edge delay of next hop as qi for all of the strategies, as
the delay of other edge independent of qi will not change, ∆ = ∆F2 U2.
There-fore, it is proved that the game model defined as =( , , ) is a potential
game. According to the above definition, it can be concluded that this model ex-ists Nash equilibrium.
2.4. Distributed Algorithm
Based on the above potential game, it can be seen that any middlebox can choose its best strategy to reduce the system delay. The specific algorithm can be de-picted extensivley as follows (Algorithm 1):
In the algorithm, each middlebox selects its best strategy in a random order. In each iteration, the system uniformly randomly chooses one middlebox
q∈, the selected middlebox obtains its best strategy from Definition 1. If no
new strategy is obtained from all middlebox, the stop flag is set to be 0, and the Algorithm 1 ends.
From the analysis of these algorithms, it can be seen that any middlebox can reduce system latency only considering its utility, therefore, saving the overall
optimization of the system overhead, and overcome the convergence problem of heuristic algorithm (such as reference in the literature of the simulated annealing algorithm [4]).
2.5. Proof of Convergence
Theorem: the proposed distributed algorithm certainly converges to the Nash equilibrium point.
Proof: Each a iteration of the algorithm generates a new strategy by adopting the best response strategy. Since there are only a limited number of middlebox, the maximum number of policies for each middlebox is limited. Therefore, the system can achieve the final strategy by finite iteration with probability 1.
3. Results
In this section, we evaluate the performance of the proposed algorithm for mid-dlebox layout. In the evaluation, we introduce random layout for comparison. Random placement does not consider the impact of middlebox placement on system delay, and only guarantees that the constraint conditions are satisfied. In the design of network topology and service chain strategy, the previous works [2] [7] used well known topology (such as Abilene and FatTree) in strategy ex-ecution due to the lack of openly available information. In this paper, we choose the Abilene [8] network as the reference; Abilene is the core network of Internet 2, which is the irregular topology of the network (like most ISP network). The network has 11 nodes, 14 links. We adopted the same approach as the literature [2] and [7] to generate policy rules. Specifically, we assume that there are dif-feent number of applications, and the traffic flow required for each application is required through multiple middlebox. We gave each application a random as-signment of a middlebox sequence. Then, a number of applications are random-ly selected for the traffic flow between the two switches to generate the policy requirements. We distributed the link delay according to the uniform distribu-tion. Based on the link delay, the network controller will select the shortest path passing from one switch to another through route.
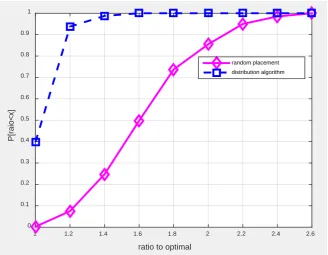
In the evaluation, we generated a total of 400 simulation scenarios. In each scenario, we randomly selected the value of each parameter from the parameter set in Table 1, and generated the network settings and policies. The cumulative distribution function (CDF) associated with the optimal value is as shown in Figure 2. As shown in the graph, the performance gap between the distributed algorithm and the optimal solution is very small. Specifically, the performance gap of the distributed algorithm for 92.5% of the simulated scenarios is less than 20%. In addition, there is a large gap between the distributed algorithm and random layout, which shows that the proposed algorithm greatly improves the performance of the strategy. On average, the distributed algorithm reduces the end-to-end delay of 34% compared to random placement.
Figure 2. CDF of end-to-end delay with different placement over optimal results.
Table 1. Parameters settings in the performance evaluation.
Parameter Distribution Mean Var Link delay(ms) Uniform 1, 1.5, 2, 2.5 0.4, 0.5, 0.6, 0.7 Available switch ports 1, 2, 3 N/A N/A The number of middleboxes to deplay 7, 8, 9, 10 N/A N/A The number of middleboxes in each policy 3, 4, 5, 6 N/A N/A The number of total applications 5, 10, 15 N/A N/A
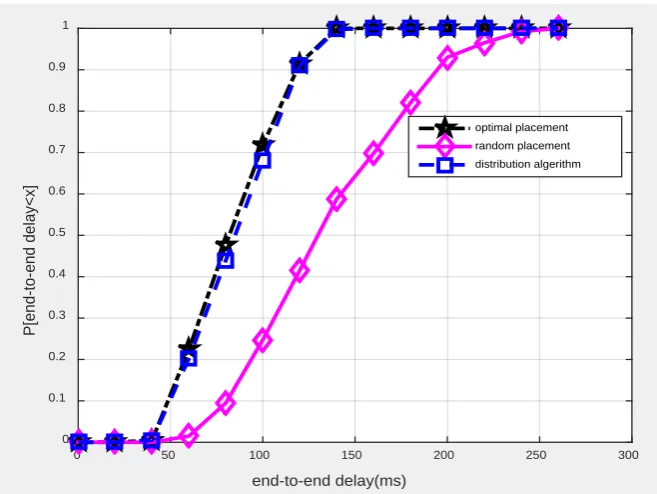
The results of a scenario are shown in Figure 3. These results clearly indicate that the layout scheme has a significant impact on the system performance. Middlebox placement by proposed distribution algorithm can obtain near op-timal performance, about 70% of end-to-end delay of strategy is less than 100 ms. However, Middlebox deployment according to random arrangement is only 25%. In the schemes generated by distribution algorithm, 100% of the delay of the strategy is less than 150 ms, and there is only 65% in the schemes generated by randomly placement.
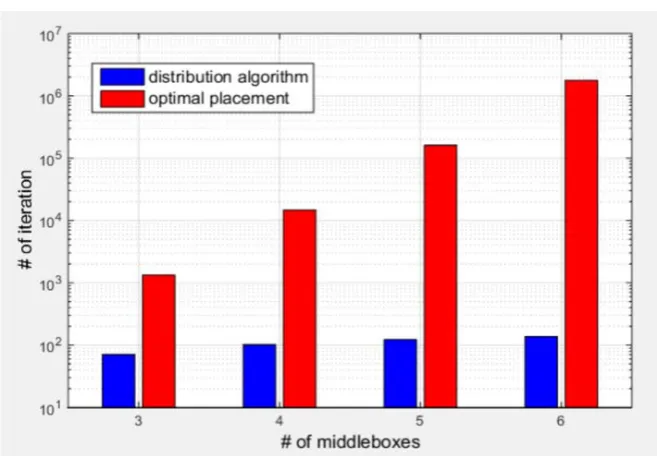
The performance results for each switch with the number of available ports varying are described in Figure 4. In this simulation, each policy consists of 5 middlebox. As shown in Figure 4, the performance is improved with the in-censement of the number of available ports. This is because those more available ports provide more feasible strategy for each middlebox. We observe that that the distributed algorithm has can utilize the increased resources more efficiently. Figure 5 provides a comparison of computation complexity between the distri-buted algorithm and the optimal placement algorithm. It can be clearly ob-
ratio to optimal
1 1.2 1.4 1.6 1.8 2 2.2 2.4 2.6
P[raio<x]
0 0.1 0.2 0.3 0.4 0.5 0.6 0.7 0.8 0.9 1
Figure 3. CDF of end-to-end delay of each policy.
Figure 4. Average end-to-end delay varying the number of available ports on each switch.
served that the distributed algorithm reduces the computation complexity sig-nificantly from two aspects. One is to reduce the number of overall iterations, the other is to share the computing tasks among all switch.
4. Conclusion
In this paper, we mainly analyze the optimization of middlebox deployment to minimize the end-to-end delay. The matching graph was utilized to formulate
end-to-end delay(ms)
0 50 100 150 200 250 300
P[end-to-end delay<x]
0 0.1 0.2 0.3 0.4 0.5 0.6 0.7 0.8 0.9 1
optimal placement random placement distribution algerithm
# of available ports on each switch
1 2 3
average end-to-end delay(ms)
0 20 40 60 80 100 120 140
Figure 5. The number of iteration when varying the number of middleboxes.
the problem, which is proved as a potential game and exists the Nash equili-brium. Thus, a distributed algorithm is proposed based on potential game. Through extensive simulations, it is proved that the proposed algorithm can re-duce the end-to-end delay effectively and obtain the near-optimal solution.
Acknowledgements
The authors would like to acknowledge all the members that participation in the exhaustive field measurement campaign for their valuable effort. Thanks also anonymous reviewers for their perspicacious comments.
References
[1] Grillo,G., Joseph, D.A., Tavakoli, A. and Stoica, I. (2008) A Policy-Aware Switching Layer for Data Centers. Proc. ACM SIGCOMM, 51-62.
https://doi.org/10.1145/1402958.1402966
[2] Qazi, Z.A., Tu, C.-C., Chiang, L., Miao, R., Sekar, V. and Yu, M. (2013) Simple-Fy- ing Middlebox Policy Enforcement Using Sdn. Proc. ACM SIGCOMM, 27-38. https://doi.org/10.1145/2534169.2486022
[3] Zhang, Y., Beheshti, N., et al. (2013) Steering: A Soft- ware-Defined Networking for Inline Service Chaining. Proc. IEEE ICNP, 1-10.
https://doi.org/10.1109/icnp.2013.6733615
[4] Liu, J., Li, Y., Zhang, Y., et al. (1939) Improve Service Chaining Performance with Optimized Middlebox Placement. IEEE Transactions on Services Computing, 1-1.
[5] Sdn and Openflow World Congress Introductory White Paper, Network Functions
Virtualisation. https://portal.etsi.org/NFV/NFVWhitePaper.pdf,2012.
[7] Sekar, V., Egi, N., Ratnasamy, S., Reiter, M.K. and Shi, G. (2012) Design and Im-plementation of a Consolidated Middlebox Architecture. Proc. USENIX NSDI, 323-336.
[8] Abilene Core Topology.
https://itservices.stanfo-rd.edu/service/network/internet2/abilene
Submit or recommend next manuscript to SCIRP and we will provide best service for you:
Accepting pre-submission inquiries through Email, Facebook, LinkedIn, Twitter, etc. A wide selection of journals (inclusive of 9 subjects, more than 200 journals)
Providing 24-hour high-quality service User-friendly online submission system Fair and swift peer-review system
Efficient typesetting and proofreading procedure
Display of the result of downloads and visits, as well as the number of cited articles Maximum dissemination of your research work
Submit your manuscript at: http://papersubmission.scirp.org/