Munich Personal RePEc Archive
Poverty and Intelligence: Evidence Using
Quantile Regression
Oasis, Kodila-Tedika and Remy, Bolito-Losembe
University of Kinshasa
4 June 2014
Online at
https://mpra.ub.uni-muenchen.de/56467/
POVERTY AND INTELLIGENCE: EVIDENCE USING
QUANTILE REGRESSION
Oasis Kodila-Tedika
University of Kinshasa, Department of Economics
Kinshasa, Democratic Republic of Congo
E-mail:
[email protected]
Remy Bolito-Losembe
University of Kinshasa, Department of Economics
Kinshasa, Democratic Republic of Congo
E-mail: [email protected]
Abstract
This study revisits the conclusion of Lynn and Vanhanen (2006) which suggests that countries with a high IQ on average are those with low poverty rates. We go beyond the simple bivariate correlation by controlling for other variables and using alternative econometric techniques. Our findings confirm that the conclusions of Lynn and Vanhanen (2006) remain robust. Moreover, the mitigating incidence of intelligence is higher in bottom quantiles than in top quantiles, which supports the greater relevance of knowledge economy in poorer countries.
Keywords: Poverty, Intelligence
JEL classification: D73, I2
1. Introduction
The theoretical formalization offers a model explaining the poverty trap by human capital. Lynn and Vanhanen (2006) are keen in this relationship. From an empirical perspective, the result is quite clear: countries with a higher IQ are associated with a very low level of poverty. In this vein, at the micro level, there is evidence that IQ is a major determinant of personal wealth (Gottfredson, 1997, 1998, 2002). And theoretical arguments are not lacking. Indeed, intelligence can be vigilant and therefore more easily grasps available opportunities, including entrepreneurship (Hafer and Jones, 2012) and more optimal exploitation of the entrepreneurial opportunities. It allows you to be cooperative and therefore exploit externalities.
The strength of the empirical analysis of Lynn and Vanhanen (2006) has never really been studied. For more recently, Mani et al. (2013) showed that poverty also affects cognitive Capacities. This result is in line with that Daniele (2013) which states that the average IQ of
populations appears to be endogenous, related to the diverse stages of nations’
modernization, rather than being an exogenous cause of economic development. The results
of Daniele can also be discussedin the light of causality fromintelligenceto economic development put forward by Christainsen (2013). So, we are doing this sought therefore of significant scientific interest. The objective of this study is to consider precisely this problem by using other econometric techniques. Quantile regressions are the most widely used regression methods that are robust to outliers. Thus we investigate the relationship found by Lynn and Vanhanen (2006).
But beyond this empirical discussion, the paper enriches the literature. The remainder of this paper is organized as follows. The next section will concentrate on the data. The third section presents the econometric methodology. Then the results are presented in Section 4. A conclusion ends the article.
2. Data and Methodology
2.1. Data
We capture poverty by the percentage of the population living under the poverty threshold determined (PPP $ 1.25 per day and national poverty line). The national poverty line is the poverty line deemed appropriate for a country by its authorities. National estimates are based on estimated weighted subgroups (population) from household surveys. These data come from the database of the World Bank, World Development Indicators. Population size, GDP per capita and openness from the same database. These fourvariables relate to2010.
number of cognitive capacities of a subject, including his general intelligence (the factor G). Psychologists regularly resort to it (Neisser, 1998; Larivée and Gagné, 2006). This study also makes use of it to approximate intelligence.
An often used measure of general intelligence at the national level has been the IQ1series first
published by Lynn et al. (2002, 2006 and 2010). We employ the data of Lynn et al (2002, 2006 and 2010), which was also used by Potrafke (2012), Hafer and Jones (2012). This average IQ is based on data from surveys; however, all countries lack these survey data. Then Lynn and Vanhanen have completed the missing data through estimations. Rindermann (2007) shows that these results are highly correlated with a large number of international student assessment studies on subjects such as reading, mathematics, science, and problem solving. The advantage of the 2010 data is the simple fact that the authors have not taken into account the extrapolated data. These data do not fundamentally differ from Meisenberg and Lynn (2011).
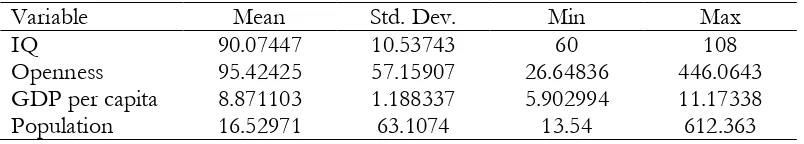
[image:4.612.65.467.457.529.2]Finally, we include regional dummies to take account of the specificities of different regions of the world. All the estimations incorporate these dummies. Following the trend in the literature, geographical location is captured by distinguishing between the Africa, Asia, Oceania, Europa and America. If the country belongs to the African continent, it has the score 1 otherwise 0. This logic was also applied to other continents. Table 1 shows the descriptive statistics.
Table 1 - Descriptive statistics
Variable Mean Std. Dev. Min Max IQ 90.07447 10.53743 60 108 Openness 95.42425 57.15907 26.64836 446.0643 GDP per capita 8.871103 1.188337 5.902994 11.17338 Population 16.52971 63.1074 13.54 612.363
2.2. Estimation method
The vast majority of empirical economic studies focus on the effects of variables that we are interested in. This fact is explained by the distribution of a statistical tool, the simple linear regression was used and well controlled. But for several reasons the Ordinary Least Squares (OLS) is limited, especially in the presence of extreme variables and assumes that the error term and the dependent variable is normally distributed. This means observations that deviate from the linear pattern formed by the majority of the data. Outliers frequently occur
in datasets because of measurement errors as some observations may be drawn from a different population with a different type of nexus between them and the variable of interest or due to exceptional events (e.g earthquakes). Accordingly, OLS on such a dataset contaminated by outliers may results in severely biased estimates. In the extreme case for instance, one single outlier can result in an infinite bias of OLS estimates. In order to deal with the problem, robust regression methods are required. Quantile regression method proposed by Koenker and Basset in 1978, overcomes these limitations include. Quantile regressions are the most widely used regression methods that are robust to outliers.
Consistent with recent literature (Billger & Goel, 2009; Okada & Samreth, 2012; Asongu, 2013a, b), to determine whether existing levels of poverty affect how IQ comes into play, we use quantile regression. This approach enables us to assess if the nexus between IQ and poverty differs throughout the distributions of poverty (Koenker & Hallock, 2001). Hence, based on this estimation technique we are able to carefully examine the incidence of IQ throughout the conditional distribution with particular emphasis on countries with the highest and lowest poverty levels. Quantile regression (hence QR) yields parameters estimated at multiple points in the conditional distribution of the dependent variable (Koenker & Bassett, 1978). QR is an extension of OLS. More formally, these two techniques are as follows:
(1)
Where i is the number of observations, yi is the dependent variable (poverty),xi are the
explaining variables for individual (xi contains a constant term, IQ and control variables:
regional dummies, openness, GDP per capita and Population) i and β is the vector of parameters to be estimated. The technique consists of minimizing the sum of residual squares and those of the unweighted sum of absolute of residuals.
QR consists of generalizing the preceding formula and looking for a solution in the following equation:
(2)
Where ρq is the function corresponding to the q quantile and βq is the vector of parameters to be estimated which vary with respect to the quantile threshold.
assigning appropriate weights to the positive and negative residuals. Moreover, the estimators by QR will not be the same as those obtained by OLS. They have in particular robustness properties that make them interesting.
We also report findings for Least Absolute Deviations (LAD) which should correspond to those of the 0.5th quantile for robustness purpose (Asongu, 2013a, b).
4. Results
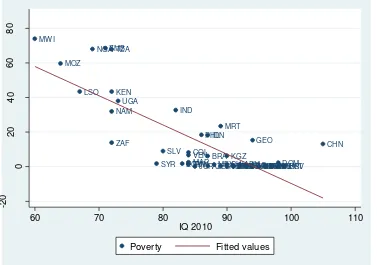
The findings presented in Table 2 entail OLS, LAD and QR estimates. OLS estimates provide a baseline of mean effects and we compare these to estimates of LAD and separate quantiles in the conditional distributions. In the first column, an OLS model is estimated in order to not only identify with the significance of the parameters relevant variables, but also, and especially, to demonstrate the utility of conducting quantile regression, providing variability parameters for different levels of distribution, unlike a single linear model. Likely to Correct for heteroskedasticity, we present white-corrected standard errors. The estimate (OLS) confirms the relationship Lynn and Vanhanen (2006). The average IQ is solidly negatively related to poverty. More intelligence is associated with less poverty at the national level. This is what is shown in the graph below. It is normal to find the same result as we use herethe same techniquethey.
ARG ARM
AZE BGRBIH
BRA CHL CHN COL DOM EGY EST GEO HRV HUN IDN IND
IRNJOR KAZ
KEN
KGZ LSO
LTU LVA
MAR MEX MKD MDA
MOZ MRT MWI MYS NAM NGA PHL POL ROM RUS SLV
SRB SVKSVN
SYR TUN TURTHA
TZA UGA UKRURY VEN ZAF ZMB -2 0 0 20 40 60 80
60 70 80 90 100 110
IQ 2010
[image:6.612.73.450.430.695.2]Poverty Fitted values
The same conclusion is valid for the nexus between growth and poverty. This conclusion is widely shared by economists. The openness and population size are positively related to poverty. However, the relationship with openness is hardly statistically significant. The LAD estimates with generally lead to the same conclusions, except for GDP per capita is no longer significant.
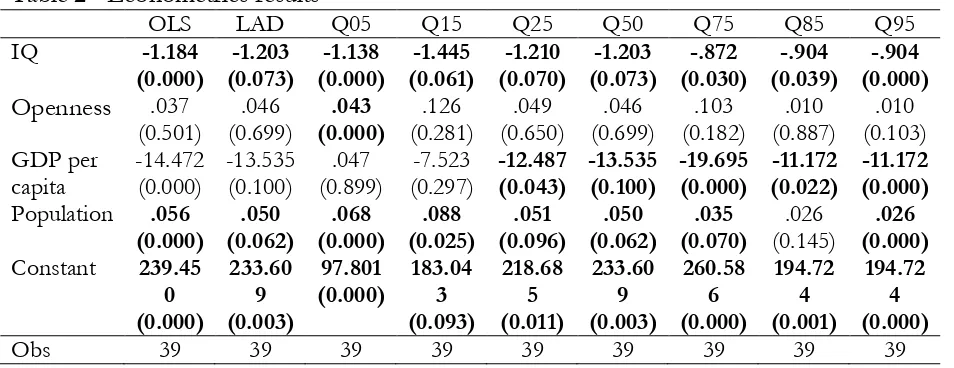
The estimation results for quantile regression show relatively large variability coefficients for the different variables and considered quintile selected. The coefficient of IQ seems highly volatile across quantiles and also in terms of significance. It negative coefficient confirms the existing consensus the more intelligence decreases poverty.
[image:7.612.65.542.387.571.2]The coefficient corresponding to openness is always positive. Its effect is not really significant, except for Q5. We are here in the presence of the limit of the OLS estimate that returns a non-significant mean effect. And yet, for this portion of the sample, openness does not seem conducive to poverty. On average, growth has a major impact on poverty reduction, but when you consider each distribution, the same conclusion is confirmed except for Q5, Q15 and Q50. The LAD findings correspond to the 0.50th quantile estimates.
Table 2 - Econometrics results
OLS LAD Q05 Q15 Q25 Q50 Q75 Q85 Q95
IQ -1.184
(0.000) -1.203 (0.073) -1.138 (0.000) -1.445 (0.061) -1.210 (0.070) -1.203 (0.073) -.872 (0.030) -.904 (0.039) -.904 (0.000)
Openness .037 (0.501) .046 (0.699) .043 (0.000) .126 (0.281) .049 (0.650) .046 (0.699) .103 (0.182) .010 (0.887) .010 (0.103) GDP per capita -14.472 (0.000) -13.535 (0.100) .047 (0.899) -7.523 (0.297) -12.487 (0.043) -13.535 (0.100) -19.695 (0.000) -11.172 (0.022) -11.172 (0.000)
Population .056 (0.000) .050 (0.062) .068 (0.000) .088 (0.025) .051 (0.096) .050 (0.062) .035 (0.070) .026 (0.145) .026 (0.000)
Constant 239.45 0 (0.000) 233.60 9 (0.003) 97.801 (0.000) 183.04 3 (0.093) 218.68 5 (0.011) 233.60 9 (0.003) 260.58 6 (0.000) 194.72 4 (0.001) 194.72 4 (0.000)
Obs 39 39 39 39 39 39 39 39 39
Note: P-value are (). IQ: Intellectual Quotient. GDP: Gross Domestic Product. Obs: Observations.
5. Conclusion
This study revisits the conclusion of Lynn and Vanhanen (2006) that countries with a very high average IQ are countries with a low level of poverty. It goes beyond this simple bivariate correlation by controlling for other variables and using other econometric techniques, mainly Least Absolute Deviations and quantile regression. Our results suggest that this finding of Lynn and Vanhanen (2006) remains robust. Human capital is significant determinant of poverty. Moreover, the mitigating incidence of intelligence is higher in bottom quantiles than in top quantiles, which supports the greater relevance of knowledge economy in poorer countries.
The implication of this study is simple: a way to reduce poverty is increases the level of human capital.
References
Asongu S A (2013a). The impact of health worker migration on development dynamics: evidence of wealth-effects from Africa, The European Journal of Health Economics, 15(2):187-201.
Asongu S A (2013b). Fighting corruption in Africa: do existing corruption-control levels matter, International Journal of Development Issues, 12(1): 36-52.
Berggren N, Elinder M, Jordahl H (2008). Trust and Growth: A Shaky Relationship, Empirical Economics, 35(2): 251-274.
Billger S M, Goel, R K. (2009). Do existing corruption levels matter in controlling corruption? Cross-country quantile regression estimates, Journal of Development Economics, 90: 299-305.
Christainsen G B (2013). IQ and the wealth of nations: How much reverse causality? Intelligence, 41:688-698.
Daniele V (2013). Does the intelligence of populations determine the wealth of nations?,
Journal of Behavioral and Experimental Economics, 46(C):27-37.
Dollar A, Kraay A (2002). Growth is Good for the Poor, Journal of Economic Growth
7(3):195-225.
Gottfredson L (2002). Intelligence: Is it the Epidemiologists’ Elusive “Fundamental Cause” of Social Class Inequalities in Health?, mimeo.
Gottfredson L S (1997). Why g matters: The complexity of everyday life. Intelligence, 24(1):79-132.
Gottfredson L S (1998). The general intelligence factor.Scientific American Presents, 9(4): 24-29.
Gottfredson LS (1997). Foreword for intelligence and social policy, Intelligence, 24(1): 1-7.
Gouillon P (2002). Le QI, Revue ANAE, 67:83-90.
Hafer R W, Jones G (2012). IQ and Entrepreneurship: International Evidence, mimeo.
Jones G, Schneider W (2006). Intelligence, human capital, and economic growth: A bayesian averaging of classical estimates (bace) approach. Journal of Economic Growth, 11(1):71-93.
Kalonda-Kanyama I, Kodila-Tedika O (2012). Quality of Institutions: Does Intelligence Matter?, Working Papers 308, Economic Research Southern Africa.
Kodila-Tedika, O. (2014), Governance and Intelligence: Empirical Analysis from African Data, forthcoming in the Journal of African Development.
Koenker R Bassett Jr G (1978). Regression quantiles, Econometrica, 46:33-50.
Koenker R, Hallock F K (2001). Quantile regression. Journal of Economic Perspectives. 15: 143-156.
Larivée S, Gagne F (2006) Intelligence 101 ou l’ABC du QI, Revue de Psychoéducation, 35(1) :1-9.
Lynn R, Meisenberg G (2010). National IQs calculated and validated for 108 nations.
Intelligence, 38: 353-360.
Lynn R, Vanhanen T (2006). IQ and Global Inequality. Washington Summit Publishers, Augusta, GA.
Lynn R, Vanhanen T (2002). IQ and the wealth of nations. Westport, CT: Praeger Publishers.
Mani A, Mullainathan S, Shafir E, Zhao J (2013). Poverty Impedes Cognitive Function
Science 341: 976-980; DOI: 10.1126/science.1238041
Meisenberg G, Lynn R (2011). Intelligence: A measure of human capital in nations. The Journal of Social, Political and Economic Studies, 36 : 421–454.
Neisser U (1998) Sommes-nous plus intelligent que nos grands grands-parents, Recherche, 309 :46-52.
Okada, K., & Samreth, S., (2012). The effect of foreign aid on corruption: A quantile regression approach, Economic Letters, 11, pp. 240-243.
Potrafke, N. (2012). Intelligence and Corruption, Economics Letters, 114(1): 109-112.
Ravallion M, Chen S (1997). Distribution and Poverty in Developping and Transition Economies: New Data on Spells During 1981-93, World Bank Economic Review 11.
Rindermann H (2007). I The g-factor of international cognitive ability comparisons: The homogeneity of results in PISA, TIMSS, PIRLS and IQ-tests across nations. European Journal of Personality, 21, 667−706
Weede E, Kämpf S (2002). The impact of intelligence and institutional improvements on economic growth. Kyklos, 55(3):361-380.