Applying mobile information and communications
technology to countryside access
WALMSLEY, John and CROWE, Lynn
<http://orcid.org/0000-0002-6930-3136>
Available from Sheffield Hallam University Research Archive (SHURA) at:
http://shura.shu.ac.uk/11560/
This document is the author deposited version. You are advised to consult the
publisher's version if you wish to cite from it.
Published version
WALMSLEY, John and CROWE, Lynn (2015). Applying mobile information and
communications technology to countryside access. Waymark, 27 (4), 13-19.
Copyright and re-use policy
See
http://shura.shu.ac.uk/information.html
Applying Mobile Information And Communications Technology
(ICT) To Countryside Access
By John Walmsley and Lynn Crowe
1
Introduction
In the last few years there has been a huge surge in mobile telephony, both in terms of the capability of the technology and its uptake by the general public. Two years ago Deloitte (2013) reported that a staggering 72% of UK consumers owned a smartphone. Research by Cisco (2014) shows that mobile data traffic alone in 2013 was nearly 18 times the size of the traffic of the entire
internet as it was in 2000.
Smartphones have functionality such as GPS, touchscreens, and cameras that make them potentially highly suitable for outdoor recreational activities. However, there are all sorts of potential barriers to use in this sphere, not least the vagaries of network coverage especially in rural and upland areas, and practicalities such as operating the devices in the cold or wet.
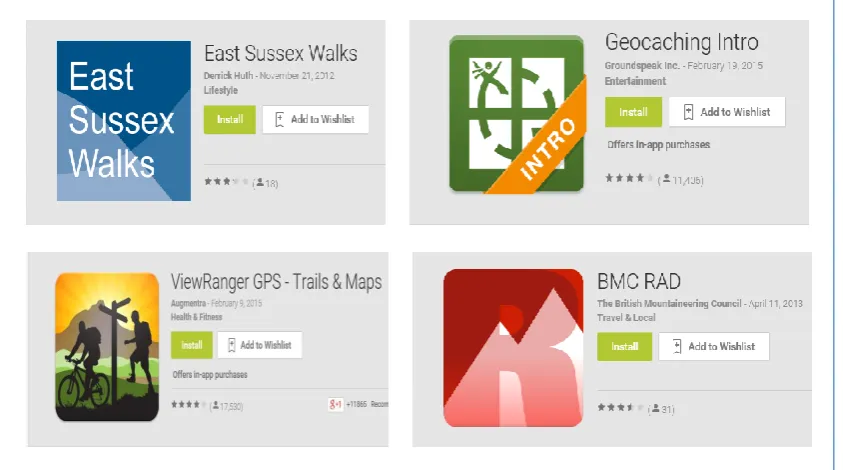
[image:2.595.72.494.425.660.2]The dissertation endeavoured to answer this research question:
Can mobile ICT improve user experience for countryside access activities, and if so, how?
The subject was approached by applying learning from Technology Acceptance Theory to existing case studies and also to an assessment of a practical project carried out in partnership with the Berkshire, Buckinghamshire and Oxfordshire Wildlife Trust (BBOWT).
Technology Acceptance Theory has evolved from the field of Social Psychology and seeks to explain how innovations succeed or fail to achieve widespread adoption.
The case studies were evaluated to see what lessons could be derived from initiatives where mobile ICT has already been used in related fields in an outdoor setting.
2
Results and Analysis
2.1
What does Technology Acceptance Theory tell us?
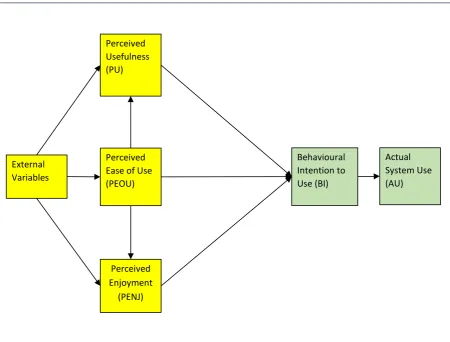
[image:4.595.72.523.250.592.2]Technology Acceptance Theory provided a firm platform for the rest of the research. Behavioural models dating back to Davis (1986) have become very successful in studying the way in which technology succeeds or fails to achieve widespread use. These models pointed to Perceived Usefulness and Perceived Ease of Use as being paramount determinants of the attitude of users to new technology, and thus their take-up at work or in the home. For a voluntary activity such as outdoor recreation, there is none of the compulsion to use mobile technology as might be the case of the work place, and it is therefore not surprising that Enjoyment (or lack of it) then also shapes users attitudes to use. This leads to models like Figure 2 which comes from a study of using mobile devices for contextual information in two European National Parks.
Figure 2 – Technology Acceptance Model (Dias 2007)
External Variables
2.2
What did the case studies reveal?
Innovation and practice in some related fields which involved outdoor use of mobile ICT seemed to be ahead of the relatively small (but growing) number of initiatives that were targeted at outdoor recreation for its own sake. Historical heritage, tourism, and citizen science initiatives were cases in point.
A qualitative examination of such case studies, by internet based research and telephone interviews with some of their initiators, found some common themes:
There was evidence of the same 3 parameters from Technology Acceptance Theory being involved in influencing the success or failure of the scheme. For instance, the complexity of an app will adversely affect users’ perceptions of Ease of Use. Similarly, a screen full of content that does not relate directly to what users at a particular location can see with their own eyes is not going to be rated by them as Useful. However adding interactive content or facilitating sharing via social media is likely to enhance users’ Enjoyment of using their smartphone for outdoor recreation.
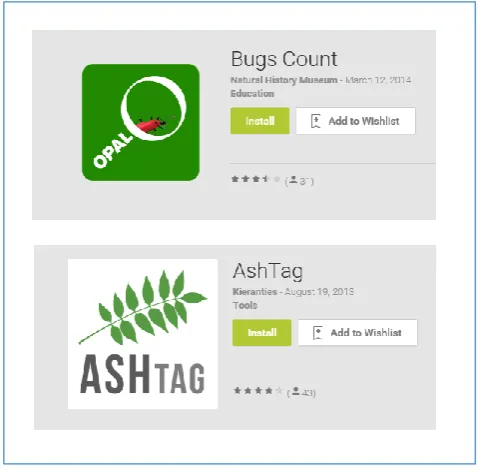
[image:5.595.177.419.352.589.2]Some citizen science apps demonstrate exemplary simplicity and purpose (Figure 3). Readers might wish to try for example the Opal Bugs Count App which has given the Natural History Museum a wealth of data and has inspired a new generation of nature detectives.
Figure 3 - Citizen Science Native Apps
One especially important aspect of app design emerged that did not have any direct parallel in Technology Acceptance Theory. This was the maxim “Content is King”, which came out very strongly in telephone interviews conducted with other practitioners. Content must be engaging and have a clear purpose. No amount of brilliant technology can compensate for a badly presented and uninspiring subject.
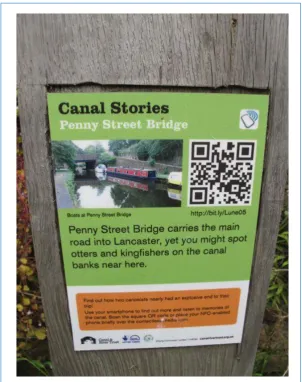
further material can be viewed by scanning the QR (Quick Response) code or holding smartphone near the NFC (Near Field Communications) symbol in the top right hand corner. In this way there is something for everyone.
2.3
What was learned from the Thatcham Project?
2.3.1
Take a virtual walk!
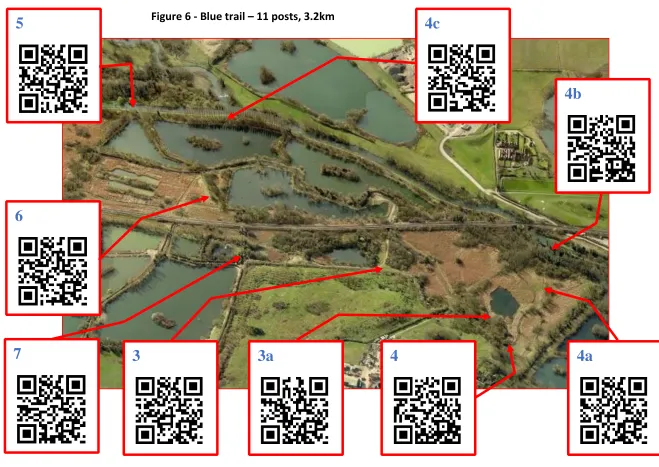
Figure 5 - Red trail – 6 posts, 1km (adapted from Bing Maps)
3
4
2/
2
1/
1
3
3a
4
4a
4b
4c
7
6
[image:9.842.93.752.64.531.2]2.3.2
App and content design
Combining some of the lessons learned about app and content design from the case studies
together with the views already held by interpretation and communications professionals in BBOWT gave a useful set of rules for the Thatcham Project, and would be appropriate for many other situations too. These were:
Assume a visitor attention span of no more than 30 seconds.
Use no more than 150 words of text per web page as initially displayed.
Only vertical scrolling of web pages is allowed, and even then it should not be necessary to
scroll down more than once.
Do not require the user to zoom in or out to find or read content. Do not require any text input from the user.
Content should be mainly pictures and text. Avoid video.
Avoid clutter. Items on the screen need to be limited to those that are actually essential. On-screen controls (e.g. buttons, drop-down boxes) must be large enough to be reliably
activated in adverse weather.
2.3.3
Results: User statistics
Figure 7 - Red trail usage
0 20 40 60 80 100 120 140 160 180 200Red Trail - Cumulative Net Unique Page Views
(mobile only)
1 Mallards 2 Pochards 3 Winter Twigs 4 Garden Birds 5 Gravel extraction 6 Living Roof
20 30 40 50 60
Blue Trail - Cumulative Net Unique Page Views
(mobile only)
3 Stone Age Man 3a Bird Hide 4 A Rare Snail
[image:12.595.73.514.441.736.2]The most eye-catching feature of these graphs is the huge variation in page views from one post to the next. The idea of a trail that people will follow in sequence in its entirety did not fit the facts at all at Thatcham, even for the Red Trail where the route is highly constrained. It seems that
engagement with the trail was generally of an opportunistic nature, as and when visitors spotted a trail marker, rather than a being a planned activity in response to the advertising in the visitor centre and on social media. Opportunistic behaviour implies that it is unlikely that the objective to
persuade people to walk a little further than they might otherwise was achieved.
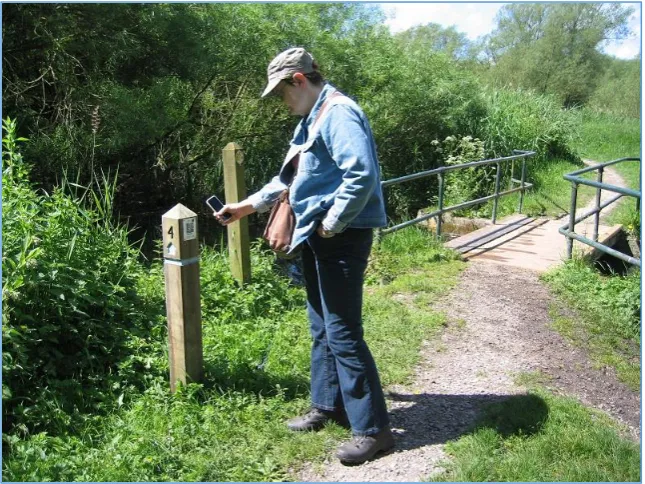
[image:13.595.137.460.270.512.2]A further counter-intuitive issue was that on the Red Trail the posts nearest the visitor centre were getting the lowest number of hits whilst those furthest away had the highest. There may be just too many visual distractions near the visitor centre for people to notice the trail markers which were deliberately made to be visually unobtrusive (see Figure 9).
Figure 9 – Scanning a QR code in the Reedbeds Nature Reserve
With hindsight it might have been better to have made the trail markers larger and to have given more of a clue to their purpose, perhaps in the style of the Canal and River Trust’s Trail seen earlier (Figure 4).
2.3.4
Trends
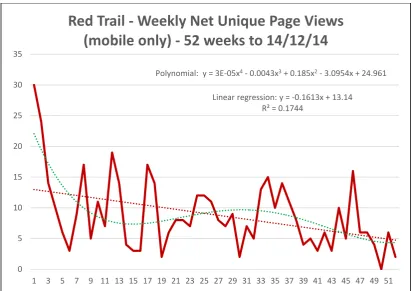
Figure 10 - Weekly usage for red trail
Another question was whether the trails would be a one-hit wonder or would hold longer term interest for visitors. This is easiest to answer for the Red Trail where there is now over a year’s worth of data. This enables seasonal variation to be discounted from the statistical analysis by applying simple linear regression on a 52 week timeline to see whether visitor numbers were rising or falling overall.
A decrease in use can be clearly seen in the dotted red regression line in Figure 10, and was still present albeit at a lower rate of decline when data for the first 3 weeks after launch was removed and a further 3 weeks of more recent data added to the end.
Some kind of decline over time would be expected for any form of interpretation and, although overall usage was lower than had been hoped, nevertheless it is clear that the trails continue to hold interest for a proportion of visitors to the site.
Demonstrations of the technology with some non-visitors elicited mainly polite interest, but served to show that mobile ICT is not for everyone. Many people just want to get on with their walk and get away from the trappings of modern life for a while.
Linear regression: y = -0.1613x + 13.14 R² = 0.1744
Polynomial: y = 3E-05x4 - 0.0043x3 + 0.185x2 - 3.0954x + 24.961
0 5 10 15 20 25 30 35
1 3 5 7 9 11 13 15 17 19 21 23 25 27 29 31 33 35 37 39 41 43 45 47 49 51
Red Trail - Weekly Net Unique Page Views
2.3.5
Visitor feedback survey
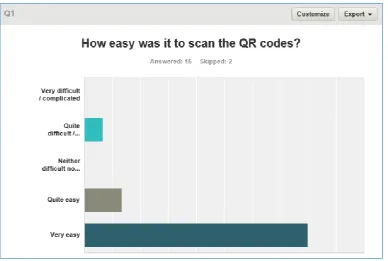
[image:15.595.73.462.171.432.2]Invitations to visitors to give feedback were provided on the webpages associated with each of the posts along the trails. A low return rate made it impossible to validate the Dias technology acceptance model (Figure 2) for the Thatcham situation in a statistically robust way. However the individual survey returns (examples in Figure 11 - 13) were still interesting and indicated generally high levels of satisfaction.
3
Conclusions
3.1
Applying mobile ICT to countryside access
A number of themes emerged in this research that suggest what underpins successful implementations of mobile ICT.
The first theme is that the overarching principles of Technology Acceptance Theory are just as relevant to mobile ICT as they are to other technologies. Apps need a very definite focussed purpose, something that users will perceive as genuinely useful. In contrast, something that attempts to provide a broad brush source of information is too general and not likely to succeed. Ease of use is paramount; anything that is fiddly, complex, or counterintuitive, will inhibit take-up in a much more significant way outdoors than indoors. Enjoyment of the user experience is important too; it needs to complement the real world countryside or wilderness experience, and inspire the user.
The second theme relates to presentation. Attention spans are notoriously short for any kind of broadcast or internet media. Designers of heritage apps understand this very well and they
emphasise the importance of a short and punchy presentation. This principle is equally applicable to almost any kind of mobile ICT support for outdoor recreation.
Finally, high quality content is necessary to grab the attention of users, and it must be relevant to their exact location and what they can see with their own eyes. The technology should be an enabler that facilitates a sense of place, and an engagement with the natural environment.
3.2
The future
There is no doubt that the technology will improve in the future, thereby easing some of the challenges and limitations. Rural mobile coverage is set to improve with operator and government initiatives (e.g. UK Government 2013c). Data rates are going up as 4th generation (4G) technology gradually replaces 3G. Devices are becoming more capable all the time, and even one of the most troublesome issues of outdoor use will get easier when low reflectivity screens transition from military technology into consumer electronics.
Figure 14 - Wearable technology (Google image search)
3.3
Who wants to use a smartphone for outdoor recreation?
Although usage of the Thatcham QR code trails was lower than hoped, nevertheless those that did so indicated that they had a positive experience. The success of navigational apps like Viewranger also attests to solid commercial demand for well-designed ICT products for outdoor recreation.
It is highly likely that demand will increase in time because smartphone ownership is highest in older children and young adults, the generation that has never known a world without the internet (OFCOM 2014). As this cohort passes into middle age, uptake of mobile ICT for countryside access should expand.
In summary, applying mobile ICT to outdoor recreation is not a cure for all ills, but it does have a useful role to play in promoting responsible outdoor recreation and encouraging people to value the natural environment. As time goes by it will become an increasingly useful channel of
communications and information to help protect our precious natural heritage.
4
References
DELOITTE (2013). Exponential rise in consumers’ adoption of the smartphone – can retailers keep pace? Dated 24/6/2013, and last accessed 8/8/14 at:
http://www.deloitte.com/view/en_GB/uk/61d116116757f310VgnVCM1000003256f70aRCRD.htm
CISCO (2014). Cisco Visual Networking Index: Global Mobile Data Traffic Forecast Update, 2013– 2018. White Paper published February 5, 2014. Last accessed 8/8/14 at:
http://www.cisco.com/c/en/us/solutions/collateral/service-provider/visual-networking-index-vni/white_paper_c11-520862.html
UK GOVERNMENT (2013c). Mobile coverage in rural areas set to improve. Press released published by the Department for Culture, Media & Sport dated 13/5/13 and last accessed 8/8/14 at:
https://www.gov.uk/search?q=Mobile+coverage+in+rural+areas+set+to+improve
OFCOM (2014). Communications Market Report 2014. Published 7/8/14 at and last accessed 8/8/14 at: http://stakeholders.ofcom.org.uk/binaries/research/cmr/cmr14/2014_UK_CMR.pdf
5
APPENDIX
How to scan a QR code
using a smartphone
[image:19.595.119.478.436.588.2]Go to the App Store or Play Store on a smartphone or tablet, search for ‘QR reader’, and download a free app. Then scan a QR code as shown in Figure 15.
Figure 15 – How to scan QR codes (Google image search)
PC-based smartphone simulator