Presented at the Universities Transport Study Group Conference, Loughborough, January 2003
Future mobility – it’s about time
Glenn Lyons, Unit for Transport and Society, University of the West of England, BRISTOL BS16 1QY email: [email protected]
Abstract
This paper, with a focus on the UK, considers the potential significance of travel time and more particularly travel time use in the future of mobility. Whilst challenged by some, there is evidence to suggest a constancy in average daily travel time per person. This would broadly explain the observed trend in people travelling further but faster. In transport scheme appraisal, savings in travel time typically represent a substantial proportion of the benefits derived from a scheme – benefits which, through attributed values of unit time, can justify the costs of the scheme in economic terms. Such benefits are founded on the assumption that travel time is unproductive, wasted time. Although travel demand analysis has recognised the interdependency between activities and travel, it still treats travel time and activity time as separate entities. The paper explores these issues before presenting a hypothesis founded upon the belief that travel time can be, and is, being used productively, in effect as activity time and that this is being enhanced by the information age. This has implications for future levels of mobility, the modal distribution of travel and the validity of current transport appraisal methodology. Possible implications are presented and discussed with the intention of subsequent research being pursued than can begin to address the issues and sort through the speculation to provide a clearer, more evidence-based, understanding of travel time use and its consequences.
Introduction
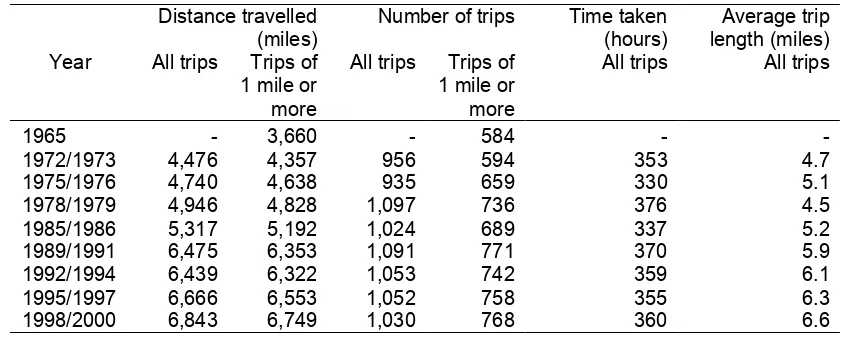
[image:1.595.106.532.551.720.2]The level of mobility in many societies has grown dramatically. Personal travel across modes in the UK, when measured in billion passenger kilometres, increased from 218 in 1952 to 728 in 1999 with an increase in the last decade alone of some 7 per cent (DETR, 2001a). Between 1972 and 2000 (see Table 1) the average annual distance travelled per person in the UK increased by 53 per cent. Over the same period the average number of trips increased by only 8 per cent and the time spent making these trips increased by only 2 per cent (DTLR, 2001). The average time spent travelling appears remarkably stable at around one hour per person per day. Increases in journey speed (achieved by changing modes or because of improvements to the transport system) are responsible for enabling people to travel further – increasing their spatial range of access to people, goods, services and opportunities.
Table 1: Distance, trips and hours travelled per person per year: 1965 to 1998/2000 (DTLR, 2001)
Distance travelled
(miles) Number of trips Time taken(hours) length (miles)Average trip Year All trips Trips of
1 mile or more
All trips Trips of 1 mile or more
All trips All trips
1965 - 3,660 - 584 -
-1972/1973 4,476 4,357 956 594 353 4.7
1975/1976 4,740 4,638 935 659 330 5.1
1978/1979 4,946 4,828 1,097 736 376 4.5
1985/1986 5,317 5,192 1,024 689 337 5.2
1989/1991 6,475 6,353 1,091 771 370 5.9
1992/1994 6,439 6,322 1,053 742 359 6.1
1995/1997 6,666 6,553 1,052 758 355 6.3
The vast majority of increases in mobility have arisen through substantial increases in car use. As at 2001, in terms of total domestic distance travelled, car travel accounted for 85 per cent of the total compared to 6 per cent for rail and 1 per cent for air. However, in terms of the increase in travel by each of these modes over the period 1991-2001, whilst car travel grew by 7 per cent, rail travel increased by 21 per cent and air travel by 60 per cent (DfT, 2002). This would seem to suggest that, particularly as congestion on the road network worsens, the trend in ‘further and faster’ is being bolstered by increased use, particularly for longer distance travel, of the faster modes of rail and air. This appears to be supported by the UK Government’s £180 billion ten-year investment Plan for transport for which “The vision is for journeys that are quicker and more convenient by making it easier to switch between different forms of transport” (DETR, 2000a). Forecasts suggest that, without the Plan, total road traffic between 2000 and 2010 will grow by 22 per cent with congestion increasing by 15 per cent. The aim of the Plan, whilst not to prevent road traffic growth, is to reduce congestion to below current levels. Yet in an analysis of the Plan, Goodwin suggests that if the targets of the Plan are achieved, “a motorist who travelled the same 10,000 miles a year in 2000 and 2010 would save nearly a minute a day, though in practice much of this saving would actually be spent on slightly longer average journey distances.” (Goodwin, 2001). His critique is aptly titled ‘Running to Stand Still’.
From this brief overview of the nature of and trends in travel in the UK it would appear that the future of mobility, in conjunction with the endeavours of current transport policies, is set to see the pursuit of access spread over ever increasing distances. Where this is not being facilitated by measures to improve the capacity and efficient operation of the road network, it is being supported and perhaps encouraged by substantial investment in the capacity and performance of other modes, notably rail and air. If mobility is set to continue increasing, questions must be raised as to whether or not this is a good thing.
Economically, transport connects people to opportunities and hence yields positive benefits. Yet journey time itself is judged in economic terms as wasted time and hence counters the utility of accessing opportunities. In this context alone, the net benefit can be increased if journey times are reduced while maintaining the level of access. This can be achieved by either moving the opportunities closer to the people or by moving the people more quickly to the opportunities. There are also environmental and social consequences of mobility to consider. More mobility, i.e. more people travelling further and faster, generates more consumption of natural resources and more pollution. Technological advances in lean manufacturing, vehicle and engine design and alternative fuels can limit or reduce adverse environmental impacts. Nevertheless, the social consequences of increasing mobility remain. Adams suggests that making reference to increases in the distance the average person travels masks a growing disparity amongst the population (Adams, 1999). Those who lie below the average may not be able to afford higher levels of mobility. Their spatial range of access may be constrained by mobility afforded by walking, cycling and public transport. This extent of access is being eroded by changes in land use patterns that arise from those above the average having greater spatial ranges, afforded notably by car use. A typical illustration of this is the disappearance of local shops and amenities resulting from larger and more financially successful centralised substitutes that are often further away, with a dependence on the car for access. The quality of local existences can therefore be reduced. Those able to afford mobility can overcome this problem unlike those who cannot who then suffer from mobility-related social exclusion (Kenyon et al, 2002). What, then, of community? The dictionary definition of ‘community’ refers to either people living in one locality or a group of people having characteristics in common. Increasing mobility, i.e. increasing spatial range, is seemingly eroding the former type of community and leaving society increasingly with the latter – groups of people who are spatially scattered and who keep in touch through a combination of high levels of mobility and, increasingly, the use of telecommunications.
accepted convention of activity time and travel time being interdependent yet discrete is highlighted. The paper then puts forward a hypothesis concerning travel time use and its potential consequences. Finally, implications of the hypothesis for future mobility are discussed.
Travel time budget
“People spend somewhat more than one hour per day travelling, on average (travel time budget), despite widely differing transportation infrastructures, geographies, cultures and per capita income levels.” (Schafer, 1998). The notion that a travel time budget which exists and which is stable over time and space and which is independent of mode of travel remains a subject of academic debate with proponents both for and against. The notion itself was recognised at least as far back as the 1970s and various pieces of empirical work have sought to confirm the phenomenon including that by Schafer (1998). The appeal of the potential existence of a fixed travel time budget is that it can aid the accuracy of projections of future (total) mobility and the share for each mode. If a limit to journey speed is reached or can be enforced, then it also suggests that total mobility might eventually plateau – something which, whilst not necessarily positive in economic terms, would intuitively appear a desirable future state with regard to environmental and social considerations.
It is important to recognise that the constancy of travel time budget is assumed to apply at the aggregate level. Once behaviour at levels of disaggregation is examined then variations become apparent. For example, Schafer and Victor (2000) cite findings for the UK which showed that Londoners spend 30 per cent more time travelling than people living in Scotland.
Höjer and Mattsson (2000) offer a critique of the travel time budget. Firstly they cite three theoretical explanations of why travel time should be constant:
1. Biological programming – this presupposes that people desire a degree of stability in habit and behaviour in their daily lives and as a result evolution has left us biologically programmed to spend a fixed amount of time on travel.
2. Utility maximisation – people seek to maximise the net of the utility gained by what is reached through travel and the disutility of the travel necessary to reach it. As a result an optimum is found that reconciles increasing travel time to access a larger supply of activities with the reduction in time to undertake such activities caused by increased travel times.
3. Social routine – everyday life is full of settled routines of which travel becomes a part. A day can be divided into time for: sleep and personal care; eating; working; shopping and service activities; leisure and travel. Attributing typical values to these divisions renders it not surprising that the average time devoted to travel is about 1.5 hours.
They then challenge each of these in turn:
1. Biological programming – How could our programming have been able to account for mechanised modes that until recently did not exist and why are individuals’ programmes so different albeit that the average might be constant?
2. Utility maximisation – The optimum travel time will in practice be heavily dependent on the location-specific availability of activity centres and the means of travel used yielding different values for different individuals.
3. Social routine – this notion in itself cannot substantiate a constancy of travel time over time and individual circumstance, for example 20th century man and 19th century woman are not comparable.
Finally they caution against the danger of generalising, i.e. claiming the validity of the argument for people in general. There is a tendency to deduce a general law from an average and then to imply that the average becomes the norm. It is suggested that all three theoretical explanations above concern the individual and in turn are inadequate for explaining the vast differences between individuals.
hypothesis has been offered by Mokhtarian and Salomon (2001). They suggest “the existence of an unobserved desired level of mobility, that varies both across individuals and within the same individuals across time. Rather than uniformly trying to minimise travel, people seek to decrease their travel if it exceeds the desired optimum, but seek to increase travel if it falls short of their ideal amount.” The context for this hypothesis is referred to later in this paper.
The transport policy approach to travel time
Appraisal of transport schemes in the UK
Transport system interventions are typically intentional changes to transport supply, i.e. the capacity, availability and usage cost of the transport network. Historically, interventions have most commonly concerned the building of new infrastructure, notably new highway construction. Before a decision is taken to proceed with an intervention, the proposed intervention must be appraised. In the UK in 1998 the then Department for the Environment, Transport and the Regions (DETR) developed the New Approach to Appraisal (NATA – DETR, 1998). The purpose of NATA is to provide advice on prioritising and choosing between different options for solving the same problem. Appraisal is centred upon the five objectives of environment, safety, economy, accessibility and integration. It is largely based on two key components - the Cost Benefit Analysis (CBA) and the Environmental Impact Assessment (EIA). Since the 1970s the UK Government has been using its COBA computer program to undertake the CBA of road schemes. More recently a new computer program has been developed called ‘TUBA’ (Transport Users Benefit Appraisal) to undertake an economic appraisal for a multi-modal transport study (DETR, 2001b). In 2000 the UK Government produced its ‘Guidance on the Methodology for Multi-Modal Studies’ (GOMMMS – DETR, 2000b). This document sets out a revised version of NATA which is suitable for the appraisal of all transport projects, including highway projects.
In appraisal, calculation of transport user (dis)benefits is based on (DETR, 2000b):
- changes in travel time;
- changes in user charges, including fares, tariffs and tolls; and
- changes in vehicle operating costs met by the user.
In an investigation into links between transport and the economy (DETR, 1999) it was noted that “Travel time savings are the single most important component in the measured transport benefits/disbenefits of most schemes and policies. Hence the methods of valuing them critically affect the measurement of the economic impacts of schemes.”.
Valuation of travel time
In appraisal it is assumed that “time spent travelling during the working day is a cost to the employer’s business. It is assumed that savings in travel time convert non-productive time to productive use and that, in a free labour market, the value of an individual’s working time to the economy is reflected in the wage rate paid.” (DETR, 2000b). GOMMMS further notes that “changes in travel time on employer’s business are valued the same whatever the stage of the journey is involved, i.e. there is no weighting applied to take account of the reluctance of passengers to walk to/from or wait for transport services. This is because the time spent or saved is assumed to be lost or gained in productive working time – the travel activity taking up the time is therefore deemed irrelevant.” (DETR, 2000b). Values of time disaggregated by modal group are used in appraisal and are based on National Travel Survey data on the incomes of working travellers on each mode.
non-work journeys “waiting for public transport and all walking and cycling (whether in connection with a journey by a motorised mode or not) should adopt a value which is double the standard in-vehicle value” (DETR, 2000b). The majority of journeys take place in non-working time and consequently “time savings to travellers in their own time typically make up a large proportion of the benefits of transport investment”.
This approach to the treatment of the valuation of travel time in appraisal ”has been the practice in the UK since the earliest transport cost benefit analyses in the 1960s” (DETR, 1999). The latest values of time are shown in Table 2.
Table 2: Values of Time per Person (£/hour, average 1998 values) (Taken from the Transport Economics Note (DETR, 2001c))
Resource Cost (£/hour) Working Time:
car driver 17.44
car passenger 13.69
PSV (bus) passenger 11.09
taxi passenger 23.74
rail passenger 25.17
underground passenger 21.15
walker 24.01
cyclist 11.98
motorcyclist 9.41
Non-Working Time:
standard appraisal value 4.52
Values of time are addressed in both modelling and appraisal. Behavioural values are used in the modelling process to ensure that people’s perceptions are correctly represented (DETR, 1999). The modelling process establishes the patterns of travel, by mode, which take place. Such patterns are influenced by responses from travellers to changes in the ‘cost’ of travel. In turn vehicle or passenger flows estimated by the modelling are used in the economic appraisal of scheme options.
Generalised travel cost (Ortúzar and Willumsen, 1994) varies by mode and is typically treated as a combination of the various components of a journey. For cars, generalised cost is a combination of (DETR, 1999):
- in-vehicle travel time; operating costs (related to distance travelled);
- parking ‘costs’ (which notionally include time spent searching and queuing for a space and walking to the final destination); and
- tolls or congestion charges.
For public transport users, generalised cost is a combination of (DETR, 1999):
- walking time from the origin to a stop or station (usually weighted relative to in-vehicle time by a factor of about two);
- waiting time for the service (again usually weighted relative to in-vehicle time by a factor of about two);
- fare;
- in-vehicle time;
- penalty representing the inconvenience of changing between services; and
Travel time and activity time
The treatment of travel time above in terms of appraisal is straightforward in that it identifies travel purely as wasted time and implicitly as discrete from the activities that are undertaken which give rise to the travel. Traditionally, modelling approaches, whilst incorporating differences in the behavioural valuation of time, nevertheless treat the time spent travelling in isolation from any consideration of time spent undertaking activities. In other words a trip-based approach has been adopted. More than 20 years ago an alternative (modelling) approach became the subject of research. This is known as the activity-based approach because it is based on the idea that travel demand arises, or is derived, from the desire or need to participate in activities – “the development of the activity-based approach to travel demand analysis is characterized by a desire to understand the phenomenon of urban travel, not merely to develop predictive models that appear to produce acceptable forecasts.” (Pas, 1996). The activity-based approach acknowledges that daily patterns of travel are shaped around and dictated by the concurrent planning of activity schedules. The activity-based approach holds the prospect of more realistic representation of patterns of travel in time and space. Nevertheless, the approach treats travel time and activity time as separate entities albeit with assumed interdependencies.
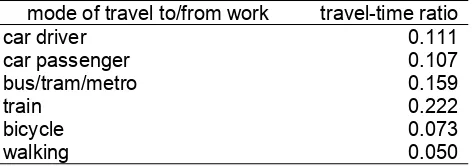
[image:6.595.161.397.477.560.2]Schwanen and Dijst (2002) have considered the relationship between activity duration and travel time or more specifically the relationship between commuting time and work duration based on data from the 1998 Dutch National Travel Survey. The assumption is made that individuals balance travel time and activity duration leading to the notion of a planned or realised travel-time ratio, defined as “the ratio between travel time and the sum of travel time and activity duration.” Whilst an average travel-time ratio is determined from their research it is found that variation around the average value is considerable. The authors nevertheless believe that a maximum tolerable travel-time ratio exists for workplace visits. Whilst the need for more precise quantification is acknowledged they suggest that “for individuals visiting the workplace for more than 4 h, the maximum travel-time ratio may be at a level of 0.20-0.25. In other words, individuals in the longer term might not be prepared to spend more than one-fourth of time available for commuting and working on travelling to and from the workplace.” Table 3 shows the overall values of travel-time ratio by mode found in this study. What is noticeable, and the authors themselves suggest the reasons behind it merit further research, is that people accept (considerably) higher travel-time ratios when travelling by public transport compared to when travelling by car.
Table 3: Travel-time ratio concerning commuting time and work duration by mode (Schwanen and Dijst, 2002)
mode of travel to/from work travel-time ratio
car driver 0.111
car passenger 0.107
bus/tram/metro 0.159
train 0.222
bicycle 0.073
walking 0.050
The hypothesis
Having set a context and highlighted some current conventions, the following hypothesis is now put forward:
The boundaries between travel time and activity time are increasingly blurred. Specifically, many people are using travel time itself to undertake activities. The ‘cost’ to the individual of travel time is reduced as travel time is converted into activity time. In turn, at the aggregate level, less of the travel time budget is used, enabling more travel or encouraging greater use of modes that best enable en-route activities to be undertaken.
hypothesis still points towards the productive use of travel time enabling the level of mobility to increase even further.
It is suggested that this hypothesis is becoming increasingly significant as we move further into the information age and devices are developed to meet our ‘any place, any time’ lifestyles. Mobile phones aptly illustrate this. They are used not only to talk to people but to send and receive text messages and to access the Internet and have seen a sharp increase in ownership. “The proportion of households with at least one mobile telephone (either pay as you go or subscription) has almost tripled from 17 per cent in 1996-97, to 47 per cent in 2000-01. Mobile phone ownership is related to income. In 2000-01, over two thirds of people in the top income group had a mobile phone compared with under a quarter of those in the bottom group. However, while ownership has grown in all groups, the rate of increase has been highest in the lowest income group.” (ONS, 2002). Laptop and palmtop computers have also increased in terms of their capabilities and their affordability. The hypothesis is further illustrated by the fictitious scenarios described in Figure 1.
The evolution of the evening commute 1995
John’s 8 mile drive home from work is a journey which takes at most 35 minutes. Thoughts about work and listening to the Drive Time radio show help to pass the time. A typical weekday evening sees him arrive home at 6.00pm in time to watch the news on TV before enjoying a gin and tonic and a chat about the day’s events with his wife. He deals with a few bits of paperwork before settling into a good book for half and hour. He then helps his wife with the remaining preparations for a pleasant evening meal. Listening to music and some light-hearted conversation draw the evening to a close.
2005
John’s place of work is no longer a convenient car journey away. Having moved job again two years ago he now has a 90-minute train journey in order to get home each evening. The train departs at 5.30pm. Typically John unwinds for half an hour reading the daily paper. At 6.00pm he switches on his laptop computer complete with TV receiver and watches the news. Half an hour later he calls his wife on the mobile to chat about the day’s events. Out with the gin and tonic to accompany sending a few work-related and personal emails and then the journey is over. 15 minutes later he pulls the car into the drive having collected a takeaway meal for two which was ordered during the train journey. He talks with his wife as they eat and then they relax in the living room to see out the evening sharing each other’s company.
For John and his wife, life doesn’t seem particularly more difficult than before. Sure, it costs John rather more to commute to and from work but that is easily covered by his increase in salary with the job change and is certainly preferable to the prospect of moving house and home to be near the new job.
Figure 1: A past and future fictitious scenario of the evening commute as the information age advances
The notion that travel time is not, necessarily, wasted time and may indeed be construed in part as activity time has received little attention in the research literature to date. However, identification of the issues underlying the hypothesis is not entirely novel. A notable consideration of travel time use, accompanied by some empirical work in the US, is provided by Mokhtarian and Salomon (2001) (and is also touched upon in some of their earlier work (Salomon and Mokhtarian, 1997)). They suggest that positive utility is gained from one or more of three elements of a journey to a given destination:
Taken in isolation, the first of these adheres to conventional wisdom in transport modelling and appraisal – ideally the individual traveller would forego travelling to the destination if this were possible. The second element reflects the potential utility of activities that can be undertaken while on the move – the issue central to the hypothesis above. Mokhtarian and Salomon note that some examples of this might be termed “anti-activity” (i.e. “the ability to use the time for relaxing or thinking, including ‘shifting gears’ mentally between origin and destination activities and roles”). The third element they describe as “a consequence of intrinsic aspects of travel itself…the sensation of speed, movement through and exposure to the environment, the scenic beauty or other attraction of a route.” They go on to define excess travel as “that portion of travel that is prompted by the second and third elements of an affinity for travel, that is any travel not derived from the utility of the destination itself.” Whilst they point to the difficulty of being able to disentangle the three elements and to identify their relative weightings, their mailback questionnaire survey (with 1900 responses) yielded some revealing results: “nearly half [of respondents] disagree that travel time is generally wasted time. More than a third see their commute trip as a useful transition, and use that time productively. With respect to travelling itself, more than two-thirds of the respondents disagree that ‘the only good thing about travelling is arriving at your destination’, and nearly half agree that ‘getting there is half then fun’.”
A study for Transport 2000 (2002) into UK rail, considered the potential economic value of rail journey time in the course of business travel if it is recognised that some of that time can be used productively. It notes that in 2001, nearly 200 million business and personal business trips were made on the rail network. A conservative calculation of the economic benefit that arises from being able to work whilst travelling by train is made. In so doing it is assumed that “every rail business traveller on strategic routes undertakes one hour of productive work on each business journey – a not unreasonable assumption given that a typical rail journey from Newcastle to London will take 3 hours, Manchester to London 2 ½ hours and Cardiff to London 2 hours“. Based on this assumption, the value to the economy of this work time would be £731m per year. This study is a rare example in which the lack of consideration of usefulness of travel time in appraisal of transport projects is challenged. This said, the same study also highlights the present problem of overcrowding (at certain times of day and on certain routes) on trains: “Estimates put the total seating capacity of trains into London in the morning peak at about 355,000. This indicates the excess of passengers over seating (2000 figures) at 111,900 – about 32%”. It is estimated that to remove all standing on trains due to current overcrowding (a necessary prerequisite to be able to maximise the productivity of travel time) would require capital investment in rolling stock of £1.3 billion.
Implications of the hypothesis for transport and society
This paper seeks to draw together current understanding on, and interpretation of, travel time from the literature and to raise for further consideration the notion that travel time can and is being used productively and therefore has implications for travel behaviour and transport policy. Initial empirical work by Mokhtarian and Salomon in the US is welcome but this notion requires further research and, in terms of empirical evidence, UK-based research. This final section of the paper sets out and briefly considers a series of questions that arise from the hypothesis and which subsequent research might address.
Excess travel - to what extent is it and could it be significant?
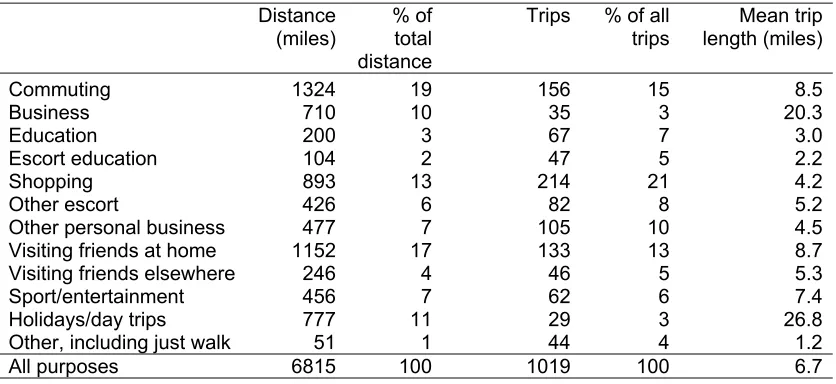
least for the foreseeable future) must attend to the mental and physical requirements of controlling the vehicle. Yet the ‘Drive Time’ evening radio shows are testament to the popularity of listening to the radio as an activity during the car journey home from work. The significance of travel time use will also relate to whether it takes place in work time or non-work time, with the latter having substantially less effect in terms of the economy. Another issue is the extent to which productive travel time use is already happening and influencing choices and patterns of travel and the extent to which it might increase in the future with addition and perhaps greater effects on travel patterns. Arguably, productive travel time use has greatest relevance to commuting and business travel. Firstly because of their impact on the economy and secondly because they typically involve much longer distances than some other journey purposes such as shopping and education. Business travel accounts for only 3 per cent of all trips but 10 per cent of total distance travelled with a mean trip length of 20.3 miles. Commuting accounts for 15 per cent of all trips and 19 per cent of total distance travelled with a mean trip length of 8.5 miles (see Table 4).
Table 4: Distance and trips per person per year by journey purpose (1999/2001) (DfT, 2002)
Distance (miles)
% of total distance
Trips % of all trips
Mean trip length (miles)
Commuting 1324 19 156 15 8.5
Business 710 10 35 3 20.3
Education 200 3 67 7 3.0
Escort education 104 2 47 5 2.2
Shopping 893 13 214 21 4.2
Other escort 426 6 82 8 5.2
Other personal business 477 7 105 10 4.5
Visiting friends at home 1152 17 133 13 8.7
Visiting friends elsewhere 246 4 46 5 5.3
Sport/entertainment 456 7 62 6 7.4
Holidays/day trips 777 11 29 3 26.8
Other, including just walk 51 1 44 4 1.2
All purposes 6815 100 1019 100 6.7
Should excess travel be accounted for in appraisal?
At present, in economic terms, for a given saving in travel time resulting from a proposed transport scheme, the size of the associated monetary benefit depends upon the value of time. At the extreme, travel time could be productively used such that no time is wasted and hence the monetary benefit of any saved travel time would be zero. In practice any degree of excess travel will reduce the monetary benefit whilst the cost of the scheme will remain unaffected. Consequently a scheme that, under the current appraisal framework, showed a benefit-cost ratio of greater than one, might, when taking account of excess travel, show a benefit-cost ratio of less than one. The result could be that such a scheme is not taken forward. On the other hand, taking account of travel time productivity should result in the relative value of time for travel by car compared to public transport increasing (i.e. only a proportion of unit time spent on public transport would be ‘wasted’ and hence costed). Hence transport schemes able to cause mode shift from car to public transport would not only yield benefits from reduced delay to other car users but through reduced wasted travel time by those switching to public transport.
Should the working day begin at the start of the journey?
work than individuals using other modes. Therefore, implicitly it may already be the case that employers and employees are consciously blurring the accepted boundary between the commute and time spent at work. To some degree this would further raise issues concerning appraisal – if the working day begins when one boards the train then it cannot be appropriate in appraisal to class such time as non-work time and reduce its value. Nor, in turn, is it acceptable to judge any saving in such commute time as a monetary benefit (or at least not to the extent that would currently be the case).
If employers were able to formally acknowledge in certain circumstances that commuting by collective transport enabled equivalent work per unit time to be completed during the journey as would be completed at work, then this could have implications for both staff morale and retention and choice of travel mode for commuting. An employee with a one hour commute each way by rail might be entitled to class the two hours of travel as part of their eight-hour working day. That same employee would lose two hours of non-work time each weekday if they chose instead to travel to work by car. Assuming spare rail capacity existed then this could prove a powerful incentive for change of mode for the commute trip.
Should productive travel time be kerbed?
The notion of productive travel time use could have potential long term impacts analogous to those of part-time homeworking, namely to encourage urban sprawl and to trigger workplace or home relocations that result in longer journey distances. In other words, much as information and communications technology (ICT) has the prospect of replacing physical travel it has equal and arguably greater prospect to reduce the disutility of physical travel, thereby augmenting rather than replacing or reducing physical travel.
There is a distinction to be made between the productive use of travel time to compensate for a hitherto excessive commute trip duration and the influence of the prospect of productive travel time use on relocation decisions that in turn results in longer commute trip durations. In the case of the former productive use of travel time can be seen in a positive light through its potential improvement in the quality of life of the individual concerned. However, in the case of the latter it is likely to be a chosen state of existence. As discussed earlier, there are others in society who will not have that choice either because of the lack of availability of suitable modes to enable productive travel time use or because they cannot afford to use such modes or at least to do so for journeys of longer duration.
If one were to subscribe to the belief that ever increasing mobility is a bad thing for society then it might be tempting to proffer the suggestion that steps should be taken to ensure that travel time cannot be put to productive use, thereby removing any positive utility that could be derived from it. This would restore the attraction of accessing activity centres that are in closer proximity. Yet this would seem nonsensical – we surely would not wish to consciously waste time in this way – after all, wasted time cannot be recycled. What might instead be considered is a means to discourage the temptation to ‘reinvest’ travel time that has been converted into activity time in travelling further and for longer periods. The most evident means of discouragement, though with its own problems of inequity, would be to increase the monetary cost of travel, particularly where it targets excess travel. Yet this in turn would suggest that those collective modes that facilitate excess travel would be rendered (even) more expensive than car travel.
How important is the information age to the hypothesis?
developments such replication was not possible, perhaps thereby substantially limiting the extent to which travel time could be productively used as work time. Drivers of the future may also enjoy the opportunity of increased productivity of travel time thanks to ICT. If the vision of the automated highway were to be realised then technology would take over some or all of the driving tasks allowing the (single) occupant of the vehicle to make use of in-car technologies such as Internet access and video. Is there an opportunity for collective transport to exploit?
[image:11.595.189.466.284.472.2]Collective transport operators show some signs of action to capitalise on the potential advantage they have over the car in terms of productive use of travel time. The newspaper advertisement shown in Figure 2 aptly illustrates this. The new Virgin Voyager trains have power points for laptops in standard class as well as first class. In short, longer durations of travel by collective transport compared to the car need not be as decisive a factor in mode choice decisions in favour of the car if people’s awareness of the opportunity to use travel time productively is raised. Indeed there may also be a need for innovation and support in identifying new technological developments, vehicle designs and travel time use techniques and practices that can aid and encourage individuals to experiment with their use of time within the travel environment.
Figure 2: Newspaper advertisement by train operating company (GNER)
The paper provides more questions than answers but seeks to raise awareness of what could be an important consideration for future mobility. Further research is needed than can begin to address the questions and sort through the speculation to provide a clearer, more evidence-based, understanding of travel time use and its consequences.
References
Adams, J. (1999). The social implications of hypermobility. Report for OECD Project on Environmentally Sustainable Transport, Paris, 1999.
BARB (2002). TV viewing figures from the Broadcasters Audience Research Board Ltd website. Available at http://www.barb.co.uk [accessed 21/11/02].
DETR (1998). Guidance on the New Approach to Appraisal. Department for the Environment, Transport and the Regions, September, TSO, London.
DETR (1999). Transport and the Economy. The Standing Advisory Committee on Trunk Road Assessment, October, TSO, London.
DETR (2000a). Transport 2010: The Ten Year Plan – Summary. Department for the Environment, Transport and the Regions, July, TSO, London.
DETR (2000b). Guidance on the Methodology for Multi-Modal Studies. Department for the Environment, Transport and the Regions, May, TSO, London.
DETR (2001b). TUBA User Manual. Department for the Environment, Transport and the Regions, March, TSO, London.
DETR (2001c). Transport Economics Note. Department for the Environment, Transport and the Regions, April, TSO, London.
DfT (2002). Transport Statistics Great Britain: 2002 Edition. Department for Transport, October, TSO, London.
DTLR (2001). Focus on Personal Travel: 2001 Edition. Department for Transport, Local Government and the Regions, December, TSO, London.
Goodwin, P. (2001). Running to stand still? CPRE.
Höjer, M. and Mattsson, L.-G. (2000). Determinism and backcasting in future studies. Futures, 32, 613-634.
Kenyon, S., Lyons, G. and Rafferty, J. (2002).Transport and social exclusion: investigating the possibility of promoting inclusion through virtual mobility. Journal of Transport Geography, 10(3), 207-219.
Mokhtarian, P.L. and Salomon, I. (2001). How derived is the demand for travel? Some conceptual and measurement considerations. Transportation Research A, 35, 695-719.
ONS (2002). Ownership of mobile phones: by income quintile group, 1996-97 and 2000-01. Social Trends 32. Office for National Statistics.
Ortúzar, J. de D. and Willumsen, L.G. (1994) Modelling Transport. Wiley.
Pas, E.I. (1996). Recent Advances in Activity-Based Travel Demand Modelling. Proc. Activity-Based Travel Forecasting Conference, USDOT.
Salomon, I. and Mokhtarian, P.L. (1997). Coping with Congestion: Understanding the Gap Between Policy Assumptions and Behavior. Transportation Research D, 2(2), 107-123.
Schafer, A. (1998). The Global Demand for Motorized Mobility. Transportation Research A, 32(6), 455-477.
Schafer, A. and Victor, D.G. (2000). The future mobility of world population. Transportation Research A, 34, 171-205.
Schwanen, T. and Dijst, M. (2002). Travel-time ratios for visits to the workplace: the relationship between commuting time and work duration. Transportation Research A, 36, 573-592.
Transport 2000 (2002). The Case for Rail. July, Transport 2000.