R E S E A R C H
Open Access
Complex temporal topic evolution
modelling using the Kullback-Leibler
divergence and the Bhattacharyya distance
Victor Andrei and Ognjen Arandjelovi´c
*Abstract
The rapidly expanding corpus of medical research literature presents major challenges in the understanding of previous work, the extraction of maximum information from collected data, and the identification of promising research directions. We present a case for the use of advanced machine learning techniques as an aide in this task and introduce a novel methodology that is shown to be capable of extracting meaningful information from large
longitudinal corpora and of tracking complex temporal changes within it. Our framework is based on (i) the
discretization of time into epochs, (ii) epoch-wise topic discovery using a hierarchical Dirichlet process-based model, and (iii) a temporal similarity graph which allows for the modelling of complex topic changes. More specifically, this is the first work that discusses and distinguishes between two groups of particularly challenging topic evolution phenomena: topic splitting and speciation and topic convergence and merging, in addition to the more widely recognized emergence and disappearance and gradual evolution. The proposed framework is evaluated on a public medical literature corpus.
Keywords: Topic modelling, Dirichlet process, Bayesian, Temporal graph, Hierarchical model
1 Introduction
Recent years have witnessed a remarkable convergence of two broad trends. The first of these concerns infor-mation, i.e. data, rapid technological advances coupled with an increased presence of computing in nearly every aspect of daily life, have for the first time made it possi-ble to acquire and store massive amounts of highly diverse types of information. Concurrently and in no small part propelled by the environment just described, research in artificial intelligence—in machine learning [3–5, 8], data mining [14], and pattern recognition, in particular—has reached a sufficient level of methodological sophistication and maturity to process and analyse the collected data, with the aim of extracting novel and useful knowledge [7, 14–16]. Though it is undeniably wise to refrain from overly ambitious predictions regarding the type of knowl-edge which may be discovered in this manner, at the very
*Correspondence: [email protected]
School of Computer Science, University of St Andrews, St Andrews KY16 9SX, Fife, Scotland, UK
least, it is true that few domains of application of the afore-said techniques hold as much promise and potential as that of medicine and health in general.
Large amounts of highly heterogeneous data types are pervasive in medicine. Usually the concept of so-called big data in medicine is associated with the analysis of Elec-tronic Health Records [6, 7, 9, 21, 40, 41, 43], large scale sociodemographic surveys of death causes [37], clinical epidemiological [17, 23, 36] and pharmacoepidemiolog-ical studies [28, 35, 42], as well as in the analysis of pharmacovigilance [22, 29, 32], health-related economic effects [11, 20], and public health [18, 27, 30, 34]. Much less discussed and yet arguably no less important realm where the amount of information presents a challenge to the medical field is the medical literature corpus itself. Namely, considering the overarching and global impor-tance of health (to say nothing of practical considerations such as the availability of funding), it is not surprising to observe that the amount of published medical research is immense and its growth is only continuing to acceler-ate. This presents a clear challenge to a researcher. Even
restricted to a specified field of research, the amount of published data and findings makes it impossible for a human to survey the entirety of relevant publications exhaustively which inherently leads to the question as to what kind of important information or insight may go unnoticed or insufficiently appreciated. The premise of the present work is that advanced machine learning techniques can be used to assist a human in the analysis of this data. Specifically, we introduce a novel algorithm based on Bayesian non-parametric inference that achieves this goal.
1.1 Previous work
A limitation of most models described in the existing lit-erature lies in their assumption that the data corpus is static. Here the term ‘static’ is used to describe the lack of any associated temporal information associated with the documents in a corpus—the documents are said to be exchangeable [19]. However, research articles are added to the literature corpus in a temporal manner and their ordering has significance. Consequently, the topic struc-ture of the corpus changes over time [12, 13, 24]: new ideas emerge, old ideas are refined, novel discoveries result in multiple ideas being related to one another thereby form-ing more complex concepts or a sform-ingle idea multifurcatform-ing into different ‘sub-ideas’, etc. The premise in the present work which expands on our preliminary contributions described in [1, 2] is that documents are not exchange-able at large temporal scales but can be considered to be at short time scales, thus allowing the corpus to be treated astemporally locally static.
2 Methods
In this section, we introduce our main technical contribu-tions. We begin by reviewing the relevant theory under-lying Bayesian mixture models and then explain how the proposed framework employs these for the extraction of information from temporally varying document corpora.
2.1 Bayesian mixture models
Mixture models are appropriate choices for the mod-elling of the so-called heterogeneous data whereby het-erogeneity is taken to mean that observable data is generated by more than one process (source). The key challenges lie in the lack of observability of the corre-spondence between specific data points and their sources and the lack of a priori information on the number of sources [38].
Bayesian non-parametric methods place priors on the infinite-dimensional space of probability distributions and provide an elegant solution to the aforementioned modelling problems. Dirichlet Process (DP) in particular allows for the model to accommodate a potentially infinite number of mixture components [25]:
p(x|π1:∞,φ1:∞)= ∞
k=1
πkf (x|φk). (1)
where DP(γ,H) is defined as a distribution of a random probability measure G over a measurable space (,B), such that for any finite measurable partition (A1,A2,. . .,Ar) of the random vector (G(A1),. . .,G(Ar)) is a Dirichlet distribution with parameters(γH(A1),. . .,γH(Ar)). A Dirichlet process mixture model (DPM) is obtained by associating differ-ent mixture compondiffer-ents with atoms φk and assuming
xi|φk iid
∼ f(xi|φk) wheref (.) is the kernel of the mixing components [33].
2.1.1 Hierarchical DPMs
While the DPM is suitable for the clustering of exchange-able data in a single group, many real-world problems are more appropriately modelled as comprising multiple groups of exchangeable data. In such cases, it is desir-able to model the observations of different groups jointly, allowing them to share their generative clusters. This ‘sharing of statistical strength’ emerges naturally when a hierarchical structure is implemented.
The DPM models each group of documents in a col-lection using an infinite number of topics. However, it is desirable for multiple group-level DPMs to share their clusters. The hierarchical DP (HDP) [39] offers a solution whereby base measures of group-level DPs are drawn from a corpus-level DP. In this way, the atoms of the corpus-level DP are shared across the docu-ments; posterior inference is readily achieved using Gibbs sampling [39].
2.2 Modelling topic evolution over time
We now show how the described HDP based model can be applied to the analysis of temporal topic changes in a longitudinaldata corpus.
Owing to the aforementioned assumption of a tempo-rally locally static corpus, we begin by discretizing time and dividing the corpus into epochs. Each epoch spans a certain contiguous time period and has associated with it all documents with timestamps within this period. Each epoch is then modelled separately using a HDP, with mod-els corresponding to different epochs sharing their hyper-parameters and the corpus-level base measure. Hence if n is the number of epochs, we obtain n sets of topics
φ = φt1,. . .,φtn
whereφt = φ1,t,. . .,φKt,t
is the set of topics that describe epocht, andKttheir number.
2.2.1 Topic relatedness
disappearance of others. More subtly, we are also inter-ested in how a specific topic changes, that is, how it evolves over time in terms of the contributions of different words it comprises. Lastly, our aim is to be able to extract and model complex structural changes of the underlying topic content which result from the interaction of topics. Specifically, topics, which can be thought of as collections of memes, can merge to form new topics or indeed split into more nuanced memetic collections. This information can provide valuable insight into the refinement of ideas and findings in the scientific community, effected by new research and accumulating evidence.
The key idea behind our tracking of simple topic evo-lution stems from the observation that while topics may change significantly over time, changes between succes-sive epochs are limited. Therefore, we infer the continuity of a topic in one epoch by relating it to all topics in the immediately subsequent epoch which are sufficiently sim-ilar to it under a suitable simsim-ilarity measure—we adopt the well-known Bhattacharyya distance (BHD):
ρBHD(p,q)= −ln i
p(i)q(i) (2)
wherep(i)andq(i)are two probability distributions. This approach can be seen to lead naturally to a similarity graph representation whose nodes correspond to topics and whose edges link those topics in two epochs which are related. Formally, the weight of the directed edge that links φj,t, thejth topic in epocht, andφk,t+1isρBHD
φj,t,φk,t+1
whereρBHDdenotes the BHD.
In constructing a similarity graph a threshold is used to eliminate automatically weak edges, retaining only the connections between sufficiently similar topics in adjacent epochs. Then, the disappearance of a particular topic, the emergence of new topics, and gradual topic evolution can be determined from the structure of the graph. In par-ticular, if a node does not have any edges incident to it, the corresponding topic is taken as having emerged in the associated epoch. Similarly, if no edges originate from a node, the corresponding topic is taken to vanish in the associated epoch. Lastly, when exactly one edge originates from a node in one epoch and it is the only edge incident to a node in the following epoch, the topic is understood as having evolved in the sense that its memetic content may have changed.
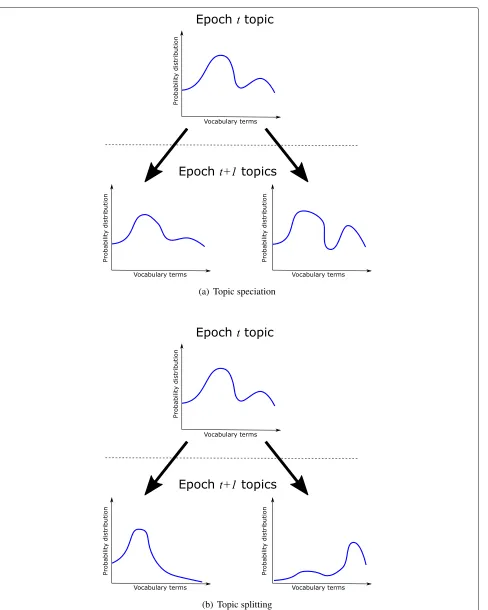
A major challenge to the existing methods in the litera-ture concerns the detection of topic merging and splitting. Since the connectedness of topics across epochs is based on their similarity, what the previous work describes as ‘splitting’ or indeed ‘merging’ does not adequately cap-ture these phenomena. Rather, adopting the terminology from biological evolution, a more accurate description would be ‘speciation’ and ‘convergence’, respectively. The former is illustrated in Fig. 1a whereas the latter is entirely
analogous with the time arrow reversed. What the con-ceptual diagram shown illustrates is a slow differentiation of two topics which originate from the same ‘parent’. Actual topic splitting, which does not have a biological equivalent in evolution, and which is conceptually illus-trated in Fig. 1b, cannot be inferred by measuring topic similarity. Instead, in this work, we propose to employ the Kullback-Leibler divergence (KLD) for this purpose. The divergenceρKLD(p,q)is asymmetric, and it measures the amount of information lost in the approximation of the probability distributionp(i)withq(i). KLD is defined as follows:
ρKLD(p,q)=
i
p(i)lnp(i)
q(i) (3)
It can be seen that a high penalty is incurred whenp(i) is significant and q(i) is low. Hence, we use the BHD to track gradual topic evolution, speciation, and conver-gence, while the KLD (computed both in forward and backward directions) is used to detect topic splitting and merging.
2.2.2 Automatic temporal relatedness graph construction Another novelty of the work first described in this paper concerns the building of the temporal relatedness graph. We achieve this almost entirely automatically, requiring only one free parameter to be set by the user. Moreover, the meaning of the parameter is readily interpretable and understood by a non-expert, making our approach highly usable.
Our methodology comprises two stages. Firstly, we con-sider all inter-topic connections present in the initial fully connected graph and extract the empirical estimate of the corresponding cumulative density function (CDF). Then, we prune the graph based on the operating point on the relevant CDF. In other words, ifFρis the CDF correspond-ing to a specific initial, fully connected graph formed using a particular similarity measure (BHD or KLD), and ζ ∈[ 0, 1] the CDF operating point, we prune the edge between topicsφj,tandφk,t+1iffρ(φj,t,φk,t+1) <Fρ−1(ζ).
3 Evaluation and discussion
We now analyse the performance of the proposed frame-work empirically on a large real-world data set.
3.1 Evaluation data
Berardinelli et al. [10] on MetS. We collected all match-ing publications up to the final one indexed by PubMed on 10 May 2015, yielding a corpus of 22,508 publications on ASD and of 31,706 on MetS. We used the corresponding abstracts to evaluate our contributions.
3.1.1 Pre-processing
The raw data collected from PubMed is in the form of free text. To prepare it for automatic analysis a series of ‘pre-processing’ steps are required. The goal is to remove words which are largely uninformative, reduce dispersal of
semantically equivalent terms, and thereafter select terms which are included in the vocabulary over which topics are learnt.
We firstly applied soft lemmatization using the Word-Net® lexicon [31] to normalize for word inflections. No stemming was performed to avoid semantic distortion often effected by heuristic rules used by stemming algo-rithms. After lemmatization and the removal of so-called stop-words, we obtained approximately 2.2 and 3.8 mil-lion terms in the entire corpus when repetitions are counted and 37,626 and 46,114 unique terms, for the ASD
[image:5.595.62.539.242.694.2]and MetS corpora, respectively. Constructing the vocabu-lary for our method by selecting the most frequent terms which explain 90 % of the energy in a specific corpus resulted in ASD and MetS vocabularies containing 3417 and 2839 terms, respectively.
3.2 Results and discussion
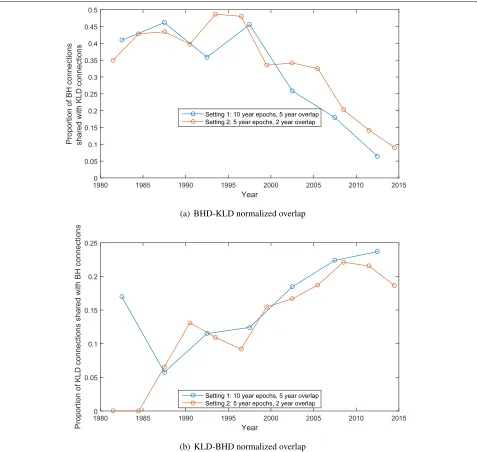
We stared evaluation by examining whether the two topic relatedness measures (BHD and KLD) are capturing dif-ferent aspects of relatedness. To obtain a quantitative measure, we looked at the number of inter-topic connec-tions formed in respective graphs both when the BHD is used as well as when the KLD is applied instead. The results were normalized by the total number of connec-tions formed between two epochs, to account for changes
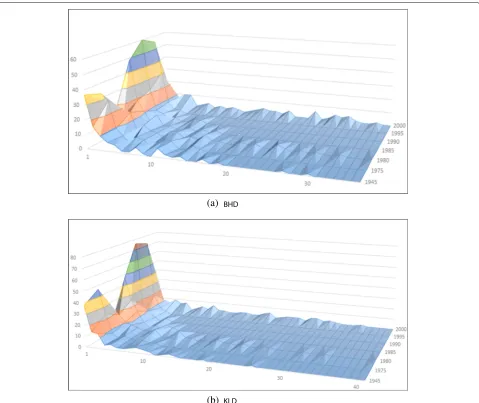
in the total number of topics across time. Our results for the MetS corpus are summarized in Fig. 2; similar results were obtained for ASD data. A significant differ-ence between the two graphs is readily evident; across the entire timespan of the data corpus, the number of Bhattacharyya distance-based connections also formed through the use of the KLD is less than 40 % and in most cases less than 30 %. An even greater difference is seen when the proportion of the KLD connections is examined—it is always less than 25 % and most of the time less than 15 %. The graphs in Fig. 3 show the dis-tributions of the number of connections leading from topics in our topic relatedness graph inferred using the BHD and the KLD using the CDF pruning threshold ofζ =0.9.
(a)
(b)
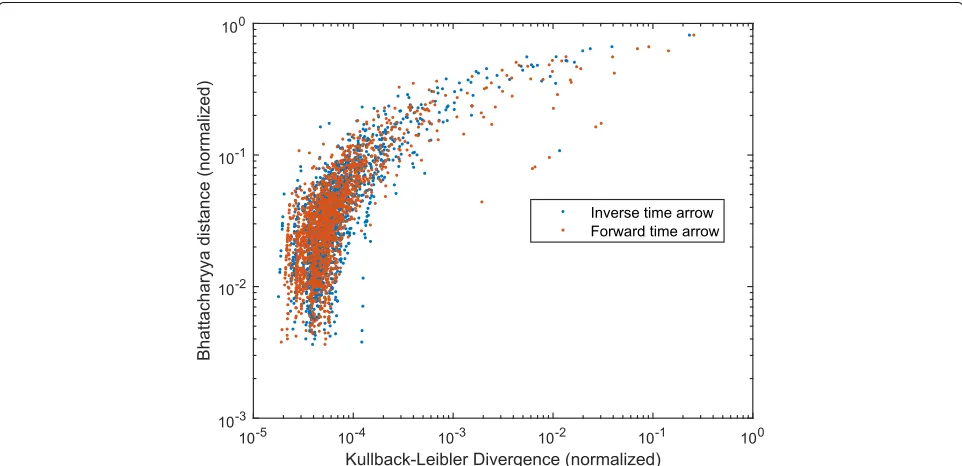
[image:6.595.59.538.288.691.2]To get an even deeper insight into the contribution of the two relatedness measures, we examined the corre-sponding topic graphs before edge pruning. The plot in Fig. 4 shows the variation in inter-topic edge strengths computed using the BHD and the KLD (in forward and backward directions)—the former as thexcoordinate of a point corresponding to a pair of topics and the lat-ter as its y coordinate. The scatter of data in the plot corroborates our previous observation that the two sim-ilarity measures indeed do capture different aspects of topic behaviour.
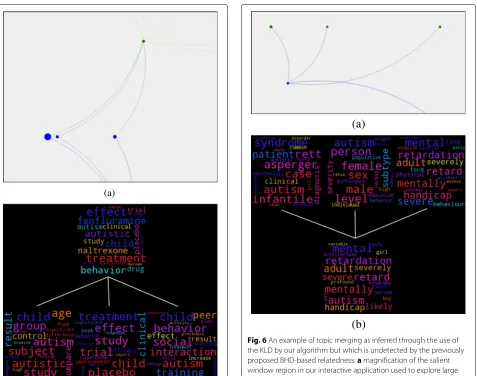
We also performed extensive qualitative analysis which is necessitated by the nature of the problem at hand and the so-called semantic gap that underlies it. In all cases, we found that our algorithm revealed meaningful and useful information as verified by medical experts on the ASD and MetS. This observation is consistent with previous reports in the literature using an algorithm with a similar struc-ture [12]. The key novelties which we emphasized in the present article are illustrated well in Figs. 5 and 6, which illustrate respectively topic splitting and topic merging as introduced by us (as opposed to the phenomena of topic speciation and topic convergence, previously incor-rectly termed splitting and merging). The splitting and the merging shown are identified through the use of the KLD but not by the BHD based relatedness inference (see Section 2.2).
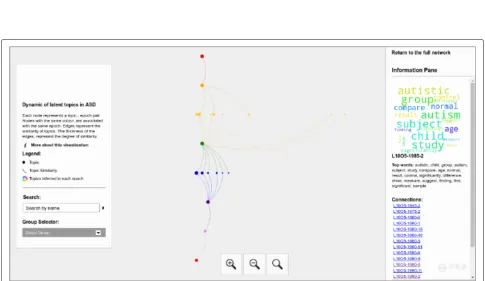
3.3 Interactive exploration and visualization
Our final contribution comprises a web application which allows users to upload and analyse their data sets using the proposed framework. A screenshot of the initial window of the application when a data set is loaded is shown in Fig. 7. Topics are visualized as coloured blobs arranged in rows, each row corresponding to a single epoch (with the time arrow pointing downwards). The size of each blob is proportional to the popularity of the corresponding topic within its epoch. Each epoch (that is to say, the set of topics associated with a single epoch) is coloured using a single colour different from the neighbouring epochs for easier visualization and navigation. Line connectors between topics denote temporal topic connections, i.e. the connections in the resultant temporal relatedness graph which, as explained in the previous section, depending on the local graph structure encode topic evolution, merging and splitting, and convergence and speciation.
The application allows a range of powerful tasks to be performed quickly and in an intuitive manner. For example, the user can search for a given topic using key-words (and obtain a list of topics ranked by the degree to which they match the query), trace the origin of a spe-cific topic backwards in time, or follow its development in the forward direction, examine word clouds associ-ated with topics, display a range of statistical analyses, or navigate the temporal relatedness graph freely. Some of
[image:7.595.58.539.449.682.2](a)
(b)
Fig. 5An example of topic splitting as inferred through the use of the KLD by our algorithm but which is undetected by the previously proposed BHD-based relatedness:amagnification of the salient window region in our interactive application used to explore large longitudinal text corpora (described in Section 3.3) showing the split topic and its descendant topics andbthe split topic and its descendent topics shown as word clouds. Recall that the notion of topic splitting as used in this work differs significantly from that used in previous work. As argued in Section 2.2, the previous
understanding of topic splitting is better described as topic speciation
these capabilities are showcased in Fig. 8. In particular, the central part of the screen shows a selected topic and the strongest ancestral and descendent lineages. The search box on the left hand side can be used to enter multiple terms which are used to retrieve and rank topics by quality of fit to the query. Finally, on the right hand side, relevant information about the currently selected topic is summa-rized: its most popular terms are both visualized in the form of a colour coded word cloud, as well as listed in
(a)
(b)
Fig. 6An example of topic merging as inferred through the use of the KLD by our algorithm but which is undetected by the previously proposed BHD-based relatedness:amagnification of the salient window region in our interactive application used to explore large longitudinal text corpora (described in Section 3.3) showing the merging topics and their descendant topic andbthe merging topics and the resultant topic shown as word clouds. Recall that the notion of topic merging as used in this work differs significantly from that used in previous work. As argued in Section 2.2, the previous understanding of topic splitting is better described as topic convergence
order in plain text underneath. Additional graph naviga-tion opnaviga-tions include magnificanaviga-tion tools accessible from the bottom of the screen, whereas translation is readily performed by simply dragging the graph using a mouse or a touchpad.
4 Conclusions
[image:8.595.63.540.83.459.2] [image:8.595.276.538.89.416.2]Fig. 7Screenshot of the initial window of the application we developed for free public analysis of custom data sets using the method described in the present paper. Topics are visualized ascoloured blobsarranged in rows, each row corresponding to a single epoch (with thetime arrow pointing downwards). The size of each blob is proportional to the popularity of the corresponding topic within its epoch. Each epoch is coloured using a
single colourdifferent from the neighbouring epochs.Line connectors between topicsdenote temporal topic connections across the temporal relatedness graph and encode topic evolution, merging and splitting, and convergence and speciation
[image:9.595.58.539.88.332.2] [image:9.595.56.541.402.683.2]is the first to describe and present a method for differ-entiating between two types of topic structure changes, namely topic splitting and what we termed topic specia-tion. Experiments on a large corpus of medical literature concerned with the metabolic syndrome was used to illus-trate the performance of our method. Lastly, we developed a web application which allows users such as medical researchers to apply our method for their analysis.
The present work illuminates several promising avenues for future work. Firstly, considering the important differ-ence between topic interaction phenomena such as topic splitting and speciation, and topic merging and conver-gence, we intend to focus on developing an information-theoretic framework which is capable of handing all of the aforementioned interactions in a unified manner. Such a framework would confer the additional benefit of remov-ing the need for the free parameter necessitated by our method—the proportion of edges retained in our topic relatedness graph. The second direction of research we intend to pursue concerns the free parameters used to handle the temporal dimension. Although it is prima fas-ciae clear that the duration of the epoch length used to discretize time, as well as the degree of overlap between consecutive epochs, should be dependent on the dynam-ics of a particular longitudinal corpus (contrast for exam-ple the analysis of social media posts and the medical literature), currently, there are no principled methods for choosing the values of these parameters. Lastly, we believe that the nature of the problem at hand, that of temporal topic modelling, offers opportunities for a more objec-tive manner of performance assessment, in contrast to the usual post hoc, qualitative approaches used in the existing literature on topic modelling.
Funding
The authors have no funding to declare associated with the work in the present manuscript.
Authors’ contributions
Intellectual contribution is equally split between the authors. VA undertook the entirety of implementation of the proposed algorithms and software tools, whereas OA was entirely responsible for the preparation of the manuscript. Both authors read and approved the final manuscript.
Competing interests
The authors declare that they have no competing interests.
Received: 6 May 2016 Accepted: 12 September 2016
References
1. V Andrei, O Arandjelovi´c, inProc. International Conference of the IEEE Engineering in Medicine and Biology Society. Identification of promising research directions using machine learning aided medical literature analysis, (2016), pp. 2471–2474
2. V Andrei, O Arandjelovi´c, inProc. International Joint Conference on Artificial Intelligence Workshop on Big Scholarly Data. Temporal quasi-semantic visualization and exploration of large scientific publication corpora, (2016), pp. 9–15
3. O Arandjelovi´c, Assessing blinding in clinical trials. Adv. Neural Inform. Process. Syst.25, 530–538 (2012)
4. O Arandjelovi´c, A new framework for interpreting the outcomes of imperfectly blinded controlled clinical trials. PLOS ONE.7(12), e48984 (2012)
5. O Arandjelovi´c, Clinical trial adaptation by matching evidence in complementary patient sub-groups of auxiliary blinding questionnaire responses. PLOS ONE.10(7), e0131524 (2015)
6. O Arandjelovi´c, Discovering hospital admission patterns using models learnt from electronic hospital records. Bioinformatics.31(24), 3970–3976 (2015)
7. O Arandjelovi´c, inProc. International Conference of the IEEE Engineering in Medicine and Biology Society. Prediction of health outcomes using big (health) data, (2015), pp. 2543–2546
8. O Arandjelovi´c, inProc. AAAI Conference on Artificial Intelligence. Sample-targeted clinical trial adaptation, vol. 3, (2015), pp. 1693–1699 9. O Arandjelovi´c, On the discovery of hospital admission patterns—a
clarification. Bioinformatics.32(13), 2078 (2016)
10. W Berardinelli, JG Cordeiro, D de Albuquerque, A Couceiro, A new endocrine-metabolic syndrome probably due to a global hyperfunction of the somatotrophin. Acta Endocrinologica.12(1), 69–80 (1953) 11. A Bessou, F Guelfucci, S Aballea, M Toumi, C Poole, Comparison of
comorbidity measures to predict economic outcomes in a large UK primary care database. Value Health.18(7), A691 (2015)
12. A Beykikhoshk, O Arandjelovi´c, D Phung, S Venkatesh, inProc. Pacific-Asia Conference on Knowledge Discovery and Data Mining. Hierarchical Dirichlet process for tracking complex topical structure evolution and its application to autism research literature, vol. 1, (2015), pp. 550–562 13. A Beykikhoshk, O Arandjelovi´c, D Phung, S Venkatesh, inProc. IEEE/ACM
International Conference on Advances in Social Network Analysis and Mining. Overcoming data scarcity of Twitter: using tweets as bootstrap with application to autism-related topic content analysis, (2015), pp. 1354–1361
14. A Beykikhoshk, O Arandjelovi´c, D Phung, S Venkatesh, T Caelli, inProc. IEEE/ACM International Conference on Advances in Social Network Analysis and Mining. Data-mining Twitter and the autism spectrum disorder: a pilot study, (2014), pp. 349–356
15. A Beykikhoshk, O Arandjelovi´c, D Phung, S Venkatesh, T Caelli, Using Twitter to learn about the autism community. Soc. Netw. Anal. Mining. 5(1), 5–22 (2015)
16. A Beykikhoshk, D Phung, O Arandjelovi´c, S Venkatesh, inProc. IEEE International Conference on Data Science and Advanced Analytics. Analysing the history of autism spectrum disorder using topic models, (2016). In press
17. P Bhatnagar, K Wickramasinghe, J Williams, M Rayner, N Townsend, The epidemiology of cardiovascular disease in the UK 2014. Heart.101(15), 1182–1189 (2015)
18. GS Birkhead, M Klompas, NR Shah, Uses of electronic health records for public health surveillance to advance public health. Ann. Rev. Public Health.36, 345–359 (2015)
19. D Blei, J Lafferty, Dynamic topic models. Proc. IMLS International Conference on Machine Learning, 113–120 (2006)
20. C Canavan, J West, T Card, Calculating total health service utilisation and costs from routinely collected electronic health records using the example of patients with irritable bowel syndrome before and after their first gastroenterology appointment. PharmacoEconomics.34(2), 181–194 (2015)
21. B Christensen, G Ellingsen, Evaluating model-driven development for large-scale EHRs through the openEHR approach. Int. J. Med. Inform.89, 43–54 (2016)
22. PM Coloma, G Trifiro, V Patadia, M Sturkenboom, Postmarketing safety surveillance: where does signal detection using electronic healthcare records fit into the big picture? Drug Safety.36(3), 183–197 (2013) 23. AG Crawford, C Cote, J Couto, M Daskiran, C Gunnarsson, K Haas, et al.,
Comparison of GE Centricity electronic medical record database and National Ambulatory Medical Care Survey findings on the prevalence of major conditions in the United States. Popul. Health Manag.13(3), 139–150 (2010)
25. TS Ferguson, A Bayesian analysis of some nonparametric problems. Ann. Stat.1, 209–230 (1973)
26. L Kanner, Irrelevant and metaphorical language in early infantile autism. Am. J. Psychiat.103(2), 242–246 (1946)
27. R Kukafka, JS Ancker, C Chan, J Chelico, S Khan, S Mortoti, et al., Redesigning electronic health record systems to support public health. J. Biomed. Inform.40(4), 398–409 (2007)
28. EC Lau, FS Mowat, MA Kelsh, JC Legg, NM Engel-Nitz, HN Watson, et al., Use of electronic medical records (EMR) for oncology outcomes research: assessing the comparability of EMR information to patient registry and health claims data. Clin. Epidemiol.3, 259–272 (2011)
29. M Liu, ER McPeek Hinz, ME Matheny, JC Denny, JS Schildcrout, RA Miller, et al., Comparative analysis of pharmacovigilance methods in the detection of adverse drug reactions using electronic medical records. J. Am. Med. Inform. Assoc.20(3), 420–426 (2013)
30. N Menachemi, TH Collum, Benefits and drawbacks of electronic health record systems. Risk Manag. Healthcare Policy.4, 47–55 (2011)
31. GA Miller, WordNet: a lexical database for English. Commun. ACM.38(11), 39–41 (1995)
32. PM Nadkarni, Drug safety surveillance using de-identified emr and claims data: issues and challenges. J. Am. Med. Inform. Assoc.17(6), 671–674 (2010)
33. RM Neal, Markov chain sampling methods for Dirichlet process mixture models. J. Comput. Graph. Stat.9(2), 249–265 (2000)
34. MM Paul, CM Greene, R Newton-Dame, LE Thorpe, SE Perlman, KH McVeigh, et al., The state of population health surveillance using electronic health records: a narrative review. Popul. Health Manag.18(3), 209–216 (2015)
35. SK Paul, K Klein, D Maggs, J Best, The association of the treatment with glucagon-like peptide-1 receptor agonist exenatide or insulin with cardiovascular outcomes in patients with type 2 diabetes: a retrospective observational study. Cardiovasc. Diabetol.14(1), 1–9 (2015)
36. SK Paul, K Klein, BL Thorsted, ML Wolden, K Khunti, Delay in treatment intensification increases the risks of cardiovascular events in patients with type 2 diabetes.Cardiovasc. Diabetol.14, 100 (2015)
37. RGI-CGHR Collaborators, Report on the causes of death in India: 2001–2003 (2009).Office of the Registrar General of India 38. LF Richardson, Variation of the frequency of fatal quarrels with
magnitude. J. Am. Stat. Assoc.43(244), 523–546 (1948)
39. YW Teh, MI Jordan, MJ Beal, DM Blei, Hierarchical Dirichlet processes. J. Am. Stat. Assoc.101(476), 1566–1581 (2006)
40. I Vasiljeva, O Arandjelovi´c, inProc. International Conference on Bioinformatics and Computational Biology. Prediction of future hospital admissions—what is the tradeoff between specificity and accuracy?, (2016), pp. 3–8
41. I Vasiljeva, O Arandjelovi´c, inProc. International Conference of the IEEE Engineering in Medicine and Biology Society. Towards sophisticated learning from EHRs: increasing prediction specificity and accuracy using clinically meaningful risk criteria, (2016), pp. 2452–2455
42. B Wettermark, H Zoega, K Furu, M Korhonen, J Hallas, M Norgaard, et al., The Nordic prescription databases as a resource for
pharmacoepidemiological research—a literature review. Pharmacoepidemiol. Drug. Saf.22(7), 691–699 (2013)
43. L Xu, D Wen, X Zhang, J Lei, Assessing and comparing the usability of Chinese EHRs used in two Peking University hospitals to EHRs used in the US: a method of RUA. Int. J. Med. Inform.89, 32–42 (2016)
Submit your manuscript to a
journal and benefi t from:
7Convenient online submission 7 Rigorous peer review
7Immediate publication on acceptance 7 Open access: articles freely available online 7High visibility within the fi eld
7 Retaining the copyright to your article