1
Glazing systems with Parallel Slats Transparent
Insulation Material (PS-TIM): Evaluation of building
energy and daylight performance
Yanyi Sun, Runqi Liang, Yupeng Wu*, Robin Wilson and Peter Rutherford
Department of Architecture and Built Environment, Faculty of Engineering, The University of Nottingham, University Park, Nottingham, NG7 2RD, UK
*Corresponding author: Tel: +44 (0) 115 74 84011; emails: [email protected], [email protected]
Abstract
Being responsible for a significant proportion of total heat loss in façade
dominated buildings, the design and specification of the envelope, particularly the
building’s glazing system, is a key factor in determining overall energy consumption.
To address this, an innovative double glazed façade system comprising parallel
transparent / translucent plastic slats sandwiched between the glass panes to form a
Parallel Slat Transparent Insulation Material (PS-TIM) system is proposed as a potential
solution. This PS-TIM system reduces heat transfer between the glazing panes whilst
maintaining access to solar radiation and daylight.
The presence of the PS-TIM structure significantly affects the thermal and
optical performance of the window system in which it is employed. This presents a
further significant challenge when trying to predict its performance using dynamic
building simulation approaches. Using a typical small office as a case study subject to
varying climatic conditions, we investigate the thermal and optical behaviour of a range
2
compared to a conventional double glazed system, the application of PS-TIMs can result
in a more visually comfortable and uniformly lit environment, which might be desired
in an office space, and, in the specific case of the small office under test, can result in a
reduction in energy consumption of up to 35.8%. Furthermore, having explored the
performance of the system in response to varying climatic conditions, we also present
some advice as to how architects and engineers might apply PS-TIMs to window
systems or glazed façades.
Keywords:
Parallel Slat Transparent Insulation Materials (PS-TIM); Building simulation;
3
1.
Introduction
Amongst the numerous components that form a façade, glazing systems
contribute significantly not only to solar heat gain and heat loss from a building’s
enclosure, but also determine view, daylight distribution and daylight availability [1-4].
As such, they are exceptionally important elements that, if designed and specified
properly, can reduce energy consumption and improve indoor environmental quality.
One potential solution to improve the thermal performance of a glazing system whilst
maintaining its solar transmittance and access to daylight is to sandwich a Transparent
Insulation Material (TIM) in the form of an array of translucent parallel slats into the air
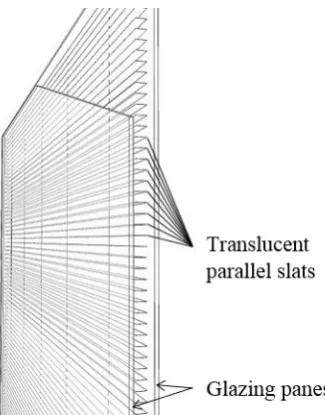
cavity of a double glazed unit (Fig. 1). Known as a Parallel Slat Transparent Insulation
Material (PS-TIM) structure [5], it divides the interstitial air cavity into small, horizontal,
linear cells. In so doing, the cell walls provide additional viscous resistance to the onset
of free convection and interfere with thermal radiation transferred from one pane of the
glazing unit to the other, hence increasing the thermal resistance of the glazing system
overall [5]. At the same time, the translucent slats incorporated within the PS-TIM
glazing system have the potential to effectively adjust the quantity and direction of
daylight transmitted through the window which in turn may result in a more comfortable
and uniform distribution of daylight into the lit space [6]. As such, a well-designed
4
Fig. 1: A schematic diagram of the PS-TIM glazing system
The thermal behaviour of TIMs has been investigated numerically and
experimentally over the past two decades, much of this work focused solely on their
application to solar collectors. Such research has proven that TIMs can effectively
reduce heat loss and improve the overall efficiency of such systems [7-11]. However,
relatively few studies exist regarding their thermal and optical performance when
sandwiched within the cavities of double glazed window units. This research gap is
important as the conditions experienced by a window that incorporates TIMs are
significantly different to those in solar collector applications. That is, the working
temperature, the pattern and intensity of natural convection within the structure and the
requirements for light transmittance and view are dissimilar.
Studying the performance of TIMs within glazing systems presents numerous
challenges which remain largely unaddressed in the literature. For example, whilst the
thermal resistance of a double glazed unit can be obtained through an empirical equation
relating to the Nusselt number, Nu, this is not the case for a TIM structure. In TIM
structures, the thermal resistance is dynamic and is a product of environmental
conditions affecting both convective and radiative heat transfer within the structure.
5
mean temperature of the glazing panes, this changes the structure’s total resistance,
which in turn affects the overall heat transfer coefficient of the TIM structure [5].
Additionally, detailed analysis of the balance between the thermal resistance and solar
transmittance of TIMs and their impact on building energy performance has still not
been rigorously explored and few studies have been conducted that seek to analyse their
energy efficiency when subjected to varying climate conditions. One study by Wong
et al. [12] simulated the performance of TIM-based glazing that incorporated a 22 mm
polymethyl methacrylate (PMMA) capillary slab on a south facing façade with a fixed
U-value. The annual results for this prediction showed that when compared to standard
double glazing, daytime internal temperature swings were reduced and when combined
with thermal mass, solar protection and natural ventilation strategies, TIM-based glazing
had the potential to reduce heating energy loads in winter and overheating in summer.
Finally, whilst daylight and glare studies have been performed for other emerging
glazing façade systems such as semi-transparent PV and electrochromic glazing (e.g.
[13, 14]), very few have studied the impact of TIMs on daylight performance. One study
by Lien et al. [15] used scale model techniques to predict the daylight distribution
properties of capillary TIM structures, finding that the capillary TIM structure
contributed to uniform daylight distribution and reduced light contrast. However the
results obtained from their scale model-based daylight distribution maps do not allow
for the reliable prediction of daylight performance of TIM-based glazing under multiple
realistic climate scenarios.
It is evident therefore that TIM-based glazing systems require further
investigation in terms of both their thermal and optical behaviour, particularly how they
6
information is needed by construction professionals to ensure that TIM-based systems
are designed appropriately and applied correctly.
In the paper presented here, we aim to predict the performance of glazing systems
incorporating Parallel Slat Transparent Insulation Materials (PS-TIM) by applying them
to a small case study office [16] and where appropriate will compare their performance
to that of ordinary double glazing. To do so, we present a comprehensive approach to
this prediction process that seeks to understand the thermal and optical properties of the
PS-TIM based system, these implemented in both building energy and daylight
simulation packages (Fig. 2). Using Computational Fluid Dynamics (CFD) simulation,
we firstly determine the dynamic thermal conductance of PS-TIM structures in response
to varying environmental conditions including the temperature difference between panes
and the mean glazing temperature. Using the ray tracing techniques embodied within
RADIANCE, we determine the optical characteristics and specifically the Bidirectional
Scattering Distribution Function (BSDF) of the PS-TIM structure based on specific
geometrical profiles. Having gathered our basic characterisation data, we apply our
PS-TIM data to the glazing of a typical small office and test their performance under five
different climate scenarios. In so doing, we predict our heating, cooling and lighting
demands in EnergyPlus and the daylighting performance of the glazing systems in
RADIANCE.
The research presented in this paper will therefore explore glazing performance
in increasing levels of detail as it relates to the following research questions:
1. How does PS-TIM slat spacing influence heat losses and gains in PS-TIM
7
2. How does PS-TIM slat spacing impact on key visual comfort metrics including
Useful Daylight Illuminance (UDI), daylight Uniformity Ratio (UR) and DaylightGlare Probability (DGP)?
3. What effects do different PS-TIM slat spacings have on heating, cooling and
lighting demands and ultimately on overall energy performance?
Overall, the results may be seen as offering potential advice on the design,
development and use of PS-TIM windows in buildings subject to these particular
[image:7.595.110.529.300.702.2]conditions.
Fig. 2: Flow chart of the comprehensive method for complex fenestration* [17]
8
2.
Research methodology
In this research, the influence of different climate conditions on daylight and
energy performance was explored for three PS-TIM slat spacings. Building upon the
authors previous PS-TIM research [5, 6], slat spacings of 10 mm, 7.5 mm and 5 mm
(labelled as ‘10 mm PS-TIM’, ‘7.5 mm PS-TIM’ and ‘5 mm PS-TIM’) were selected as
they had the potential to significantly increase thermal resistance [5] and improve
daylight performance [6] when compared to ordinary double glazing. Since our previous
research has demonstrated that slat tilt angle had a nominal influence on overall daylight
performance of PS-TIMs for these particular slat spacings [6], the slats were inclined
horizontally for the study presented here.
2.1
Base data collection
2.1.1 Thermal model of PS-TIM
To obtain the thermal properties of the glazing system comprising PS-TIMs for
use in the resultant building simulation, a validated two-dimensional finite volume
model [5, 18] developed using the CFD software ANSYS FLUENT 15.0 was used to
solve the conductive, convective and radiative heat transfer properties of the system [5].
In so doing, by varying the boundary conditions in the CFD calculation, an equivalent
thermal conductivity under different thermal conditions was obtained for the three slat
spacings, these conductivities a function of the mean temperature of the PS-TIM layer
and the temperature difference between the two glazing panes. From these CFD
calculations [17], Eq. (1) was used to correlate data and the regression coefficients for
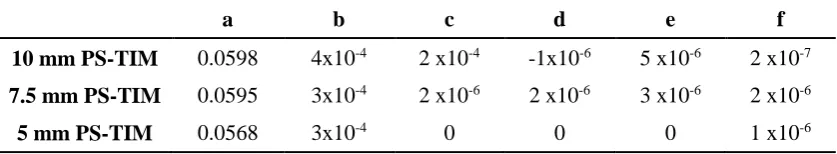
the fit for the PS-TIM structures with three slat spacings (Table 1).
9
Where kps-TIM is the equivalent thermal conductivity of the PS-TIM, tm (°C) is the mean temperature of two isothermal interfaces and ∆𝑡 (°C) is the temperature difference
[image:9.595.109.528.188.265.2]between these two interfaces.
Table 1: Coefficients for the polynomial regression predicting equivalent thermal conductivities of different PS-TIM configurations for Equation (6-5)
a b c d e f
10 mm PS-TIM 0.0598 4x10⁻⁴ 2 x10⁻⁴ -1x10⁻⁶ 5 x10⁻⁶ 2 x10⁻⁷
7.5 mm PS-TIM 0.0595 3x10⁻⁴ 2 x10⁻⁶ 2 x10⁻⁶ 3 x10⁻⁶ 2 x10⁻⁶
5 mm PS-TIM 0.0568 3x10⁻⁴ 0 0 0 1 x10⁻⁶
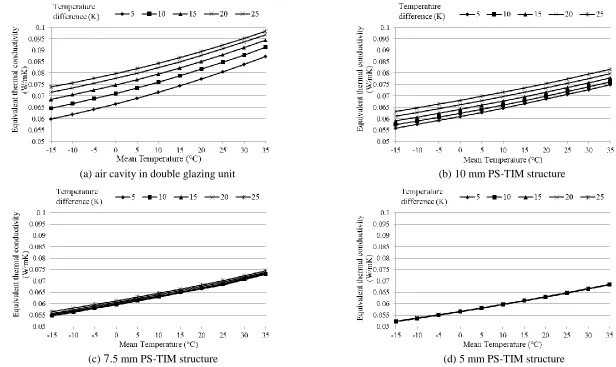
From these, a series of individual conductivity values under different thermal
conditions were derived for both PS-TIM and ordinary double glazed units (Fig. 3 and
Appendix A). These dynamic conductivities were subsequently used in the EnergyPlus
10
Fig. 3: The equivalent thermal conductivity of the air cavity between two panes with and without PS-TIM, pre-calculated by Computation Fluid Dynamics
(a)air cavity in double glazing unit (b)10 mm PS-TIM structure
11 2.1.2 Optical model of PS-TIM
To cater for variations in incident angle-related transmission and reflection, a
Bidirectional Scattering Distribution Function (BSDF) was generated for subsequent use in the simulation process. Such an approach for complex glazing systems has been
validated and has proven to overcome some of the known limitations of the radiosity
method [19-21].
The BSDF data were calculated for the three slat spacings (10mm, 7.5mm and 5mm), to reveal the influence of PS-TIM geometry on the daylight and overall energy
performance of the office under different climate condition. The material used to form
the parallel slats was assumed to be a Lambertian diffuser with 50% transmittance as
used by [19]. A validated ray-tracing program in RADIANCE [22], genBSDF, was used
to generate the BSDF from the geometry and material optical properties of the interstitial structure. The BSDF data were subsequently processed in WINDOW 7.4 to create a unified file of the complete system that contained the PS-TIM and glazing layers in
EnergyPlus format [19].
2.2
Simulation setup
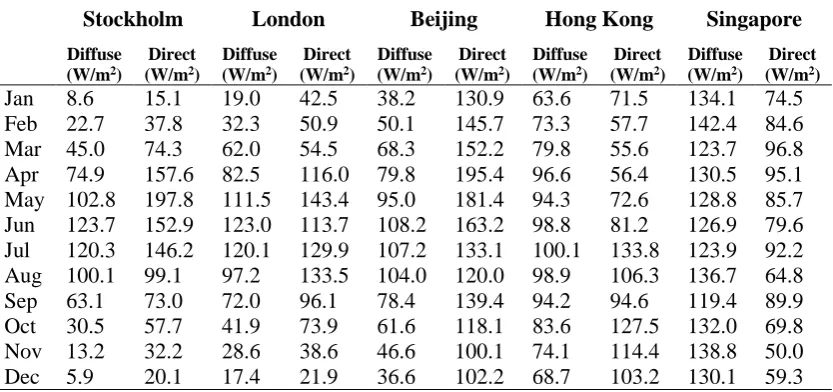
2.2.1 Weather data in building simulation
The building performance simulations were conducted in one hour time steps for
an entire year using the IWEC (International Weather for Energy Calculation) weather
data for five cities: Stockholm, London, Beijing, Hong Kong and Singapore.
Representing different geographical and weather conditions such as temperature and
solar radiation intensity (Tables 2 and 3), these cities were selected to show the different
12
performance, these explored through both RADIANCE (Version 4.1) and EnergyPlus
[image:12.595.109.527.150.259.2](Version 8.1.0) simulation.
Table 2: Latitude, longitude, summer and winter average temperatures of the 5 cities
Table 3: Monthly average direct and diffuse solar radiation at the 5 cities
Stockholm London Beijing Hong Kong Singapore
Diffuse (W/m2)
Direct (W/m2)
Diffuse (W/m2)
Direct (W/m2)
Diffuse (W/m2)
Direct (W/m2)
Diffuse (W/m2)
Direct (W/m2)
Diffuse (W/m2)
Direct (W/m2) Jan 8.6 15.1 19.0 42.5 38.2 130.9 63.6 71.5 134.1 74.5 Feb 22.7 37.8 32.3 50.9 50.1 145.7 73.3 57.7 142.4 84.6 Mar 45.0 74.3 62.0 54.5 68.3 152.2 79.8 55.6 123.7 96.8 Apr 74.9 157.6 82.5 116.0 79.8 195.4 96.6 56.4 130.5 95.1 May 102.8 197.8 111.5 143.4 95.0 181.4 94.3 72.6 128.8 85.7 Jun 123.7 152.9 123.0 113.7 108.2 163.2 98.8 81.2 126.9 79.6 Jul 120.3 146.2 120.1 129.9 107.2 133.1 100.1 133.8 123.9 92.2 Aug 100.1 99.1 97.2 133.5 104.0 120.0 98.9 106.3 136.7 64.8 Sep 63.1 73.0 72.0 96.1 78.4 139.4 94.2 94.6 119.4 89.9 Oct 30.5 57.7 41.9 73.9 61.6 118.1 83.6 127.5 132.0 69.8 Nov 13.2 32.2 28.6 38.6 46.6 100.1 74.1 114.4 138.8 50.0 Dec 5.9 20.1 17.4 21.9 36.6 102.2 68.7 103.2 130.1 59.3 2.2.2 Modelling of the prototype office
A single room, based on a small office located in the Energy Technologies
Building at the University of Nottingham in the UK was selected for the simulation [17].
The purpose of using a single office in building simulation and performance analysis
was to use a simple scenario to demonstrate how the PS-TIM integrated into a window
system influenced the environment in office buildings in different climates. The office
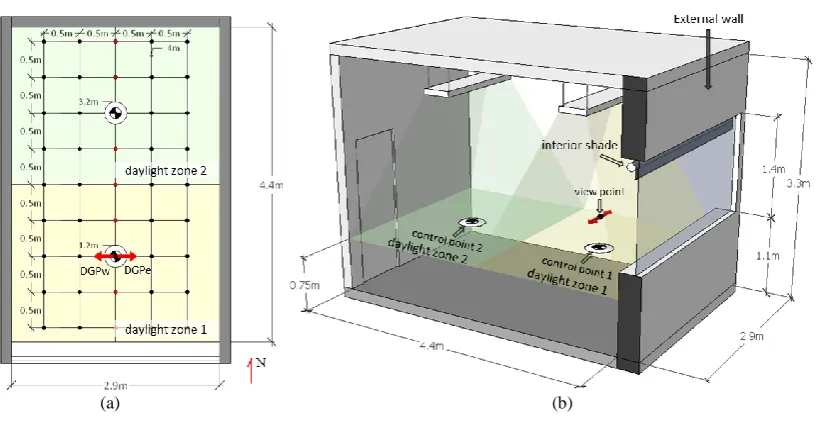
was considered as part of a large south-facing façade with dimensions of 2.9 m (width)
× 4.4 m (depth) × 3.3 m (height) (Figure 4), ignoring influences from surrounding
buildings, vegetation or other obstructions. Only the south wall of the office was exposed
to external conditions while the remaining surfaces were assumed to be buffered by
Latitude Longitude Summer avg. temp.
(°C)
Winter avg. temp. (°C)
Stockholm 59.3° N 18° E 15.8 -2.0
London 51.5° N 0° W 16.3 4.5
Beijing 39.9° N 116° E 25.4 -1.1
Hong Kong 22.3° N 114.2° E 28.4 16.5
[image:12.595.111.528.287.483.2]13
mechanically conditioned spaces and therefore experienced no interzonal heat flow. A
window of dimensions 1.4 m (height) × 2.9 m (width) was located in the south wall (see
Fig. 4 (b)). The room was assumed to be used as a private office for two people from
09:00 to 17:00 on weekdays, with one seating position near the window and the second
at the back of the room.
Figure 4: (a) Plan view and (b) section view of the simulated office room
2.2.3 Simulation set up for building daylight prediction in RADIANCE
In this research, the Three-Phase-Method [23], based on hourly weather data,
was used for annual dynamic daylight simulation. As shown in
Figure (a), a total of 45 measurement points at a height of 0.75 m above the floor
were used to represent the illuminance distribution on a notional work plane. With a cell
size of 0.5 m, the resultant illuminance grid met the maximum grid cell size of 0.56 m
as calculated from the technique used in [24].
For both occupants, as glare is less likely to be an issue at the back of the room,
only the view point representing the occupant working near the window was considered
for the glare evaluation. Located at a distance of 1.2 m from the window and at a height
of 1.2 m above the floor on the centre axis of the room, the occupant was considered to
[image:13.595.109.519.206.417.2]14
be facing away from the window in either an east or west direction (see Fig. 4). A
detailed description of the internal reflectance, transmission of the double glazed
window and the rendering parameters (e.g. ambient bounces, ambient divisions, ambient
[image:14.595.110.521.208.397.2]resolution etc.) used in RADIANCE can be found in Table 4.
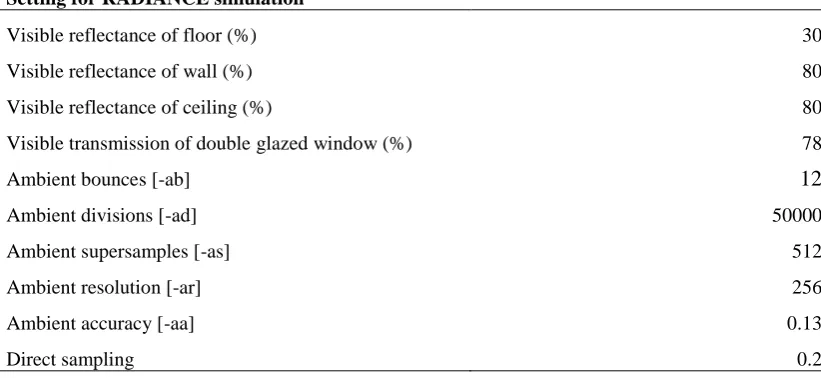
Table 4: Simulation parameters in RADIANCE
Setting for RADIANCE simulation
Visible reflectance of floor (%) 30
Visible reflectance of wall (%) 80
Visible reflectance of ceiling (%) 80
Visible transmission of double glazed window (%) 78
Ambient bounces [-ab] 12
Ambient divisions [-ad] 50000
Ambient supersamples [-as] 512
Ambient resolution [-ar] 256
Ambient accuracy [-aa] 0.13
Direct sampling 0.2
2.2.4 Simulation set up for building thermal / energy prediction in EnergyPlus
In this research, the U-value of the exterior south wall was assumed to be constant
at 0.43 W/m2K for all five cities, which is a mid-value according to the building
regulations for these cities. The dynamic equivalent thermal conductivities derived for
both the PS-TIM and double glazing units (Section 2.1.1) were used as input data to the
EnergyPlus simulation. By using the ‘Energy Management System (EMS)’ function in
EnergyPlus, the internal and external surface temperatures of the tested window were
detected at the beginning of each time step. From this, a corresponding thermal
conductivity for that temperature condition was selected from the dataset and
subsequently applied in the energy balance calculation process [17, 25]. The BSDF file derived from the ray-tracing technique (Section 2.1.2) was also used as an input file to
15
Standard equipment and lighting loads were assumed to be 13 W/m2 and 16
W/m2 respectively [26, 27]. As shown in Fig. 4, the room was divided into two
daylighting zones with two control sensors located at the centre of each daylighting zone
at a height of 0.75 m (representing the height of the working place). An illuminance
level threshold of 500 lx at each sensor, which is the lower limit for task lighting [28],
was used to determine the switching profile of the lighting system with the appropriate
sensor individually controlling its own luminaire. To simplify the analysis and negate
the influence from variable thermostat setting temperatures on energy consumption
under different climate conditions, a single set-point temperature of 21 °C was used all
year round. This set-point temperature represented an overlap between summer and
winter operative temperature ranges [29]. From this, two HVAC schedule scenarios
were applied, these seeking to explore the influence of PS-TIM systems on the office’s
energy performance during both day and night time. The first assumed that the HVAC
system only operated during normal working hours from 09:00 to 17:00 on weekdays.
16
Acknowledging the fact that occupants in an office disrupted by bright daylight
are likely to lower the interior shade or blind to block sunlight, an assessment of Daylight
Glare Probability (DGP) [30, 31] was simulated. Assuming that the occupant faced
either the east or west wall from the viewpoint, both the DGP for these orientations
(DGPe/ DGPw) and illuminance levels were predicted in RADIANCE. When these
DGPs exceeded 0.35, therefore implying the occurrence of perceptible glare [31], and/or
illuminance levels exceeded 2000 lx, which implied that daylight was very likely to lead
to visual and/or thermal discomfort [28], the interior shade, with a reflectance of 0.5 and
a transmittance of 0.1 was lowered. The output data from RADIANCE was subsequently
used to generate a daylight schedule for each time step, these forming an input into
17
3.
Simulation results and discussion
3.1
Daylight performance after applying PS-TIM
The BSDF data were used to simulate the daylight performance of the office
space as subject to five different climate scenarios through RADIANCE. Key daylight
metrics included the daylight availability metric, Useful Daylight Illuminance (UDI),
and daylight comfort metrics Daylight Glare Probability (DGP) and Illuminance
Uniformity Ratio (UR).
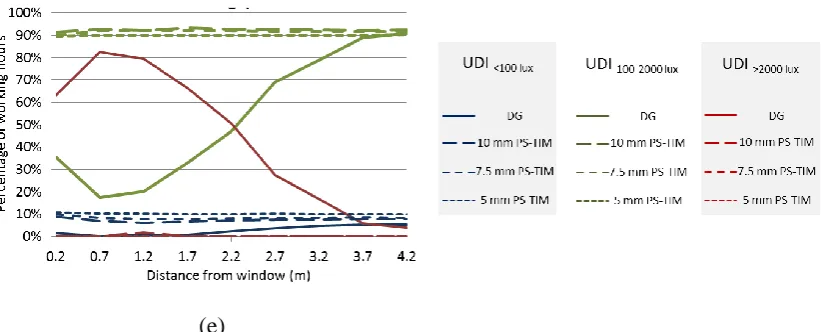
3.1.1 Useful daylight illuminance
Predicted at points along the centre line of the room between the window and the
end wall for the selected five different climatic conditions, the Useful Daylight Illuminance (UDI) metric was used to explore occupant response to varying daylight illumination [28] for both double glazed and PS-TIM-based units (Fig. 5). In so doing,
lower and upper acceptance thresholds describing the illuminance level achieved during
the working hours in a year were derived, these categorised into three acceptance
threshold bins [28]; (1) an undersupplied bin (UDI<100 lx), where the daylight illuminance levels were below 100 lx and insufficient thus requiring supplementary artificial
lighting, (2) an oversupplied bin (UDI>2000 lx), where the daylight illuminance levels experienced were in excess of 2000 lx and therefore very likely to lead to visual and/or
thermal discomfort and, (3) a useful bin (UDI100-2000 lx), which was considered to provide desirable illuminance between 100 and 2000 lx.
Results from the standard double glazed window (Fig. 5) show similar daylight
performance under all cities considered. In the region close to the window, a significant
proportion of the working hours showed over illumination (i.e. appearing in the UDI>2000
18
region by reducing the hours of over illumination and in so doing resulted in a more
uniform illumination of the working plane. As is evident in Fig. 5, for approximately 70%
to 80% of working hours in Stockholm and London respectively, of the three PS-TIM
spacings, the 7.5 mm and 5 mm slat spacings provided more desirable illumination
(UDI100-2000 lx), this a significant improvement over double glazing. For Beijing (Figure 5 (c)), the PS-TIM with a 5 mm slat spacing improved the UDI100-2000 lx to around 90% of working hours, and also demonstrated a significant improvement over double glazing
and other TIM spacings, particularly for those regions closer to the window. The
PS-TIM with a 7.5 mm slat spacing offered the best UDI100-2000 lx performance in Hong Kong (Figure 5 (d)) where both the 5 mm and 7.5 mm slat spacings, demonstrated a more
consistent performance across the length of the room. For Singapore, all PS-TIMs
provided a relatively even distribution of UDI100-2000 lxand improved the metric to around 90% of working hours (Fig. 5 (e)).
Generally, three observations arose from these data. Firstly, all PS-TIM slat
spacings outperformed double glazing for all cities. Secondly as latitude increased,
smaller slat spacings provided a more even distribution desirable illumination across the
length of the office as evidenced by the smaller hourly variation and overall in the
percentage of working hours. Thirdly, for those cities other than Singapore, the 10 mm
slat spacing gave the poorest daylight performance of all slat spacings for those areas
closest to the window and in consequence gave the highest number of working hours
that were over illuminated (UDI>2000 lx). Performance however tended to converge with other slat spacings deeper into the room where the lit environment became more diffuse,
generally at around 2.7 m. With respect to these final two observations, this results from
the relationship between solar altitude and the pass angle for the PS-TIM (i.e. tan-1 (slat
19
working plane in the region close to the window or whether this light is incident on the
slat and diffused. It is worth noting that for Beijing, only the PS-TIM with a 5 mm slat
spacing achieved a homogenous distribution of UDI100-2000 lx across the length of the room. This is because the direct solar irradiation was strong in the IWEC weather data
year (as shown in Table 3), leading to a significant number of hours of over supply (i.e.
UDI> 2000lx) despite undergoing attenuation in the diffusing PS-TIM unit.
To conclude, both the solar irradiation intensity, which impacts on the quantity
of light coming into the room, and the solar altitude angle which additionally affects the
penetration and distribution of light into the room, influences the process of selecting an
optimal slat spacing for a window integrated with PS-TIM.
(a) (b)
20
Fig. 5: UDI distribution in the office for double glazing and PS-TIM applied under different climates. The blue, green and red lines represent undersupplied UDI, useful UDI and oversupplied UDI, respectively.
3.1.2 Daylight comfort
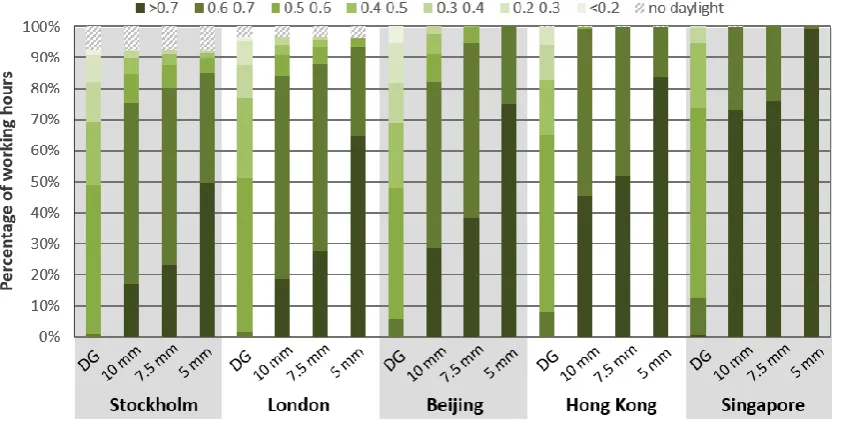
The uniformity ratio (UR) [32], a metric associated with daylight distribution, was obtained from the minimum and area-weighted average illuminance values from the
45 hourly daylight study points for all double glazing and PS-TIM combinations as
modified by the five selected climates (Fig. 6). Whilst BREEAM recommends that the
uniformity ratio must exceed 0.3 to be classed as good practice [33], the CIBSE SLL
Code for Lighting states that the minimum/average illuminance ratios on the working
plane must not be less than 0.7 [34]. As such the more stringent UR threshold of 0.7
was used to evaluate the various glazing systems.
For all climates, double glazing failed to meet the UR criteria outlined in the SSL
code. As can be seen from Fig. 6, for all climates, as slat spacing decreased, the
percentage of working hours with higher uniformity ratios increased. Additionally, as
latitude decreased, uniformity increased for a greater percentage of total working hours,
once again reflecting the relationship between solar altitude and the light diffusing
properties of the PS-TIM structures. Whilst these results suggest that PS-TIM structures
will mitigate against the sharp illuminance contrasts normally found in naturally lit
21
such homogenously lit conditions are desirable or not. To further explore the effect on
[image:21.595.110.533.141.354.2]issues such as visual comfort, a glare analysis was performed.
Fig. 6: Uniformity as a function of glazing type under different climate scenarios
Glare occurs when the luminance level within the field of view exceeds the
brightness that the human eye can adapt to [35]. To evaluate glare, and in particular
discomfort glare within the office space, the Daylight Glare Probability (DGP) technique was used [35]. Annual predictions [30, 31] of the DGP for both the double glazed and PS-TIM units were conducted for the selected cities at the view point (as
illustrated in Fig. 4) and the results are shown in Fig. 7. When predicted for the double
glazed window, intolerable glare (DGP ≥ 0.45), disturbing glare (0.4 < DGP < 0.45), and perceptible glare (0.35 < DGP < 0.4) accounted for 15.9%, 12.6% and 11% of occupied hours respectively under Stockholm’s climate. Apart from Beijing where the
solar irradiation intensity and thus daylight availability were significant, as the latitude
decreased, the data show that this generally resulted in an overall decrease in intolerable
glare and improvements to glare ratings overall. This can be explained by the mid-day
22
radiation penetrating through the south-facing window system thus impacting less on
the occupant’s point in the room.
To evaluate the suitability of the various glazing units for use in design, a
criterion threshold relating to the effectiveness of the daylit environment was established.
To meet this threshold, over 95% of office hours must be classed as having imperceptible
glare (DGP ≤ 0.35) [31]. As can be seen from Fig. 7, for all cities, a PS-TIM slat spacing
of 7.5 mm or less exceeded this criterion threshold. With respect to the 10 mm slat
spacing, it only just fell short of meeting this threshold for Stockholm, London and
Beijing but exceeded this threshold for those cities lower in latitude. At no point did the
[image:22.595.109.529.363.546.2]double glazed unit come close to meeting this criterion threshold.
Figure 7: DGP as a function of glazing type under the different climate scenarios
3.1.3 Requirement for interior shading to prevent strong daylight
In reality, if the illuminance levels caused by natural light through a window are
excessively high or daylight-induced glare exists, occupants in a working space are
likely to lower any interior shading devices (e.g. shade, blind or curtain). The shading
device would therefore significantly reduce the transmission of daylight into the space,
with illuminance levels deeper within the room possibly becoming insufficient for work.
23
example of the hourly daylight illuminance levels as predicted for each sensor and the
associated artificial lighting loads as modified by a double glazed unit in the office space
for a typical sunny day. Showing with and without interior shade conditions, artificial
lighting was switched on when the illuminance level dropped below 500 lx and therefore
proving unsuitable for general task-related activities and switched off when illuminance
levels exceeded 2000 lx, where over-illumination may prove problematic for the task at
hand. A typical interior shade with a medium reflectance of 0.5 and low transmittance
of 0.1 was used in the simulation.
From Fig. 8 (a), it can be seen that without the interior shade, illuminance levels
at points 1 and 2 for the whole period from 10:00 to 15:00 were above 2000 lx, which
was higher than the occupants’ acceptance level. From Fig. 8 (b), when the interior blind
was deployed, it blocked the strong daylight that occurred from 10:00 to 15:00, with the
illuminance levels at point 1 within desirable acceptance thresholds for the whole
working period from 09:00 to 16:00. Deeper into the room, at point 2, illuminance levels
dropped below the desired lower acceptance threshold of 500 lx therefore requiring
supplementary artificial lighting to illuminate this daylight zone. In turn this
supplementary lighting requires electrical energy which when combined with its impact
on heating and cooling loads affects the building’s energy consumption overall.
Time (hours)
24
Fig. 8: Lighting power and illuminance levels at points 1 and 2 (a) without interior shade and (b) with interior shade on a typical sunny day for the double-glazed unit.
From this initial shading device analysis, further simulations were performed on
all glazing units for the five climate scenarios. These sought to explore the average
number of hours per week that additional shading was needed to minimise the
oversupply of daylight and maintain visual comfort. To do so, two daylight metrics with
lower limit thresholds were used to control the shading strategy; (1) a UDI greater than
2000 lx and (2) a DGP greater than 0.35. If predicted values exceeded these lower limit
thresholds, shading was deployed.
As can be seen from Fig. 9, double glazing invariably had the highest number of
hours requiring the deployment of shading devices. Given that the PS-TIM structures
are in effect interstitial shading devices, it is unsurprising to find that less shading was
required in all climate types. With the 10 mm PS-TIM structure requiring the most
additional shading in all climate types, as slat spacing reduced so did the requirement
for additional shading. For example, when using the 7.5 mm PS-TIM structure, this
reduced the requirement for additional shading to under 5 h per week for Stockholm,
London and Beijing while totally eliminating the requirement for interior shade in Hong
Kong and Singapore. Using the 5 mm PS-TIM virtually eliminated the requirement for
additional shading in all climate scenarios. Overall the results suggests that the presence
of PS-TIMs effectively reduces the requirement for additional shading under all climates
Time (hours)
25
scenarios, with decreasing slat sizes proving to be the most effective. However the
results also demonstrate difficulties in using different daylight metrics in order to predict
shading deployment, particularly for PS-TIM structures. For example when looking at
ordinary double glazing, whilst it can be seen that the use of UDI invariably led to a
longer deployment of additional shading over DGP, this could not be said for PS-TIM
structures. It should also be mentioned that, for this research, only a typical shade with
a medium reflectance of 0.5 and low transmittance of 0.1 was used. Further studies are
therefore required to look at the relationship between reflectance and transmittance and
[image:25.595.109.531.322.540.2]daylight illumination on the working plane for PS-TIM structures.
Fig. 9: Average number of hours per week when discomfort daylight condition exists
3.2
Heat loss and heat gain through windows with PS-TIM
To explore the key heat transfer paths that had a significant impact on the office’s
energy loads, a breakdown of annual heat loss and heat gain for conventional double
glazing is shown in Fig. 10. Under the specific assumptions in this simulation, the total
heat gain through the window (i.e. ‘transmitted solar’ plus ‘window other’) accounted
for approximately 60% of total heat gain in all five climate conditions, in which the solar
26
heat gains. Similarly, aside for Singapore, heat loss through the window accounted for
in excess of 50% of total losses across all climates. These results imply that strategies
for improving solar control and/or increasing the thermal resistance of the conventional
double glazed unit have the potential to significantly reduce the building’s heating and
[image:26.595.113.520.222.461.2]cooling load.
Fig. 10: Breakdown of annual heat loss and heat gain for the office with normal double glazing under five different climates
Fig. 11 illustrates the predicted heat losses and gains for all glazing combinations
under the five climate scenarios. As can be seen from Fig. 11(a), the potential to reduce
heat gains increased with decreasing slat spacing, this applicable across all climate
scenarios. All in, average reductions in heat gains of approximately 38%, 42% and 46%
for the 10 mm, 7.5 mm and 5 mm PS-TIMs respectively were obtained when compared
to ordinary double glazing. Similarly, with respect to heat loss, the average reduction in
heat loss was approximately 23%, 25% and 30% respectively. From these data, the
presence of PS-TIMs within the glazing unit have a more profound influence on window
heat gain than window heat loss in all climates. This can be explained by window heat
gain being dominated by directly transmitted solar radiation, this reduced by the
*
27
presence of the translucent parallel slats within the glazing unit. In contrast, although the
presence of PS-TIM increased the thermal resistance from one glazing pane to the other,
the overall heat loss through the double glazed window was also significantly affected
by the convective heat transfer on the external glazing’s surface (i.e. the exterior surface
convective heat transfer coefficient is determined by the wind speed as well as the
temperature difference between the window surface and ambient environment).
Fig. 11: (a) heat gain and (b) heat loss through windows (kWh/m2·yr) after applying different
configurations of PS-TIM under five climates
3.3
Energy performance after applying PS-TIM
Whilst the presence of PS-TIMs significantly affected overall window heat
losses and gains, these results do not indicate whether these effects are beneficial or not.
To explore this further, the total energy consumption of the office was predicted and the
results can be found in Fig. 12. This simulation considered not only the four glazing
types under the five climate scenarios but also included the realistic scenario where
interior shading would be deployed for the double glazing unit if the space was either
deemed to be over-illuminated or experiencing glare. To gain a fuller understanding of
the impact of the various factors at play, two HVAC operation schedules were
considered; (1) where the HVAC system operated only during the working hours of
[image:27.595.111.529.242.429.2]28
09:00-17:00 on weekdays and (2) where the HVAC system was under continuous
operation.
As can be seen from Fig. 12, when the HVAC system was in operation during
normal working hours, the 10 mm PS-TIM gave rise to the lowest energy consumption
of all glazing combinations under all climates tested. When compared to the double
glazed unit with the interior shade deployed, energy consumption was reduced by
between 13.7 and 18.6%, the majority of which due to reductions in both lighting and
cooling loads. However when compared to ordinary, unshaded double glazing, it is
evident that whilst lighting loads increased for all climates, cooling demands reduced
significantly therefore cooling proved to be the dominant mechanism through which
savings were made. Interestingly whilst the results showed that decreasing PS-TIM slat
spacing did result in lower heating energy consumption, there was a minimal to
negligible difference between the glazing unit combinations. For example, when
applying the 10mm PS-TIM to the London scenario, a 25.7% reduction in lighting
energy and 24.6% reduction in cooling energy was observed. However only 2.4% of
heat energy was saved. As such, for this particular study, the presence of PS-TIMs do
not offer any tangible benefits with respect to reducing overall heating demand. This can
be explained by the fact that, although the interstitial PS-TIM structure reduces the
internal heat loss through the window, it simultaneously reduces the solar heat gain that
is transferred from the window to the room during daytime for passive heating, this
evident in the hourly plots for two winter days in Fig. 13. The balance between these
two is therefore not sufficient to yield a significant reduction in heating demand when
29
30
Fig. 13: Hourly window heat gain, heat loss and space heating load for window system with and without PS-TIM when HVAC system operates between 09:00-17:00 on workdays on two winter days.
When the HVAC system was in operation continuously throughout the year, the
true benefits of TIMs were observed with respect to overall energy consumption (Fig.
14). For all cities, PS-TIM-based glazing units outperformed both shaded and unshaded
double glazed units, with the 7.5 mm PS-TIM structure providing the best energy saving
potential under all climates except Beijing, where the energy consumption of the 5 mm
slat spacing proved to be marginally lower than the 7.5 mm configuration. A close
inspection of the data revealed that under all climates, the 7.5 mm slat spacing gave the
highest reduction in cooling demands across all scenarios, with the 5 mm slat spacing
proving to result in the largest heating demand savings. Interestingly, under all year
HVAC operation, the results clearly show that PS-TIM-based structures do indeed
provide significant savings with respect to heating energy consumption. When compared
to shaded ordinary double glazing for Stockholm, London, Beijing and Hong Kong, the
31
the 5 mm slat spacing, 32.4%, 32.5%, 32.1% and 31.9% respectively. The reason behind
the improved performance of PS-TIMs with smaller slat spacings is that their increased
thermal resistance results in a dramatic reduction to overall heat loss during night time
for heating dominated climates, and a reduction in heat gains for cooling dominated
climates. In so doing, this significantly reduces the heating and cooling demands during
the night when the HVAC system is always on. This can be seen from Fig. 15, which
illustrates the hourly heat gains, losses and space heating energy consumption for a
window with and without the 7.5 mm PS-TIM on two winter days (48 h). From these
results, the application of PS-TIMs to this specific office example can provide a
32
Fig. 14: Annual heating, cooling and lighting energy consumption when HVAC system is always on.
[image:32.595.125.513.264.556.2]33
4.
Conclusion
EnergyPlus accompanied by a Computational Fluid Dynamics thermal model
and a ray-tracing optical model were used to predict the building performance of window
systems with and without the incorporation of Parallel Slats Transparent Insulation
Materials (PS-TIM) for a small office subject to five climate conditions. Their impact
on window heat gains and losses and on overall heating, lighting and cooling energy
consumption was analysed. RADIANCE was used to predict lighting performance with
respect to key daylighting and comfort metrics.
The results clearly show that the specification and application of glazing
systems, especially those containing PS-TIMs is complex and dependent on a number
of interrelated factors, and that these must be understood by the designer if they are to
be successfully incorporated into a building. For the specific office under test, it was
observed that when compared to ordinary double glazing, smaller slat spacings yielded
the most useful daylight, and reduced the occurrence of over illumination or visual
discomfort. Similarly, given that PS-TIM structures effectively comprise a series of
horizontal blinds encapsulated within a cavity, their use resulted in an overall reduction
in the necessity to deploy further shading devices, with smaller slat spacings resulting
in lower heat gains in the order of 38% - 46% due to their interference with incoming
solar radiation. The shading potential of PS-TIM structures and their relationship with
slat spacing was shown to be important as latitude increased. Conversely our results also
showed that smaller slat spacings gave rise to lower heat losses in the order of 23% to
30%, a product of the interstitial air cavity being broken into small, horizontal linear
cells where the cell walls provide additional viscous resistance to the onset of free
34
unit to the other, thereby increasing the thermal resistance of the glazing system. Overall,
the presence of the PS-TIM had a more profound influence on window heat gain than
on heat loss in all climates.
Beyond these observations, our results clearly demonstrated that the
effectiveness of TIM-based systems was also a function of the heating and cooling
(HVAC) schedule in operation. In the case of intermittent (daytime) operation only,
whilst a 10 mm PS-TIM slat spacing gave rise to the lowest energy consumption overall
(up to an 18.6% improvement), smaller slat spacings gave rise to equivalent if not
increased energy consumption over double glazed units. One of the key driving forces
behind this increase was the additional need for artificial lighting under such conditions
and the negligible difference in heat gains due to the slats interfering with incoming solar
radiation. However the true benefits of the PS-TIM system were evident when the
HVAC system was under continuous operation. Here the 7.5 mm PS-TIM proved to
yield the lowest overall energy demands, with a significant proportion of energy being
saved at night due to the increased thermal resistance of the PS-TIM structure thus
mitigating against night time heat loss, or in the case of a climate such as Singapore
against night time heat gains. Energy savings for this particular operation schedule
ranged from 28.1% to 35.8% overall.
In conclusion, the use of PS-TIMs over conventional glazing units offer a range
of benefits to the occupants of buildings, with their use and specification depending on
the priorities of the design team. Our research shows that for the case study office, either
the 10 mm or 7.5 mm slat spacings may provide the best compromise between energy
consumption and daylight metrics associated with daylight distribution and visual
35
in particular whether the more qualitative aspects of the daylit environment such as view
or uniformity are either suitable or desirable
Acknowledgements
This work was supported by the Faculty of Engineering, University of Nottingham and
the China Scholarship Council through a joint PhD studentship awarded to Yanyi Sun.
The authors would like to acknowledge Dr. Michael Kent from the University of
Nottingham for his invaluable advice on daylight metrics and Dr Stephen Lo from the
University of Bath for his precious feedback on this research. The authors are also
grateful for access to the University of Nottingham High Performance Computing
36
References:
1. Huang, Y., J.-l. Niu, and T.-m. Chung, Comprehensive analysis on thermal and
daylighting performance of glazing and shading designs on office building envelope in cooling-dominant climates. Applied Energy, 2014. 134: p. 215-228. 2. Gong, J., et al., Potential advantages of a multifunctional complex fenestration system with embedded micro-mirrors in daylighting. Solar Energy, 2016. 139: p. 412-425.
3. Allen, K., et al., Smart windows—Dynamic control of building energy
performance. Energy and Buildings, 2017. 139: p. 535-546.
4. Connelly, K., et al., Design and development of a reflective membrane for a novel Building Integrated Concentrating Photovoltaic (BICPV) ‘Smart Window’ system. Applied Energy, 2016. 182: p. 331-339.
5. Sun, Y., et al., Thermal evaluation of a double glazing façade system with integrated Parallel Slat Transparent Insulation Material (PS-TIM). Building and Environment, 2016. 105: p. 69-81.
6. Sun, Y., Y. Wu, and R. Wilson, Analysis of the daylight performance of a glazing system with Parallel Slat Transparent Insulation Material (PS-TIM). Energy and Buildings, 2017. 139: p. 616-633.
7. Arulanantham, M., T.P. Singh, and N.D. Kaushika, Convective heat transfer across transparent honeycomb insulation materials. Energy Convers. Mgmt 1994. 35(2): p. 111-116.
8. Kaushika, N.D., et al., Transparent insulation characteristics of honeycomb and slat arrays Energy and Buildings, 1994. 19(10): p. 1037-1041.
9. Kaushika, N.D. and P. Kumar, Convective effects in air layers bound by cellular honeycomb arrays. Journal of Scientific & Industrial Research, 2005. 64: p. 602-612.
10. Arulanantham, M. and N.D. Kaushika, Coupled radiative and conductive
thermal transfers across transparent honeycomb insulation materials. Applied Thermal Engineering, 1996. 16(3): p. 209-212.
11. Suehrcke, H., et al., Heat transfer across corrugated sheets and honeycomb transparent insulation. Solar Energy, 2004. 76(1-3): p. 351-358.
12. Wong, I.L., P.C. Eames, and R.S. Perera, Energy simulations of a transparent‐
insulated office façade retrofit in London, UK. Smart and Sustainable Built Environment, 2012. 1(3): p. 253-276.
13. Hoffmann, S., E.S. Lee, and C. Clavero, Examination of the technical potential of near-infrared switching thermochromic windows for commercial building applications. Solar Energy Materials and Solar Cells, 2014. 123: p. 65-80. 14. Kapsis, K., V. Dermardiros, and A.K. Athienitis, Daylight Performance of
Perimeter Office Façades utilizing Semi-transparent Photovoltaic Windows: A Simulation Study. Energy Procedia, 2015. 78: p. 334-339.
15. Lien, A.G., A.G. Hestnes, and O. Aschehoug, The use of transparent insulation in low energy dwellings in cold climates. Solar Energy, 1997. 59(1-3): p. 27-35. 16. Sun, Y., et al., Development of a comprehensive method to analyse glazing systems with Parallel Slat Transparent Insulation material (PS-TIM). Applied Energy, 2017. 205: p. 951-963.
37
18. Sun, Y., et al., Experimental measurement and numerical simulation of the thermal performance of a double glazing system with an interstitial Venetian blind. Building and Environment, 2016 103: p. 111-122.
19. McNeil, A., et al., A validation of a ray-tracing tool used to generate bi-directional scattering distribution functions for complex fenestration systems.
Solar Energy, 2013. 98: p. 404-414.
20. Andersen, M., et al., Bi-directional transmission properties of Venetian blinds: experimental assessment compared to ray-tracing calculations. Solar Energy, 2005. 78(2): p. 187-198.
21. Andersen, M., M. Rubin, and J.-L. Scartezzini, Comparison between ray-tracing simulations and bi-directional transmission measurements on prismatic glazing.
Solar Energy, 2003. 74(2): p. 157-173.
22. G. Ward and R. Shakespeare, Rendering with Radiance: The Art and Science of
Lighting Visualization, Revised Edition. 2004: BookSurge, LLC.
23. McNeil, A. and E.S. Lee, A validation of the Radiance three-phase simulation method for modelling annual daylight performance of optically complex fenestration systems. Journal of Building Performance Simulation, 2013. 6(1): p. 24-37.
24. CIBSE, "Society of Light and Lighting Handbook" The SLL Code for Lighting, in 2.1.4 Illumiance grid. 2012, The Chartered Institute of Building Services Engineers.: London.
25. EnergyPlus, EnergyPlus EMS Application Guide. 2015.
26. IEA and ECBCS, Annex 45 Energy Efficient Electric :ighting for Buildings: Lighting energy in buildings in Guidebook on Energy Efficient Electric Lighting for Buildings, Liisa Halonen, Eino Tetri, and P. Bhusal, Editors. 2006: France. 27. Sheppy, M., L. Gentile-Polese, and S. Gould, Plug and Process Loads Capacity
and Power Requirements Analysis. 2014, U.S. Department of Energy.
28. Nabil, A. and J. Mardaljevic, Useful daylight illuminances: A replacement for daylight factors. Energy and Buildings, 2006. 38(7): p. 905-913.
29. CIBSE, CIBSE Guide A: Environmental Design. 2015, CIBSE Publications: London.
30. Wienold, J., Dynamic simulation of blind control strategies for visual comfort and energy balance analysis. , in Building simulation 2007, the 10th international IBOSA conference. 2007: Beijing, China. p. 1197-204.
31. Wienold, J., Dynamic daylight glare evaluation. , in Builing simulation 2009 the 11th international IBOSA conference. 2009: Glasgow, UK. p. 44-51.
32. CIBSE, Code for Interior Lighting. 1994, The Chartered Institute of Building Services Engineers.: London. p. 262.
33. BRE, BREEAM Hea 1:Visual comfort. 2014: London.
34. CIBSE, "Society of Light and Lighting Handbook" in The SLL Code for Lighting 2.6.2 Illumiance uniformity. 2012.
35. Wienold, J. and J. Christoffersen, Evaluation methods and development of a new glare prediction model for daylight environments with the use of CCD cameras.
38
Appendix:
(1) The equivalent thermal conductivity of air cavity in double glazing unit (DG) 𝑇̅
ΔT -15 -10 -5 0 5 10 15 20 25 30 35
5 3.99 4.13 4.27 4.43 4.60 4.78 4.97 5.16 5.37 5.59 5.82 10 4.31 4.44 4.58 4.73 4.90 5.07 5.25 5.45 5.65 5.86 6.09 15 4.57 4.70 4.83 4.98 5.14 5.31 5.49 5.67 5.87 6.08 6.30 20 4.78 4.90 5.03 5.18 5.33 5.49 5.66 5.85 6.04 6.24 6.46 25 4.93 5.05 5.18 5.31 5.46 5.62 5.79 5.97 6.15 6.35 6.56 (2) The equivalent thermal conductivity of the air cavity between two panes with 10 mm
PS-TIM (10 mm PS-PS-TIM) 𝑇̅
ΔT -15 -10 -5 0 5 10 15 20 25 30 35
5 3.73 3.83 3.95 4.06 4.18 4.30 4.44 4.57 4.71 4.85 5.00 10 3.82 3.93 4.04 4.16 4.28 4.40 4.53 4.66 4.80 4.94 5.08 15 3.94 4.05 4.16 4.28 4.40 4.51 4.64 4.77 4.91 5.05 5.19 20 4.08 4.18 4.30 4.41 4.53 4.65 4.77 4.90 5.04 5.17 5.31 25 4.21 4.32 4.43 4.54 4.66 4.78 4.90 5.03 5.16 5.30 5.44
(3) The equivalent thermal conductivity of the air cavity between two panes with 7.5 mm PS-TIM (7.5 mm PS-PS-TIM)
𝑇̅
ΔT -15 -10 -5 0 5 10 15 20 25 30 35
5 3.64 3.75 3.86 3.98 4.09 4.21 4.33 4.44 4.56 4.71 4.86 10 3.66 3.77 3.87 3.99 4.10 4.22 4.35 4.46 4.58 4.72 4.87 15 3.69 3.80 3.90 4.01 4.13 4.24 4.35 4.48 4.60 4.75 4.90 20 3.73 3.83 3.94 4.05 4.16 4.27 4.39 4.51 4.64 4.79 4.93 25 3.77 3.87 3.98 4.09 4.20 4.32 4.43 4.55 4.68 4.83 4.97
(4) The equivalent thermal conductivity of the air cavity between two panes with 5 mm PS-TIM (5 mm PS-TIM)
𝑇̅
ΔT -15 -10 -5 0 5 10 15 20 25 30 35
![Fig. 2: Flow chart of the comprehensive method for complex fenestration* [17]](https://thumb-us.123doks.com/thumbv2/123dok_us/8562589.366107/7.595.110.529.300.702/fig-flow-chart-comprehensive-method-complex-fenestration.webp)