Human Behaviour-based Automatic Depression Analysis using
Hand-crafted Statistics and Deep Learned Spectral Features
Siyang Song
1Linlin Shen
2Michel Valstar
11 School of Computer Science, The University of Nottingham, UK
2College of Computer Science and Software Engineering, Shenzhen University, China
Abstract— Depression is a serious mental disorder that affects
millions of people all over the world. Traditional clinical diag-nosis methods are subjective, complicated and need extensive participation of experts. Audio-visual automatic depression analysis systems predominantly base their predictions on very brief sequential segments, sometimes as little as one frame. Such data contains much redundant information, causes a high computational load, and negatively affects the detection accu-racy. Final decision making at the sequence level is then based on the fusion of frame or segment level predictions. However, this approach loses longer term behavioural correlations, as the behaviours themselves are abstracted away by the frame-level predictions. We propose to on the one hand use automatically detected human behaviour primitives such as Gaze directions, Facial action units (AU), etc. as low-dimensional multi-channel time series data, which can then be used to create two sequence descriptors. The first calculates the sequence-level statistics of the behaviour primitives and the second casts the problem as a Convolutional Neural Network problem operating on a spectral representation of the multichannel behaviour signals. The results of depression detection (binary classification) and severity estimation (regression) experiments conducted on the AVEC 2016 DAIC-WOZ database show that both methods achieved significant improvement compared to the previous state of the art in terms of the depression severity estimation.
I. INTRODUCTION
Major Depression Disorder (MDD) is a psychiatric disorder defined as as a state of low mood with a problematic level of duration/severity (at least two weeks). Depression negatively impacts one’s day to day life, causing people to become reluctant or unable to perform activities [8]. It can negatively affect a person’s personal, work, school life, as well as sleeping, eating habits, general health, etc. and affects thoughts, behaviour, feelings, and sense of well-being [8]. In extreme conditions, people even die by suicide. Depression is the most prevalent mental health disorder and the leading cause of disability in developed countries [18]. A correct diagnosis can provide vital information about how to reduce inappropriate feelings of blame, shame, loneliness and low self-esteem for the corresponding patients and also facilitates
The work of Song is supported by Horizon Centre for Doctoral Training at the University of Nottingham (RCUK Grant No. EP/L015463/1). The work of Shen is supported by National Natural Science Foundation of China under Grant No. 61672357,U1713214 and the Science Foundation of Shenzhen under Grant No. JCYJ20160422144110140. The research reported in this paper was conducted in part by the NIHR Nottingham Biomedical Research Centre. This work has been funded by the National Institute for Health Research. The views represented are the views of the authors alone and do not necessarily represent the views of the Department of Health in England, NHS, or the National Institute for Health Research.
the communication between (potential) patients and health professionals about the support and services they need [5]. It is key to choosing which interventions are suitable for treating a patient.
Current clinical standards for depression assessment are subjective. They depend almost entirely on verbal report (clinical interview or questionnaire) of patients, their fam-ily, or caregivers [4]. Also, people’s depression evaluation requires extensive participation from experienced psycholo-gists and relies on their own understanding of the individual’s psychological testing records, history, self-reporting, and as-sessment during interviews [30]. Unfortunately, this is often a lengthy procedure and relevant data or experts may not always be accessible, which results in many patients missing the best chance for preventing or treating their depression at the early stages of depression.
In order to compensate for the subjective nature of the traditional methods, objective assessment methods to aid monitoring and diagnosis must be explored. Motivated by this, a large number of depression analysis methods based on non-verbal biomarkers have been proposed. Most of these adopted physical cues such as head movements [10], facial expressions [23], [20], [9], or audio signals [18], [4]. Con-sidering that such non-verbal information can be collected and analysed without the intervention of clinicians, this may help speed up the assessment and allow self-monitoring. Unfortunately, working directly from raw video and audio results in very high-dimensional data, and collecting large number of examples of clinical cases is difficult. Thus, a lower-dimensional solution is urgently needed.
Several works proposed in literature have developed auto-matic depression analysis methods based on audio or video data. Cohn et al. [4] have investigated the relation between human behaviour primitives (Facial Action Units (AU), vocal behaviour) and depression. They concluded that this encoding of human behaviour can provide vital information for depression assessment. Since human behaviour primitive descriptors have a much lower dimensionality than video data and systems for detecting them can be learned on non-clinical data, this paper adopts various detected human behaviour (see Fig. 1) from the video as the input.
Upper Lid Raiser
Lower Lip Depressor Jaw Drop Head turn right Head up
Eyes up Eyes turn left Lid Tightener
Fig. 1. Examples of human behaviour primitives.
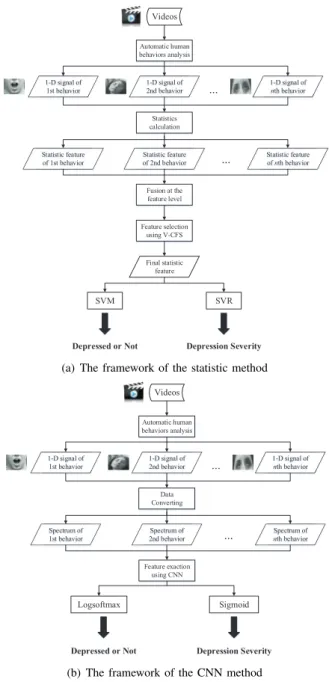
in one or few frames can be explained by various causes, e.g, a smile may be caused by feeling happy or feeling helpless. In addition, while predictions made on short segments can be fused to make a prediction for a whole sequence, the relations between individual behaviour primitives are abstracted away by the segment-level predictions. Motivated by this, we propose two global depression feature extraction methods for human behaviour signals from a whole video. The flow charts of both methods are demonstrated in Fig. 2. The first one calculates the statistics while the latter one applies Convolutional Neural Networks (CNN).
Since the human behaviour signals from each video are long and have varying lengths while our CNNs require a fixed input dimensionality, these human behaviour signals cannot be directly treated as the input to the network. To solve this problem, one of the recent hand-crafted method is proposed in [6]. They first extract facial landmarks to obtain the dynamic facial shape and head pose information. Then, combined with Gaussian Mixture Model (GMM), improved Fisher Vector (IFV) coding [17] and Compact Dynamic Feature Set (DFS) [7] were adopted to process time series data of variable length. In this paper, we present a data transformation method which converts the multi-channel behaviour primitive signals to two frequency spectrum maps of the same size. These spectrum maps are suitable to be fed into CNNs. To evaluate the performance of the proposed methods, several classification and regression experiments were conducted on the DAIC-WOZ database [11] provided by the AVEC 2016 depression challenge [20].
The motivations of this paper are exploring: 1. how to use low dimensional automatically detected visual-behaviour descriptors rather than high dimensional raw video data for depression analysis; 2. how to extract long-term dynamic feature from time-series data of variable length. The main contributions of this paper can be summarized as follows:
1) A statistics-based global feature extraction method for depression analysis is proposed.
2) Employing Fourier spectrum maps to allow variable duration time-series data to be used by CNNs for automatic human behaviour analysis.
3) A CNN-based global feature extraction method that can jointly learn depression analysis features from the amplitude and phase information of the spectrum maps.
Videos
Statistic feature of 1st behavior
Automatic human behaviors analysis
Statistic feature of 2nd behavior
Fusion at the feature level
Feature selection using V-CFS
Final statistic feature
SVM SVR
Depressed or Not Depression Severity
1-D signal of 1st behavior
Statistics calculation 1-D signal of 2nd behavior
1-D signal of
nth behavior
Statistic feature of nth behavior
...
...
(a) The framework of the statistic method
Videos
Spectrum of 1st behavior
Automatic human behaviors analysis
Spectrum of 2nd behavior
Feature exaction using CNN
Logsoftmax Sigmoid
Depressed or Not Depression Severity 1-D signal of
1st behavior
Data Converting 1-D signal of 2nd behavior
1-D signal of
nth behavior
Spectrum of
nth behavior
...
...
(b) The framework of the CNN method
Fig. 2. The frameworks of the proposed methods
II. RELATED WORK
Another vision-based method using hand-crafted features was proposed by Wen et al. [25]. In their framework, facial region sub-volumes that consist of 60 sequential facial regions are obtained and further processed to assure the detected face is real. Dynamic features are extracted by calculating the LPQ-TOP features of those sequential face regions in three dimensions: XY, XT and YT, where XY dimension provides the spatial information and the XT and YT dimensions provide temporal information. Then, sparse coding is employed to suppress the background noise for the proposed system and further represent the features as a liner combination of words from the K-SVD dictionary. Finally, MFA method [29] and SVR are used to generate the decisions from three dimensions, which fused later to give the final result of the depression diagnosis.
Alghowinem et al. [2] investigated the generalisability of a statistical method to detect depression severity cross-culturally. Low-level features were extracted to describe behavioural actions such as blink duration or head direction. Finally, statistics of these low-level features were utilized as the representation for each segment.
Due to the great success of deep learning in the computer vision area, Zhu et al. [31] present a DCNN-based approach that can predict the Beck Depression Inventory II (BDI-II) values from video data. The proposed system consist of two parallel CNNs; an appearance-DCNN to extract appearance features and a dynamics-DCNN to extract dynamic motion features by computing the optical flow between a certain number of consecutive frames and both of them can predict the depression values. At the end of their DCNN, two fully connected layers with a fine-tuning step are adopted to combine the results of appearance and dynamic models.
Besides video-based methods, audio-based automatic de-pression diagnosis methods also have been investigated. Williamson et al. [28], [27] achieved the best depression estimation result in the AVEC 2013 [22] and AVEC 2014 depression challenge [21]. Based on the audio data, their methods utilized formant frequencies and delta-mel-cepstra to represent underlying changes in vocal tract shape and dynamics. After that, by exploring the correlations between these features and using PCA, a 11-dimensional feature including five principal components for the formant domain and six principal components for the delta-mel-cepstral do-main is obtained. Finally, a Gaussian staircase model was introduced to generate the final regression result.
Instead of directly using the video or audio, the human behaviour displayed in videos and described in terms of behaviour primitives can directly provide relevant informa-tion for depression analysis. Cohn et al. [4] conducted three experiments to examine the usefulness of the non-verbal information in terms of detecting depression. Two video-based methods (FACS coding and AAM-video-based face tracking) and an audio-based method were adopted to evaluate facial or vocal expression. For each AU, the proportion of the interview in which each AU occurred, its mean duration, the ratio of the onset phase to total duration, and the ratio of onset to offset phase were extracted as FACS features,
while the mean, median, minimum, and maximum values of the mean, median, and standard deviation of frame to frame differences of each shape eigenvector were defined as the AAM feature. The vocal features were variability of vocal fundamental frequency and latency to respond to inter-viewer questions and utterances. Finally, SVM and logistic regression were introduced as the classifiers for video-based methods and audio-based method. The result showed that facial and vocal expression revealed depression and non-depression consistent with DSM-IV criteria.
However, the manual detection for AU and other behaviour is not suitable for automatic depression analysis because it is time-consuming to annotate and requires human experts trained to do so. Fortunately, automatic human behaviour detection methods have been developed recently [13], [3] that allow AU intensity, gaze direction, head pose and other behaviour primitives to be detected in each frame. Building on these works, this paper proposes two fully automatic depression analysis methods.
III. SEQUENCE-LEVEL REPRESENTATION OF BEHAVIOUR PRIMITIVES
In this section we describe the two sequence-level represen-tations proposed in this paper, one based on the statistics of the primitives, the other on their spectrum resulting from a Fourier-transformation.
A. Sequence-level statistics representation
Human behaviour primitives (e.g. AU, head pose, etc.) are either detected automatically in terms of their occurrence (binary result) or the intensity (real-valued or ordinal result) for each frame. To extend this representation to cover longer segments, we present two statistics-based representations.
For each of the human behaviour primitives that have intensity scores, 12 features are extracted to represent the time series over a whole video/segment. The first four features are the mean value, the standard deviation, median value and maximum value of the entire behaviour intensity signal. Since the minimum value for each behaviour is fixed (zero for most systems) and the range equals the difference between maximum and minimum value, they are not included in the feature set.
After that, we calculate the same statistics of the frame to frame difference, which we refer to as the first order derivative of the intensity time series:
d(n) = ∂h(n)
∂t =h(n)−h(n−1) (1)
where h(n) is defined as a behaviour signal of the video.
Consequently, another four features are generated. The last four features are mean value, standard deviation, median value and maximum value of the second order derivative of the human behaviour time series which denoted as
d2(n) =d(n)−d(n−1) (2)
For human behaviour signals that only have occurrence predictions, the mean value already contains their stan-dard deviation and median value information. Meanwhile, the maximum, the minimum and range are fixed values. Therefore, only three features are calculated, which are the mean value of the signal, the mean value of the first order derivative of the signal and the mean value of the second order derivative of the signal. As a result, three statistic descriptors are generated for each of them.
B. Spectral Representation of Behaviour Primitives
In practice, videos will have variable duration, and thus their behaviour primitive signals will have different lengths. In order to train and use CNNs to extract task-specified features that contain both global and local information, the whole time-series data should be treated as a single input. Therefore, the first task is to convert the behaviour primitive signals from different videos to have the same length. There are various solutions. One of them is to down-sample or re-sample all signals, which would distort and lose some tem-poral information of the original signals. Another solution is using a histogram of the feature values as they appear in a signal. Unfortunately, all temporal relations between frames are removed by using this method. An additional problem is that if the original videos have a large number of frames, resulting in long time series signals, then a CNN learning from this signal would have a large number of parameters that need to be trained.
To avoid these drawbacks, we transform the set of be-haviour signals to spectrum maps composed of two parts: amplitude spectrum and phase spectrum. The former contains the complete amplitude information of the signal while the latter contains the temporal relation information between frames. Let us define a human behaviour primitive signal
over a whole video as the time-series signal h(n), then its
Fourier transform spectrum can be obtained as follows:
H(w) =
Z ∞
−∞
h(n)e−jwndn. (3)
H(w)is a complex function and can be rewritten as:
H(w) =|H(w)|ejϕ(w)
=R(w) +jI(w) (4)
where R(w) = R−∞∞ h(n) coswndn is the real part of
H(w)andI(w) =R∞
−∞h(n) sin
wndnis the corresponding
imaginary part. Here, |H(w)| =pR2(w) +I2(w) denotes
the amplitude spectrum andϕ(w) = arctanhRI((ww))i denotes
the phase spectrum.
In practice, each human behaviour signal has a finite length. Then equation (3) can be rewritten as
H(kf1) = M−1
X
0
h(mTs)·e−j2πmkTsf1
=
N−1
X
0
h(mTs) [cos(2πmkTsf1)−jsin(2πmkTsf1)]
(5)
Amplitude spectrum transformation
Phase spectrum transformation
Amplitude spectrum ensemble
Phase spectrum ensemble
Human behaviour signals consisting of kframes (kequals to the length of the corresponding video)
Spectrum maps that have fixed length of m
Multi-channel spectrum maps that have fixed length of m
Multi-channel amplitude spectrum
Multi-channel phase spectrum
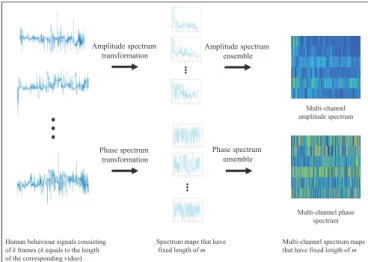
Fig. 3. Data transformation of variable length human behaviour signals in
a video to fixed-size two-dimensional amplitude and phase spectra.
where fs is the sample frequency; f1 is the frequency
resolution; N is the sampling points; f1 = Mfs; Ts = f1s.
Consequently, the amplitude can be denoted as
|H(kf1)|/M =
p
Re(H(kf1))2+Im(H(kf1))2, (6)
and the phase can be denoted as
arg(H(kf1)) =arctan
Im(H(kf1))
Re(H(kf1))
(7)
where Re(H(kf1)) =P
M−1
0 h(mTs)·cos(2πmkTsf1)and
Im(H(kf1) = P
N−1
0 h(mTs)· sin(2πmkTsf1) For each
human behaviour signal, the same M sampling points are
adopted, and thus the converted spectrum map of each human behaviour from all the videos is a 1-D signal of the same
length. Also, sinceM is much smaller than theN, the length
of the original data has been further reduced.
Suppose that there areabehaviour signals, then twoa×M
multi-channel spectrum maps would be generated from each
video, where one contains the a amplitude spectrum maps
while the other is made up ofaphase spectrum maps. Since
the spectrum map can be divided into two parts of the same size and both parts have the same information, then only one
part of size M2 + 1is used for constructing the final
multi-channel spectrum maps. Figure 3 illustrates this process.
IV. DEEP LEARNED SPECTRAL FEATURE EXTRACTION
M
ax
P
ooling Drop
out Full
y C onne cte d LogSoftMax C onvo lut ion 6 4 B at ch N or ma li za ti on R eL U C onvo lut ion 1 2 8 B at ch N or ma li za ti on R eL U C onvoluti on 6 4 B at ch N or ma li za ti on R eL U Amplitude Spectrum Phase Spectrum Input
(a) The CNN architecture for depression detection
A
ve
ra
ge
P
ooling Drop
ou t F ull y C onne cte d Sigmoid C onvo lut ion 6 4 B at ch N or ma li za ti on R eL U C onvo lut ion 1 2 8 B at ch N or ma li za ti on R eL U C onvoluti on 6 4 B at ch N or ma li za ti on R eL U Amplitude Spectrum Phase Spectrum Input
(b) The CNN architecture for depression severity estimation
Fig. 4. Two Spectral Behaviour Primitive CNN architectures
Deep learning techniques have achieved great success for feature extraction in the computer vision area, and has shown great potential in the one-dimensional signal processing area, such as speech recognition [1], or other time-series analysis [24]. For each video, after the spectral signal transformation, two multi-channel spectral human behaviour primitive maps have been generated. These spectrum maps contain both the temporally global and local information of the original human behaviour signals. Thus, it is interesting to see if a CNN can extract most related features from them.
The CNN architecture for depression detection (binary classification) is displayed in figure 4 (a), while The CNN architecture for depression severity estimation (regression) is shown in figure 4 (b). Both CNNs have three main
convo-lutional layers which consist of 64 filters of size7×1, 128
filters of size5×1, and 64 filters of size3×1, respectively.
Each of them are followed by a batch normalization layer and a ReLU layer.
Then, for depression detection, an average pooling layer of
size129×1 is adopted to down-sampling each feature map
into one value while a max pooling layer of the same size is introduced for the depression severity estimation CNN. After that, a Dropout layer is utilized to prevent both networks from overfitting. Finally, a fully connected layer with 64 input neurons and two output neurons is used for the binary classification, whose transfer function is the LogSoftMax. For the severity estimation, a fully connected layer with 64 input neurons and one output neurons is utilized for the regression and the transfer function is the Sigmoid. Here, the output of the fully connected convolution layer (64D) are treated as the deep learned features.
V. EXPERIMENTAL SETUP
A. The statistic method
The dimension of the calculated statistics feature vector is higher than the number of the training data that we used for our experiments. To avoid the classifier/regressor from
overfitting, Correlation-based Feature Selection (CFS) [12] is introduced to reduce the dimensionality of the statistic feature. However, because the training examples we used in this paper are not balanced, a voted version of CFS is employed to decide the final feature set. The procedure of V-CFS is explained in Algorithm (1).
Algorithm 1 Procedure of V-CFS
1: Divide the training set into a subsets with the same
number of examples, where each subset has equal de-pressed and non-dede-pressed examples. These subsets can be overlapped;
2: Applying CFS to each subset, resulting in k selected
feature sets;
3: Voting all features and ranking them in descending order
based on the frequency;
4: Select those top ranked features as the final feature set.
B. The CNN method
During the human behaviour primitives detection, occasion-ally the face or other related regions can not be detected in the video, which will lead to invalid predictions of their occurrence or intensity. Therefore, the results of those frames have been removed before the feature extraction. For regression experiments, all the training labels were divided by the maximum value to ensure their values between zero and one and all the predicted values obtained at the test phase were timed this maximum value to generate the final results. Before the CNN training, all the spectrum maps of human behaviour primitives were normalized using the z-norm to ensure they had the mean value of zero and standard deviation of one, where the sampling points for generating spectrum maps is 256 for this study.
For each video, a m×129 amplitude spectrum and a
m×129phase spectrum are concatenated as a training data
the training examples to the our CNNs described in Figure 4. The detection network is trained with logarithmic loss function while the severity estimation network is trained with the mean square error (MSE) loss function. Both networks are optimized by Stochastic Gradient Descent (SGD).
In this paper, since we conducted several different exper-iments, the size of training examples are different for each of them. For instance, the training examples for AU-based experiment using phase spectrum consists of 40 channels: the phase spectrum maps of 20 AUs and amplitude spectrum maps of 20 AUs while the training examples for gaze-based experiments are made up of 24 channels.
VI. EXPERIMENTAL RESULT
A. Database
The database utilized in this paper is the Distress Analysis Interview Corpus - Wizard of Oz(DAIC-WOZ) provided by AVEC 2016 depression analysis sub-challenge, which contains 107 clips for training and 35 clips for validation. The training set consists 44 female clips and 63 male clips, where 30 of them are depressed and 77 of them are non-depressed. Meanwhile, the development set have 19 female clips and 16 male clips. The database provided various video features, including facial landmarks, HOG (histogram of oriented gradients), gaze direction, head pose, emotion and AUs, for each participants. In this paper, only AUs, gaze directions and head poses have been used as the human behaviour signals for the depression analysis. Meanwhile, we treat 35 development clips as the test set which was not used during the training and validation process. The PHQ-8 scores that provided by AVEC 2016 were treated as the labels at the training, validation and testing stages. The hyper-parameters for all systems were optimized by five-fold cross validation based on the training set.
B. Evaluation measurements
In order to evaluate the performance of the proposed methods and compare them to previous works, recall, precision and F1 score are employed to measure the performance of the depression detection. Meanwhile, two measurements are introduced to measure the depression severity estimation performance, which are mean absolute error (MAE) and root mean square error (RMSE). The formulas of them are detailed in the equation (8) and (9)
MAE= 1
n
n
X
i=1
|fi−yi| (8)
RMSE=
v u u t
1
n
n
X
i=1
(fi−yi) 2
(9)
wherefi is the predicted PHQ-8 value andyi is the ground
truth.
TABLE I
GENDER-INDEPENDENT DEPRESSION DETECTION RESULT
Modality Classifier Recall Precision F1
Video baseline .428(.928) .600(.867) .500(.896)
[14] [14] 1.00(0.54) 0.35(1.00) 0.52(0.70)
[15] [15] 0.71(0.86) 0.56(0.92) 0.63(0.89)
[16] [16] N/A(N/A) N/A(N/A) 0.50(0.90)
AU SVM .333(.913) .667(.724) .444(.808)
Gaze SVM .167(.826) .333(.655) .222(.731)
Head Pose SVM N/A(N/A) N/A(N/A) N/A(N/A)
AU+Gaze+HP SVM .333(.826) .500(.704) .400(.760)
AU CNN .250(.913) .300(.778) .273(.667)
Gaze CNN .500(.913) .750(.778) .600(.840)
Head Pose CNN .583(.739) .538(.773) .560(.756)
AU+Gaze+HP CNN .583(.826) .636(.792) .609(.809)
C. Depression detection results
Table I displays the depression detection experimental re-sults, where the threshold used here for PHQ-8 is nine which is predefined by the database (values for class not depressed are reported in brackets). For both methods, We present the detection results of using each modality only as well as using them together. According to the table, all detection result obtained by the statistic method are not as good as the baseline and previous visual-based works. When the head poses were adopted as the input to calculate the features and train SVM, all the test data were predicted as Non-depressed. However, the CNN method generated much better result than the statistic method. Except treated AU as the input, the CNN features extracted from other three combinations outperformed results reported in [14] and achieved comparable results of the baseline and systems proposed in [16].
Due to that depressed males and depressed females may show dissimilar behaviour [19], the gender-specific exper-iments were also conducted. Considering that the number of the training clips for each gender are different and less than it for the gender-independent experiments, it is not fair to employ all clips for training. As a result, for female, 44 training clips were all used. For male and the gender-independent experiments, 10 different combinations of 44 clips were randomly selected from the corresponding training set. The reported results are the mean value of those 10 experiments. As illustrated in the Table II, there is a clear win for gender-specific by using statistic method. As for the CNN method, due to the limited amount of the training data, the result of the gender-specific experiment system haven’t show significant priority over the gender-independent system.
D. Depression severity estimation results
TABLE II
GENDER-SPECIFIC DEPRESSION DETECTION RESULT
Gender Modality Classifier Recall Precision F1
Female AU+Gaze+HP SVM .571(.833) .667(.769) .615(.800)
Male AU+Gaze+HP SVM .560(.782) .550(.797) .550(.788)
F+M AU+Gaze+HP SVM .333(.856) .570(.715) .418(.784)
Female AU+Gaze+HP CNN .429(.750) .500(.692) .462(.720)
Male AU+Gaze+HP CNN .480(.800) .550(.770) .504(.780)
F+M AU+Gaze+HP CNN .433(.863) .574(.743) .453(.793)
0 5 10 15 20 25
Groundtruth
0 5 10 15 20 25
Predictions
Fig. 5. The best result achieved for depression severity estimation
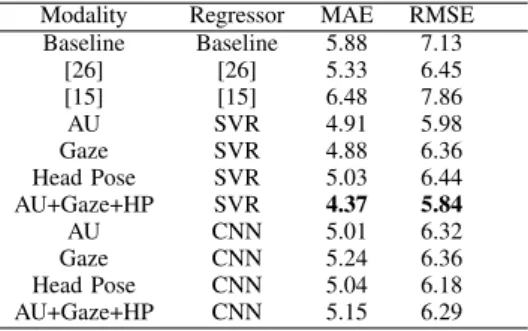
achieved significant improvement over the baseline as well as other previous proposed vision-based systems. Compared with the baseline, it obtained 18.1% relative improvement of RMSE and 25.7% relative improvement of MAE. In addition, it achieved 9.5% and 25.7% relative improvement over other two previous methods separately in terms of the RMSE. However, by using the CNN, the regression results are not as good as the statistic method. This may due to that the limited number of the training data, which means a well-trained model maybe overfitting. Fortunately, it still outperformed the baseline and previous works listed in the table.
Again, we have conducted the gender-specific experiments for the depression severity estimation. With the same setup as before, the statistic-based gender-specific systems get the better RMSE result over the gender-independent system. On the contrary, the CNN method generate the worse results for gender-specific system in terms of the RMSE. The reason may still the limited amount of the training data.
VII. CONCLUSION AND FUTURE WORK
Aiming to automatically and objectively analyze depression, this paper proposed two global feature extraction methods: the statistic method and the CNN method, which directly extract global features from those automatically detected human behaviour, such as AUs, gaze, etc. For statistic method, a voted version of CFS was introduced to reduce the dimension of the feature to keep the classifier or the regressor from overfitting. Since the hand-crafted statistic feature may lose important information of the original data, another method applied Convolution Nerual Networks to automatic
TABLE III
GENDER-INDEPENDENT DEPRESSION SEVERITY ESTIMATION RESULT
Modality Regressor MAE RMSE
Baseline Baseline 5.88 7.13
[26] [26] 5.33 6.45
[15] [15] 6.48 7.86
AU SVR 4.91 5.98
Gaze SVR 4.88 6.36
Head Pose SVR 5.03 6.44
AU+Gaze+HP SVR 4.37 5.84
AU CNN 5.01 6.32
Gaze CNN 5.24 6.36
Head Pose CNN 5.04 6.18
AU+Gaze+HP CNN 5.15 6.29
TABLE IV
GENDER-SPECIFIC DEPRESSION SEVERITY ESTIMATION RESULT
Gender Modality Regressor MAE RMSE
Female AU+Gaze+HP SVR 4.39 5.75
Male AU+Gaze+HP SVR 4.54 5.68
F+M AU+Gaze+HP SVR 4.37 5.84
Female AU+Gaze+HP CNN 5.36 6.47
Male AU+Gaze+HP CNN 5.12 6.31
F+M AU+Gaze+HP CNN 5.15 6.29
extract task-specified deep features. For this method, a data transformation algorithm is introduced to allow all data having the same length as well as significantly reducing the length of data. It converted the original time-series data of different numbers of frames to spectrum maps that have the same lengths. The depression detection experiment results illustrated that the CNN feature can generate competitive results compared to the previous works. Meanwhile, the depression severity estimation experiment results showed that both methods are capable of predict more precise PHQ-8 score over the baseline and other previous algorithms.
would be further enhanced. Therefore, Our future work will mainly focus on three parts: 1. Recording more data (may be more than several thousands clips including PHQ-9 and BDI reports, audios, videos, EEG, etc.) and construct a new database for automatic depression analysis; 2. Try more complex CNN architectures when enough data is available; 3. Introducing more modalities, such as other behaviour signals, audio, etc. to improve the performance of our frameworks.
REFERENCES
[1] Ossama Abdel-Hamid, Abdel-rahman Mohamed, Hui Jiang, Li Deng, Gerald Penn, and Dong Yu. 2014. Convolutional neural networks for
speech recognition. IEEE/ACM Transactions on audio, speech, and
language processing22, 10 (2014), 1533–1545.
[2] Sharifa Alghowinem, Roland Goecke, Jeffrey F Cohn, Michael Wag-ner, Gordon Parker, and Michael Breakspear. 2015. Cross-cultural
detection of depression from nonverbal behaviour. InAutomatic Face
and Gesture Recognition (FG), 2015 11th IEEE International Confer-ence and Workshops on, Vol. 1. IEEE, 1–8.
[3] Tadas Baltruˇsaitis, Peter Robinson, and Louis-Philippe Morency. 2016.
Openface: an open source facial behavior analysis toolkit. In
Applica-tions of Computer Vision (WACV), 2016 IEEE Winter Conference on. IEEE, 1–10.
[4] Jeffrey F Cohn, Tomas Simon Kruez, Iain Matthews, Ying Yang, Minh Hoai Nguyen, Margara Tejera Padilla, Feng Zhou, and Fernando
De la Torre. 2009. Detecting depression from facial actions and
vocal prosody. InAffective Computing and Intelligent Interaction and
Workshops, 2009. ACII 2009. 3rd International Conference on. IEEE, 1–7.
[5] Nick Craddock and Laurence Mynors-Wallis. 2014. Psychiatric
diagnosis: impersonal, imperfect and important. The British Journal
of Psychiatry204, 2 (2014), 93–95.
[6] Hamdi Dibeklioglu, Zakia Hammal, and Jeffrey F Cohn. 2017. Dy-namic Multimodal Measurement of Depression Severity Using Deep
Autoencoding. IEEE Journal of Biomedical and Health Informatics
(2017).
[7] Hamdi Dibeklio˘glu, Zakia Hammal, Ying Yang, and Jeffrey F Cohn.
2015. Multimodal detection of depression in clinical interviews.
In Proceedings of the 2015 ACM on International Conference on Multimodal Interaction. ACM, 307–310.
[8] Fifth Edition, American Psychiatric Association, and others. 1994. Diagnostic and statistical manual of mental disorders. Washington, American Psychological Association.
[9] Jeffrey M Girard, Jeffrey F Cohn, Mohammad H Mahoor, Seyedmo-hammad Mavadati, and Dean P Rosenwald. 2013. Social risk and depression: Evidence from manual and automatic facial expression
analysis. InAutomatic Face and Gesture Recognition (FG), 2013 10th
IEEE International Conference and Workshops on. IEEE, 1–8. [10] Jeffrey M Girard, Jeffrey F Cohn, Mohammad H Mahoor, S
Mo-hammad Mavadati, Zakia Hammal, and Dean P Rosenwald. 2014. Nonverbal social withdrawal in depression: Evidence from manual and
automatic analyses.Image and vision computing32, 10 (2014), 641–
647.
[11] Jonathan Gratch, Ron Artstein, Gale M Lucas, Giota Stratou, Stefan Scherer, Angela Nazarian, Rachel Wood, Jill Boberg, David DeVault, Stacy Marsella, and others. 2014. The Distress Analysis Interview
Corpus of human and computer interviews.. InLREC. 3123–3128.
[12] Mark Andrew Hall. 1999. Correlation-based feature selection for
machine learning. (1999).
[13] Shashank Jaiswal and Michel Valstar. 2016. Deep learning the
dynamic appearance and shape of facial action units. InApplications
of Computer Vision (WACV), 2016 IEEE Winter Conference on. IEEE, 1–8.
[14] Xingchen Ma, Hongyu Yang, Qiang Chen, Di Huang, and Yunhong Wang. 2016. DepAudioNet: An Efficient Deep Model for Audio based
Depression Classification. In Proceedings of the 6th International
Workshop on Audio/Visual Emotion Challenge. ACM, 35–42. [15] Md Nasir, Arindam Jati, Prashanth Gurunath Shivakumar, Sandeep
Nallan Chakravarthula, and Panayiotis Georgiou. 2016. Multimodal and multiresolution depression detection from speech and facial
land-mark features. InProceedings of the 6th International Workshop on
Audio/Visual Emotion Challenge. ACM, 43–50.
[16] Anastasia Pampouchidou, Olympia Simantiraki, Amir Fazlollahi, Matthew Pediaditis, Dimitris Manousos, Alexandros Roniotis, Geor-gios Giannakakis, Fabrice Meriaudeau, Panagiotis Simos, Kostas Marias, and others. 2016. Depression Assessment by Fusing High
and Low Level Features from Audio, Video, and Text. InProceedings
of the 6th International Workshop on Audio/Visual Emotion Challenge. ACM, 27–34.
[17] Florent Perronnin, Jorge S´anchez, and Thomas Mensink. 2010.
Im-proving the fisher kernel for large-scale image classification.Computer
Vision–ECCV 2010(2010), 143–156.
[18] Cynthia Solomon, Michel F Valstar, Richard K Morriss, and John Crowe. 2015. Objective methods for reliable detection of concealed
depression. Frontiers in ICT2 (2015), 5.
[19] Giota Stratou, Stefan Scherer, Jonathan Gratch, and Louis-Philippe Morency. 2015. Automatic nonverbal behavior indicators of
depres-sion and ptsd: the effect of gender. Journal on Multimodal User
Interfaces9, 1 (2015), 17–29.
[20] Michel Valstar, Jonathan Gratch, Bj¨orn Schuller, Fabien Ringeval, Dennis Lalanne, Mercedes Torres Torres, Stefan Scherer, Giota Stra-tou, Roddy Cowie, and Maja Pantic. 2016. AVEC 2016: Depression,
Mood, and Emotion Recognition Workshop and Challenge. In
Pro-ceedings of the 6th International Workshop on Audio/Visual Emotion Challenge. ACM, 3–10.
[21] Michel Valstar, Bj¨orn Schuller, Kirsty Smith, Timur Almaev, Florian Eyben, Jarek Krajewski, Roddy Cowie, and Maja Pantic. 2014. Avec 2014: 3d dimensional affect and depression recognition challenge. In Proceedings of the 4th International Workshop on Audio/Visual Emotion Challenge. ACM, 3–10.
[22] Michel Valstar, Bj¨orn Schuller, Kirsty Smith, Florian Eyben, Bihan Jiang, Sanjay Bilakhia, Sebastian Schnieder, Roddy Cowie, and Maja Pantic. 2013. AVEC 2013: the continuous audio/visual emotion and
depression recognition challenge. In Proceedings of the 3rd ACM
international workshop on Audio/visual emotion challenge. ACM, 3– 10.
[23] Peng Wang, Frederick Barrett, Elizabeth Martin, Marina Milonova, Raquel E Gur, Ruben C Gur, Christian Kohler, and Ragini Verma. 2008. Automated video-based facial expression analysis of
neuropsy-chiatric disorders. Journal of neuroscience methods 168, 1 (2008),
224–238.
[24] Zhiguang Wang, Weizhong Yan, and Tim Oates. 2017. Time series classification from scratch with deep neural networks: A strong
baseline. InNeural Networks (IJCNN), 2017 International Joint
Con-ference on. IEEE, 1578–1585.
[25] Lingyun Wen, Xin Li, Guodong Guo, and Yu Zhu. 2015. Automated depression diagnosis based on facial dynamic analysis and sparse
coding. IEEE Transactions on Information Forensics and Security
10, 7 (2015), 1432–1441.
[26] James R Williamson, Elizabeth Godoy, Miriam Cha, Adrianne Schwarzentruber, Pooya Khorrami, Youngjune Gwon, Hsiang-Tsung
Kung, Charlie Dagli, and Thomas F Quatieri. 2016. Detecting
Depression using Vocal, Facial and Semantic Communication Cues. In Proceedings of the 6th International Workshop on Audio/Visual Emotion Challenge. ACM, 11–18.
[27] James R Williamson, Thomas F Quatieri, Brian S Helfer, Gregory Ciccarelli, and Daryush D Mehta. 2014. Vocal and facial biomarkers of
depression based on motor incoordination and timing. InProceedings
of the 4th International Workshop on Audio/Visual Emotion Challenge. ACM, 65–72.
[28] James R Williamson, Thomas F Quatieri, Brian S Helfer, Rachelle Horwitz, Bea Yu, and Daryush D Mehta. 2013. Vocal biomarkers
of depression based on motor incoordination. InProceedings of the
3rd ACM international workshop on Audio/visual emotion challenge. ACM, 41–48.
[29] Shuicheng Yan, Dong Xu, Benyu Zhang, Hong-Jiang Zhang, Qiang Yang, and Stephen Lin. 2007. Graph embedding and extensions: A
general framework for dimensionality reduction. IEEE transactions
on pattern analysis and machine intelligence29, 1 (2007).
[30] T Yingthawornsuk, H Kaymaz Keskinpala, D Mitchell Wilkes, Richard G Shiavi, and Ronald M Salomon. 2007. Direct acoustic feature using iterative EM algorithm and spectral energy for classifying
suicidal speech.. InINTERSPEECH. 766–769.
[31] Yu Zhu, Yuanyuan Shang, Zhuhong Shao, and Guodong Guo. 2017. Automated Depression Diagnosis based on Deep Networks to Encode
Facial Appearance and Dynamics. IEEE Transactions on Affective