1
INVESTIGATING THE EFFECTS OF PARTICLE SHAPE ON NORMAL COMPRESSION AND OVERCONSOLIDATION USING DEM
J. P. de Bono, G. R. McDowell
University of Nottingham
Abstract
Discrete element modelling of normal compression has been simulated on a sample of breakable two-ball clumps and compared to that of spheres. In both cases the size effect on strength is
assumed to be that of real silica sand. The slopes of the normal compression lines are compared and found to be consistent with the proposed equation of the normal compression line. The values of the coefficient of earth pressure at rest K0,nc are also compared and related to the critical state fiction angles for the two materials. The breakable samples have then been unloaded to establish the stress ratios on unloading. At low overconsolidation ratios the values of K0 follow a well-established empirical relationship and realistic Poisson ratios are observed. On progressive unloading both samples head towards passive failure, and the values of the critical state lines in extension in q-p’ space are found to be consistent with the critical state angles deduced from the values of K0 during normal compression. The paper highlights the important role of particle shape in governing the stress ratio during both normal compression and subsequent overconsolidation.
Introduction
The authors have recently shown that it was possible using the discrete element method (DEM) to accurately model the one-dimensional compression of sand [1]. They showed that the normal compression line (NCL) for a sand should be linear when plotted on double-logarithmic axes, and that the compression index—i.e. the slope of the compression line in log e-log σ space—is a function solely of the size-hardening law for the particles. This proposition was further demonstrated by supplementary work modelling isotropic normal compression [2], which explored how isotropic boundary conditions give rise to anisotropic local shear stresses with the sample. For one-dimensional normal compression, the McDowell and de Bono [1] compression law is given by the equation:
log 𝑒 = log 𝑒y− 1
2𝑏log 𝜎
𝜎y (1)
where e is the current voids ratio, σ is the applied stress, ey is the value on the linear log-log plot at a stress corresponding to the yield stress σy, and b controls the size effect on average particle strength σav:
𝜎av∝ 𝑑−𝑏 (2)
where d is the particle diameter. This new compression law is able to correctly predict the slope of the NCL for a range of simulations using spheres, and demonstrates agreement with experimental results. To determine whether fracture should occur or not, the average octahedral shear stress within each particle was used:
𝑞 =13[(𝜎1− 𝜎2)2+ (𝜎
2 which was calculated from the average principal stresses (σ1, σ2, σ3) within each particle. This method provided a simple criterion to facilitate breakage taking into account multiple contacts as well as different contact forces on a particle surface, while avoiding the use of computationally-demanding agglomerates.
Following Jaeger [3], McDowell [4] measured the tensile strength of sand grains by diametral compression between flat platens as σ = F / d2, and showed that the stresses at failure for a given particle size satisfied a Weibull distribution of strengths. These distributions were described by a characteristic value of strength, σ0 and a Weibull modulus, m. In PFC3D, the value of octahedral shear stress, q induced in a particle compressed diametrically between two walls is proportional to F / d2 [2]; hence, McDowell and de Bono [1] assumed that for a particle under multiple contacts, the particle would break if the octahedral shear stress was greater than or equal to its strength, where the strengths of the particles satisfy a Weibull distribution of q values. Assuming the Weibull size effect is applicable to soil particles [e.g. 5], then the size-hardening parameter b in Equation 2 is equal to (3 / m); rewriting this equation in terms of octahedral shear strength, the particle strengths can be related to size by:
𝑞0∝ 𝑑−𝑚3 (4)
where q0 is the characteristic particle strength, and is a value of the distribution such that 37% (exp[-1]) of random strengths are greater (and for a given m is proportional to the mean), and m is the modulus (which is related to the coefficient of variation). It should be noted that the Weibull size effect need not necessarily apply (i.e. b ≠ 3 / m), and that a Weibull distribution of strengths exists for each size.
In their previous work on normal compression [1, 2, 6], the authors allowed each particle to split into two new fragments, with the new sphere fragments overlapping enough to be contained with the bounding parent sphere, while obeying conservation of mass. An alternative to using this replacement method would be using agglomerates [7–10], i.e. modelling individual soil particles as bonded groups of smaller particles, which fragment as and when the bonds between the sub-particles are broken. However, as discussed at more length in previous work [e.g. 1, 2], a problem with using agglomerates is that the sub-particles themselves cannot break, and therefore an arbitrary comminution limit exists. In addition, although agglomerates can provide useful qualitative insight, they are not capable of quantitatively modelling the evolution of voids ratio, as they contain internal voids which are released upon agglomerate fracture.
The following work presents the results of simulations similar to the authors’ previous work but featuring non-spherical particles. The simulation procedure used here is identical to that in the above references [1, 2, 6]; to which the readers are directed to for full details.
Particle Shape
3 For the first simulation—using spheres—a dense random sample of 640 particles of diameter 2 mm were created using the radius expansion method [11]. This sample is identical to that used in de Bono and McDowell [6]—although statistically slightly different to the sample used in McDowell and de Bono [1]; however the behaviour will be shown to be the same. The sample has an initial voids ratio of e0 = 0.84, which was as dense as possible without any locked-in contact forces. To minimise the boundary effects that are initially present, a larger sample size and/or smaller initial particles are desirable. However, exploratory simulations using larger samples resulted in the same compression behaviour, but were unable to reach high pressures due to the large number of particles covering a wide range of scales, which rendered the numerical timestep too small. Furthermore, any boundary effects that are present, affect both of the simulations presented here in a similar way.
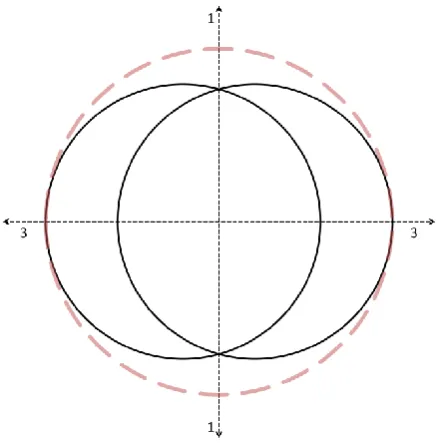
[image:3.595.74.294.355.577.2]For the sphere simulation, as mentioned above when a particle breaks it is replaced by two new smaller fragments, contained within the bounding parent sphere, shown in Figure 1. The axis joining the new spheres is aligned in the direction of the minor principal stress. Although the choice of replacing breaking particles with 2 fragments may seem simplified, previous exploratory simulations showed that the number of fragments produced from each breakage has no influence on the normal compression behaviour or the resulting particle size distributions [1].
Figure 1 Particle Breakage Mechanism for spheres
4
[image:4.595.75.442.80.387.2](a) (b)
Figure 2 Cross-section clump particle (a) and Particle Breakage Mechanism for clumps (b)
As for the spheres, when a clump breaks, it is replaced by two new smaller, identically-shaped fragments; however, in this case, due to the geometry, placement of the new fragments is not bounded by the parent clump. The new fragments are placed in a perpendicular manner, with the line connecting their centres of mass aligned with the longitudinal axis of the original parent clump. They are not created within the space of the parent clump, however their placement is bounded by the longitudinal extent of the original clump—indicated by the thin dotted lines in Figure 2(b). During placement, the new fragments are given a random perpendicular orientation by applying a rotation about the longitudinal axis of the parent clump; also indicated in the figure. Although this method of placement is somewhat arbitrary—and different to that for the spheres—it did not seem scientifically realistic, considering the geometry, to create the new fragments entirely within the original particle space (as was the case for spheres). Additionally, although the principal stress axes are not utilised in this case, one would however expect an entity with such an aspect ratio to fracture perpendicularly—as opposed to splitting longitudinally. The difference in breakage mechanism between the simulations is not a cause for concern, as McDowell and de Bono [1] demonstrated that the breakage mechanism itself has no effect on the compression behaviour; furthermore, for the case with clumps, there is less artificial overlap occurring immediately after fracture.
5 The two initial samples have the same number of particles, the same mass, and before application of the first vertical stress increment, the same voids ratio. The initial spheres (size d0 = 2 mm) are given random strengths from a Weibull distribution—with a characteristic value of octahedral shear strength, q0 of 37.5 MPa, and a modulus, m of 3.3. These strengths were determined from data obtained from single particle crushing tests by McDowell [4], and are the same as used in most of the authors’ previous work using spheres. The size-hardening law for the spheres is governed by Equation 4, which is used to attribute random strengths to new fragments. Due to their elongated shape, the clumps cannot be unambiguously defined by their diameter; however, for the sake of comparison, the initial clumps are given strengths from the same Weibull distribution—i.e. q0 = 37.5 MPa and m = 3.3. If one considers the equivalent or nominal diameter, de of the initial clumps—i.e. the diameter of a sphere of the same volume—then this will be equal to the initial diameter of the spheres (de = d0 = 2 mm), and is used with Equation 4 when attributing strengths to new clump fragments. Hence both materials have the same initial strengths, and follow the same size-hardening law.
To achieve a simple comparison, and to isolate the effects of particle shape, both simulations use the octahedral shear stress within a particle to determine breakage. The octahedral shear stress in a particle is calculated in the same manner for both spheres and clumps, from the average particle principal stresses. The principal stresses themselves are obtained from the average stress tensor, which is calculated in the software [11] according to:
𝝈̅𝑖𝑗(𝑝)= 1
𝑉(𝑝)∑ (𝑥𝑖 (𝑐)− 𝑥
𝑖 (𝑝)) 𝑁c(𝑝) 𝐹𝑗
(𝑐,𝑝)
(5) where V(p) is the volume of the particle (p), N
c(p) is the number of contacts on the particle, xi(c) and xi(p)
are the locations of the contact and particle respectively, and Fj(c,p) is the force acting on the particle
[image:5.595.67.370.573.741.2]at contact (c). For more discussion on the choice of breakage mechanism, the number of fragments, the influence of different hardening laws and the choice of breakage criteria, readers are directed to prior publications for further information [1, 2, 12, 13]. The default local damping scheme, with a coefficient of 0.7 is used whereby a damping force is applied to all particles. The Hertzian contact model is used, in which the particles are attributed a shear modulus and Poisson’s ratio, which are specified (along with other initial sample details) in Table 1
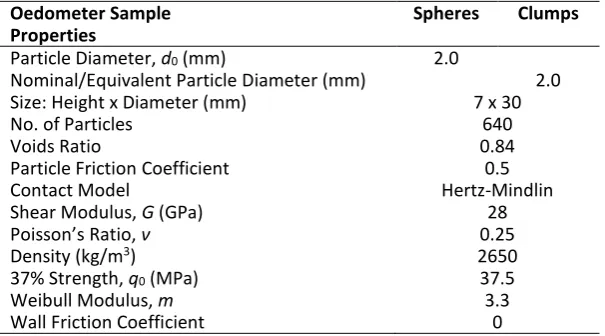
Table 1 DEM Parameters
Oedometer Sample Properties
Spheres Clumps
Particle Diameter, d0 (mm) 2.0
Nominal/Equivalent Particle Diameter (mm) 2.0 Size: Height x Diameter (mm) 7 x 30
No. of Particles 640
Voids Ratio 0.84
Particle Friction Coefficient 0.5
Contact Model Hertz-Mindlin
Shear Modulus, G (GPa) 28
Poisson’s Ratio, ν 0.25
Density (kg/m3) 2650
37% Strength, q0 (MPa) 37.5
Weibull Modulus, m 3.3
Wall Friction Coefficient 0
6
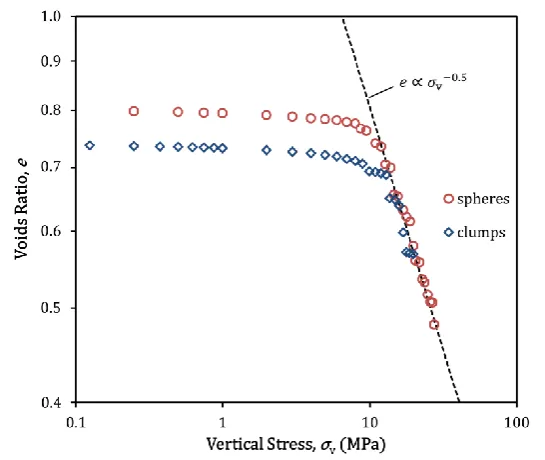
Normal Compression
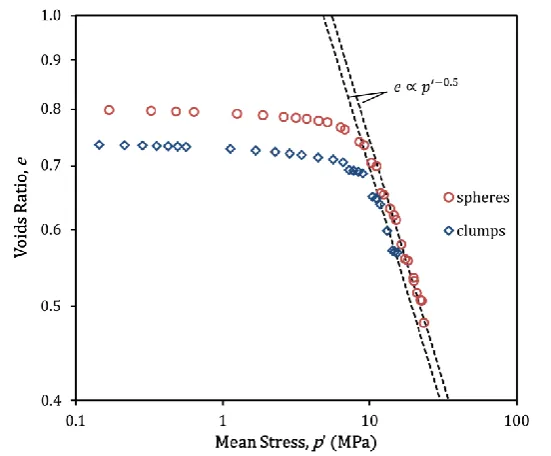
[image:6.595.74.347.333.563.2]The one-dimensional compression behaviour for the two simulations is given in Figure 3, with the data plotted using log e-log σ axes (instead of the conventional e-log σv axes used in the critical state soil mechanics framework [14]). As discussed in McDowell and de Bono [1], the use of double-logarithmic axes to describe the compression behaviour has been proposed experimentally [15] as well as theoretically [16]. The normal compression line for the spheres in Figure 3 has the expected slope according to Equation 1, with a negative gradient of approximately 0.5, and is in agreement with previously published results. For the clump simulation, the most obvious difference at first glance is that the compression line appears to begin at a significantly lower voids ratio. This is not surprising, because although the two samples are generated with the same number of particles, at the same voids ratio, in identically sized oedometers, the spheres are in a relatively very dense state, while the clumps are comparatively relatively loose. Upon application of the first stress increment, the sample of clumps experiences an immediate reduction in voids ratio as the clumps pack together more efficiently.
Figure 3 One-dimensional compression results for spheres and clumps
7
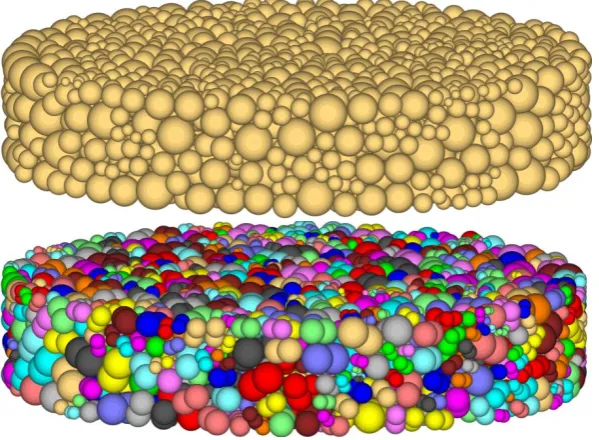
Figure 4 Images of the two crushed samples, spheres (a) and clumps (b)
What can also be observed from Figure 3 is the difference in yielding between the two samples. Although the first evidence of yielding—i.e. the first deviation from the approximately linear initial compression line—appears to occur at approximately the same vertical stress, the clumps demonstrate less rapid yielding. If one were to consider the point of maximum curvature to represent the yield stress, then the clump simulation would demonstrate a higher yield stress. This difference in yield stresses may intuitively be attributed to the different packing of the two samples; and the fact that the clumps, due to their lower voids ratio, have a larger number of contacts. For example, before yielding, at a vertical stress of 8 MPa—the sample of spheres has a voids ratio of approximately 0.77, while the clumps have a voids ratio of 0.71—and average coordination number for the spheres is 4.8 while for the clumps it is 5.8. Hence, on average, the spheres have fewer contacts, and are therefore likely to have larger induced octahedral shear stresses; the clumps have more contacts, and are therefore more likely be loaded more uniformly and have lower induced shear stresses. However, as de Bono and McDowell [13] noted, another factor is that because the clumps are packed more densely, and the voids are therefore smaller, for these voids to be filled, the fragments filling these voids must also be smaller—which requires more breakage, and therefore higher stress levels.
8
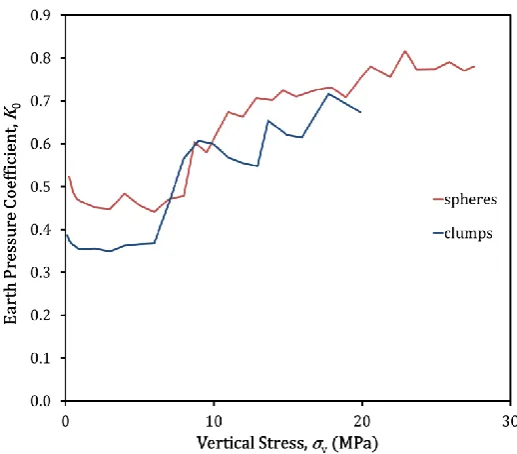
Figure 5 Coefficient of lateral earth pressure, K0,nc as a function of applied stress during normal compression, for spheres
and clumps
Recent work by McDowell et al. [19], who performed one-dimensional compression simulations using the same model but with a different aspect ratio, reported a K0,nc value of approximately 0.7 for spheres, slightly lower than the value found in the present simulations for the same material. This is almost certainly due to the different shape of the samples, their sample [19] had a different aspect ratio more suitable for triaxial shearing (it was taller than it was wide), which reduced the influence of the boundaries, and resulted in a larger volume of dense random packing. McDowell et al. [19] used their value of K0,nc to predict a critical state friction angle using the Jâky equation [20]:
𝐾0,nc= 1 − sin 𝜙 (6)
which in turn was used to predict a critical state friction constant Mc, using:
𝑀c=3−sin 𝜙6 sin 𝜙 (7)
Their predicted value of Mc (the subscript denoting triaxial compression) was then compared with the value measured from simple triaxial compression tests performed on isotropically compressed samples unloaded to different stresses; their results agreeing well. The focus in this paper is to compare the behaviour of two different-shaped particles, as well as to examine the behaviour of such samples upon unloading and reloading.
9
Figure 6 One-dimensional compression results for spheres and clumps plotted against mean stress
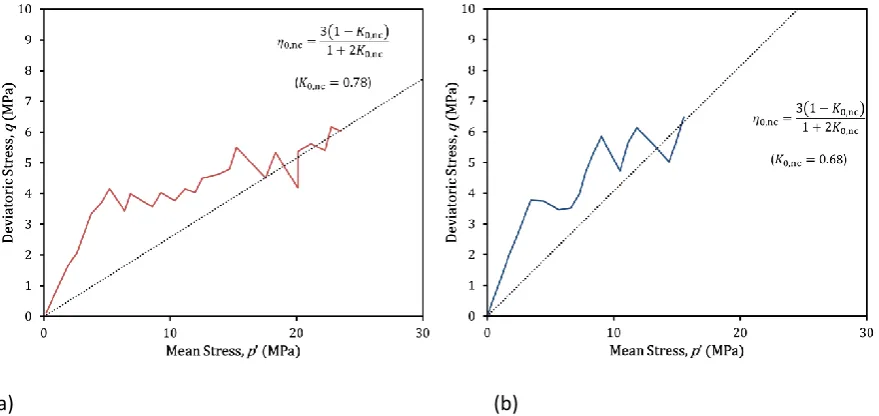
If the value of K0,nc achieves a constant value during normal compression, then, from the definitions of q and p’, a one-dimensional compression line can be plotted in q-p’ space, with constant proportionality between q and p’. The gradient of this normal compression line, η0,nc, is related to K0,nc by:
𝜂0,nc=3(1−𝐾1+2𝐾0,nc)
0,nc (8)
10
[image:10.595.77.517.77.285.2](a) (b)
Figure 7 Stress paths for spheres (a) and clumps (b) plotted in the q-p’ stress plane
Unloading
11
Figure 8 One-dimensional compression results showing unload and reloading behaviour
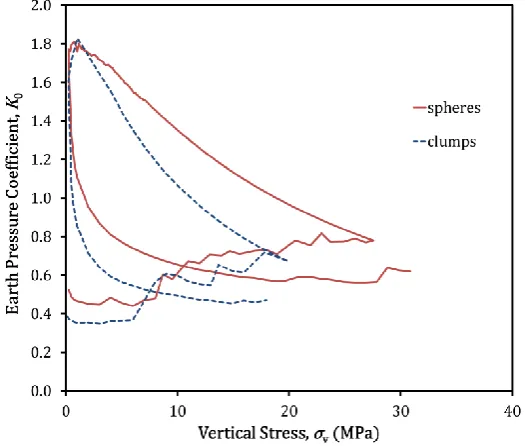
The lateral earth pressure coefficient K0 during unloading and reloading for the two samples is given in Figure 9. As expected [21–23], the value of K0 in both simulations increases quite dramatically as the stress level reduces. This is due to the horizontal stress reducing more slowly than the vertical stress as the sample is unloaded. Although the fact that the two samples were unloaded from different stresses makes a conclusive comparison difficult, it can be seen from Figure 9 that the value of K0 increases more rapidly for the clumps. This implies that the horizontal stress decreases more slowly than in the sample of spheres, which is also due to the increased ability of the clumps to interlock.
[image:11.595.79.342.468.691.2]12 Traditionally, the value of the lateral earth pressure coefficient for soils during unloading, K0 is often expressed as [24]:
𝐾0 = 𝐾0,ncOCR𝑎 (9)
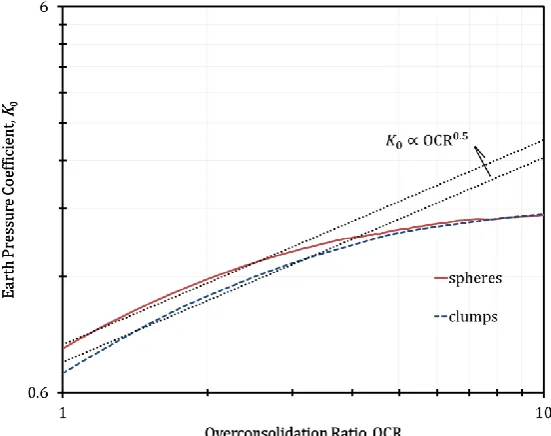
[image:12.595.76.352.383.601.2]where OCR is the overconsolidation ratio, and a is an empirical parameter. The value of a is typically around 0.5 [e.g. 23, 25] for clays; however, for sands, one can expect a similar relationship to exist, considering both granular soils and clays exhibit the same behaviour during normal compression, and Jâky’s equation applies to both [19]. Feda [21] noted that values as high as 0.6 are suitable for dense sands. The lateral earth pressure coefficients during unloading, K0 are plotted against values of OCR for the two simulations in Figure 10, on double logarithmic axes (where a power law of the form of Equation (9) would appear linear). The data shows that K0 increases rapidly at first, between OCRs of 1 and 3, beyond which K0 does not increase as rapidly. Interestingly, it appears that Equation (9), using an approximate value of a = 0.5 is sufficient to loosely describe the behaviour of both simulations for OCRs ranging between 1 and 3, which is shown in Figure 10 by the dotted lines. Equation (9) cannot be valid for the entire range of possible OCRs (otherwise K0 would tend to unrealistically large values [21]). In reality, the limiting value of K0 is a function of the frictional strength of the material. In Figure 9, both materials show approximately the same maximum value of K0, however it would be expected that the clumps would exhibit a higher value if unloaded from the same stress as the spheres.
Figure 10 Lateral earth pressure coefficient for the spheres and clumps as a function of overconsolidation ratio, plotted on double logarithmic axes
The unloading stress paths in q-p’ space are given in Figure 11(a) and (b). If one assumes that the material as a whole behaves elastically and isotropically immediately upon unloading, then the following expression can be deduced:
𝛿𝑞 𝛿𝑝′=
3(1−𝜈)
1+𝜈 (10)
13 spheres and 0.15 for the clumps. The observation that the clumps have a lower Poisson’s ratio seems logical, again due to the ability of the clumps to interlock and maintain their structure.
Wood [23] shows that beyond an overconsolidation ratio f 1, where the horizontal stress is the major principal stress, the stress path leads towards passive failure in q-p’ space, where:
𝑞 𝑝′
⁄ = −𝑀e (11)
and:
𝑀e= 6 sin 𝜙
3+sin 𝜙 (12)
14 (a)
[image:14.595.77.372.76.531.2](b)
Figure 11 Stress paths plotted in q-p plane showing unloading and reloading behaviour, for both spheres (a) and clumps (b)
It can also be seen in Figure 11 that the stress paths upon reloading do not appear to tend completely towards the original stress paths before unloading. It is clear from Figure 9 that this is due to the soils exhibiting lower values of K0 during recompression. The same behaviour has been observed experimentally, for example by Gao and Wang [26], albeit with a much smaller
discrepancy. Once the soil is back on the normal compression line, it is expected that the stress paths in Figure 11 would be on the original path, with the same slope, η0,nc (and K0,nc) prior to the unload-reload cycle, obeying Jâky’s equation.
Conclusions
15 same slope; confirming the slope to be solely a function of the particle size-hardening law, and which is linear when plotted on log-log axes. Particle shape was shown to give the clumps a lower, more realistic coefficient of lateral earth pressure at rest, K0,nc, due to the increased ability of the clumps to interlock.
The samples were unloaded, and both the spheres and the clumps demonstrated an increase in K0 during the unloading process, appearing to reach a maximum value. The coefficients during unloading also appear to agree with K0 = K0,ncOCR0.5 for overconsolidation ratios between 1–3. The unloading stress paths on the q-p’ plane were used to estimate bulk Poisson ratios, and the clumps gave a lower Poisson ratio compared to the spheres. On progressive unloading both samples tended towards passive failure. The values of ϕcrit estimated from K0,nc during normal compression using Jâky’s equation were found to be consistent with the slopes of the critical state lines in extension in q-p’ space as the samples progressed towards passive failure.
16
References
1. McDowell, G.R., de Bono, J.P.: On the micro mechanics of one-dimensional normal compression. Géotechnique. 63, 895–908 (2013).
2. McDowell, G.R., de Bono, J.P., Yue, P., Yu, H.-S.: Micro mechanics of isotropic normal compression. Géotechnique Lett. 3, 166–172 (2013).
3. Jaeger, J.C.: Failure of rocks under tensile conditions. Int. J. Rock Mech. Min. Sci. Geomech. Abstr. 4, 219–227 (1967).
4. McDowell, G.R.: On the yielding and plastic compression of sand. Soils Found. 42, 139–145 (2002).
5. McDowell, G.R., Amon, A.: The application of weibull statistics to the fracture of soil particles. Soils Found. 40, 133–141 (2000).
6. de Bono, J.P., McDowell, G.R.: Discrete element modelling of one-dimensional compression of cemented sand. Granul. Matter. 16, 79–90 (2014).
7. McDowell, G.R., Harireche, O.: Discrete element modelling of soil particle fracture. Géotechnique. 52, 131–135 (2002).
8. Harireche, O., Mcdowell, G.R.: Discrete element modelling of yielding and normal compression of sand. Géotechnique. 52, 299–304 (2002).
9. Cheng, Y.P., Bolton, M.D., Nakata, Y.: Discrete element simulation of crushable soil. Géotechnique. 53, 633–641 (2003).
10. Bolton, M.D., Nakata, Y., Cheng, Y.P.: Micro- and macro-mechanical behaviour of DEM crushable materials. Géotechnique. 58, 471–480 (2008).
11. Itasca: Particle Flow Code in 3 Dimensions. Itasca Consulting Group, Inc., Minneapolis, Minnesota (2005).
12. de Bono, J.P.: Discrete Element Modelling of Cemented Sand and Particle Crushing at High Pressures, (2013).
13. de Bono, J.P., McDowell, G.R.: An insight into the yielding and normal compression of sand with irregularly-shaped particles using DEM. Powder Technol. 271, 270–277 (2015).
14. Schofield, A., Wroth, P.: Critical State Soil Mechanics. McGraw-Hill, London (1968). 15. Pestana, J.M., Whittle, a. J.: Compression model for cohesionless soils. Géotechnique. 45,
611–631 (1995).
16. McDowell, G.R.: A physical justification for log e–log σ based on fractal crushing and particle kinematics. Géotechnique. 55, 697–698 (2005).
17. Hagerty, M.M., Hite, D.R., Ullrich, C.R., Hagerty, D.J.: One‐Dimensional High‐Pressure Compression of Granular Media. J. Geotech. Eng. 119, 1–18 (1993).
18. Nakata, Y., Kato, Y., Hyodo, M., Hyde, A.F., Murata, H.: One-dimensional compression behaviour of uniformly graded sand related to single particle crushing strength. Soils Found. 41, 39–51 (2001).
19. McDowell, G.R., Yue, P., de Bono, J.P.: Micro mechanics of critical states for isotropically overconsolidated sand. Powder Technol. 283, 440–446 (2015).
20. Jaky, J.: Pressure in silos. Proceedings of the 2nd Internation Conference on Soil Mechanics and Foundation Engineering. Vol 1. pp. 103–107 (1948).
21. Feda, J.: K0-Coefficient of Sand in Triaxial Apparatus. J. Geotech. Eng. 110, 519–524 (1984). 22. Okochi, Y., Tatsuoka, F.: Some factors affecting K0-values of sand measured in triaxial cell.,
(1984).
23. Wood, D.M.: Soil Behaviour and Critical State Soil Mechanics. Cambridge University Press (1990).
24. Schmidt, B.: Earth Pressures at Rest Related to Stress History. Can. Geotech. J. 3, 239–242 (1966).
17 26. Gao, Y., Wang, Y.H.: Experimental and DEM Examinations of K0 in Sand under Different