CITATIONS
0
READS
149
5 authors, including:
Some of the authors of this publication are also working on these related projects:
Changi reclamation and ground improvement project
View project
Numerical Analysis of Ground Improvement using Column-Like Elements
View project
Jian Chu
Nanyang Technological University
256PUBLICATIONS2,968CITATIONS
SEE PROFILE
Dariusz Wanatowski
University of Leeds
129PUBLICATIONS
663CITATIONS
SEE PROFILE
Jia He
Hohai University
19PUBLICATIONS
73CITATIONS
SEE PROFILE
All content following this page was uploaded by
Jian Chu
on 24 August 2015.
A type of pre-failure instability that occurs for medium loose to dense sand under fully drained conditions is studied in this paper. It is observed experimentally that when a specimen is sheared along a drained stress path involving a decrease in the effective mean stress, it becomes unstable after the stress path crosses an instability line (IL). The IL specifies a minimum stress ratio under which instability may occur. It is not unique but changes with the void ratio of the soil and the applied effective stresses. The instability occurring under drained conditions is different from that under undrained conditions. The differences and similarities between the two types of instability are pointed out. Practical implications of the study in analysing the failure mechanisms of granular soil slopes under various drainage conditions are discussed.
Instability of dilative sand
Notation
de1/dt axial strain rate dev/de1 strain increment ratio (dev/de1)i dev/de1 imposed to specimen
(dev/de1)s the maximum dev/de1 obtained in a drained test e void ratio
ec e at the end of consolidation ecr e at critical state
ed e at the end of drained shearing ef e at failure
eIL e at the onset of instability M effective stress ratio (= q/p¢) Mcs slope of critical state line Mf slope of failure line MIL slope of instability line
ML slope of constant stress ratio line p¢ mean effective stress (=(s ¢1 + 2s 3)/3)¢ q deviator stress (=(s1 – s3))
e1 axial strain
ev volumetric strain (compression positive) s1¢ effective major principal stress
s3¢ effective minor principal stress y state parameter (= e - ecr)
Introduction
Failure of geotechnical structures can be initiated by instability of soil. The term instability as used in this paper refers to a behaviour in which large plastic strains are generated rapidly due to the inability of a soil element to sustain a given load or stress. Instability is normally considered to have taken place when the stress state of a soil element satisfies a failure criterion, as in the conventional stability analysis. Instability may also occur prior to attaining the failure stress state. A typical example is static liquefaction, which occurs before the effective stress path reaches the failure line (FL) or the steady state line (SSL). So far, this so-called pre-failure instability has been studied mainly for saturated loose sand under undrained conditions (e.g. Andrade, 2009; Bobei et al., 2009; Chu and Wanatowski, 2008; Daouadji et al., 2010; di Prisco and Imposimato, 1997; Gajo et al., 2000; Ishihara, 1993; Lade, 1992; Lade and Pradel, 1990; Lade and Yamamuro, 2011; Lade et al., 1987, 1988; Leong et al., 2000; Monkul et al., 2011; Sawicki and Swidzinski, 2010; Seed, 1987; Wanatowski and Chu, 2007, 2012; Zhao and Zhang, 2014). However, there are several cases in which failure occurs under drained rather than undrained conditions. Using a fully instrumented model slope of a loose granular material, Eckersley (1990) observed that the failure in his model tests was initiated under essentially static, drained conditions, and the pore
1 2 3 4 5
4 W. L. Loke BSc, MEng
Project Manager/Offshore Engineer, Braemar Technical Services (Offshore) Pte Ltd, Singapore
5 J. He BEng, MEng, PhD
Research Fellow, School of Civil and Environmental Engineering, Nanyang Technological University, Singapore
1 J. Chu BEng, PhD
Professor and James M. Hoover Chair, Department of Civil, Construction and Environmental Engineering, Iowa State University, Ames, IA, USA
2 D. Wanatowski MSc, PhD
Associate Professor and Head, Department of Civil Engineering, Faculty of Science and Engineering, The University of Nottingham, Ningbo, China
3 W. K. Leong BSc, PhD
Senior Geotechnical Engineer, Arup, Houston, Texas, USA
water pressure increases in his model tests were only a consequence of the failure. In all his model tests, flow slides occurred in slopes that were gentler than the angle of repose of the sand. In re-analysis of the failure of the north dike of Wachusett dam, Olson et al.
(2000) concluded static liquefaction under a completely drained condition to be the likely failure mechanism. Therefore, there is a need to investigate the instability mechanisms of sand under drained conditions.
Although flow slide and liquefaction have been observed to occur mainly in relatively loose or contractive sand, there are cases where failure occurs in relatively dense or dilative sand. The first such a case was mentioned by Casagrande (1975). He described a natural phenomenon, which in the European Alps is known by the name Muren, in which large masses of dense granular talus liquefy and flow down a valley and suggested that dilation of soil was involved in the failure process. Several other cases were reported by Been et al. (1988), Fleming et al. (1989) and Terzaghi (1957). Been et al. (1987) also argued that the Nerlerk berm failure case (Lade, 1993; Sladen
et al., 1985) might have occurred for dilative sand, which lies below the SSL. Based on field observations, Fleming et al. (1989) have classified flow failure into two categories: the contractive and dilative flow slides. A well-documented case where flow slide occurred in dense sand was the Mississippi riverbank failure presented by Hadala and Torrey (1989) and Torrey and Weaver (1984). It has been concluded unambiguously by Hadala and Torrey (1989) and Schofield (1980) that the failure in the above case was not caused by static liquefaction or instability under undrained conditions, and this is confirmed by the laboratory tests. Although some explanations as to the causes of failure have been proposed (Hadala and Torrey, 1989; Schofield, 1980; Torrey and Weaver, 1984), the instability mechanisms of dilative sand have not been well established.
More recently, further studies on instability for different soils and different conditions were carried out. A topic that has drawn interest is the influence of fines on the instability and static liquefaction of sands (Lade and Yamamuro, 2011; Rahman and Lo, 2014; Rahman
et al., 2014; Zhao and Zhang, 2014). Compared with clean sand, sands with fines or silts are more compressible, which leads to a liability to pre-failure instability and static liquefaction (Bobei et al., 2009; Lade and Yamamuro, 2011; Rahman and Lo, 2014; Rahman
et al., 2014). Instability for unsaturated soil also received research interest (Buscarnera and Nova, 2011; Farooq et al., 2004; Zhao and Zhang, 2014). It was found that the instability of unsaturated soil along wetting path depends on the stress ratio and net confining pressure. Instability in an unsaturated sand occurs at higher suction when it is subjected to a higher stress ratio or a higher net confining pressure (Zhao and Zhang, 2014). Experimental studies on the instability of soil were also carried out under a water seepage condition, which can simulate the water infiltration into soil slopes (Lourenço et al., 2011). The constant shear drained (CSD) tests on soil specimens with increasing pore pressure in the upstream and free drainage in the downstream show pre-failure instability in the form of a rapid increase in axial strain before reaching the critical state line (CSL; Lourenço et al., 2011).
It should also be pointed out that numerical modelling of soil instability incorporating Hill’s instability criterion (Hill, 1958) has been carried out by several research teams to capture the phenomenon of soil instability (Andrade, 2009; Buscarnera and Whittle, 2013; Lignon
et al., 2009). Other numerical tools, especially discrete element methods (e.g. Nicot et al., 2011), were also adopted to explain the mechanism of pre-failure instability of granular materials. However, full understanding of pre-failure instability and, in particular, the ability to predict its occurrence, has not yet been achieved.
Slope failures are often caused not only by an increase in external load but also by a reduction in the effective mean stress, which is due to, for example, water infiltration into slopes (Leroueil, 2001; Zhu and Anderson, 1998). The Aberfan coal tip disaster in the UK, which killed 144 people (Bishop, 1973), is one of the examples. As suggested by Brand (1981), when investigating the failure mechanisms of slopes, the stress–strain behaviour of the soil along stress paths that simulate water infiltration should be studied. Such stress paths may be idealised as paths with constant shear stress, but decreasing mean effective stress, or the so-called constant shear-drained (CSD) tests performed under constant deviator stress (Anderson and Riemer, 1995; Anderson and Sitar, 1995; Brand, 1981; Zhu and Anderson, 1998). The instability behaviour of contractive sand along the CSD stress paths has been studied by several researchers (Anderson and Riemer, 1995; Chu
et al., 2003; Daouadji et al., 2010; Darve et al., 2004, 2007; Orense
et al., 2004; Wanatowski et al., 2010; Zhu and Anderson, 1998). However, only a few studies have been carried out to investigate how dilative sand responds to this type of stress paths (Chu et al., 2003; Darve et al., 2004; Wanatowski et al., 2010). There are also failure cases of dilative slopes that occurred under other than fully drained conditions (Adalier and Elgamal, 2002; Been et al., 1988; Fleming et al., 1989; Kokusho, 2003; Sento et al., 2004). These failure types cannot be simulated under fully drained or undrained conditions.
The objectives of this paper are to emphasise that dilative sand can become unstable under drainage conditions in which water infiltrates into the soil mass and to discuss the most important factors that govern the instability of dilative sand.
Material tested
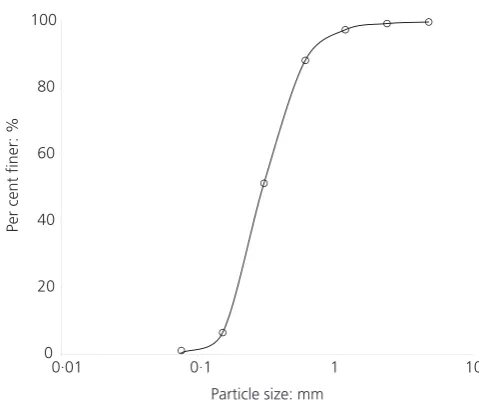
A marine-dredged sand was used for this experimental study. The sand was used for land reclamation of the Changi International Airport in Singapore. It was dug out from the seabed on the central eastern coast of Sumatra Island, administrated by Riau and Bangka-Belitung provinces of Indonesia, both adjacent to Singapore. The grain size distribution curve of the sand is shown in Figure 1. The basic properties of the sand are given in Table 1. The loose specimens were prepared by a moist tamping method in which the sand was pre-mixed to a moisture content of 5% and was saturated after the formation of the specimen. The dense specimens were prepared by pluviating sand into water. The nominal dimension of the specimen was 100 mm in diameter and 200 mm in height. A 1
summary of the drained instability tests presented and discussed in this paper is given in Table 2.
Testing arrangement
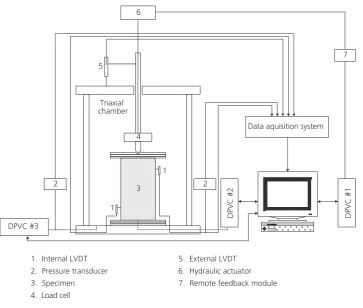
The experiments were carried out using a fully automated triaxial testing system as illustrated in Figure 2. A digital pressure volume controller (DPVC) with a remote feedback module was used to control the axial load by way of a hydraulic actuator. Another DPVC was used to control the confining stress. A third DPVC was used to control the back pressure by way of the base of the specimen and measure the volume change at the same time. The pore water pressure at the top of the specimen was measured by a pressure transducer. For the details of the testing arrangement, see the works of Leong et al. (2000) and Chu and Leong (2001).
Results
Instability line and instability under undrained conditions
Firstly, the results of some isotropically consolidated drained (CD) and undrained (CU) tests on loose sand are presented in Figure 3(a) to define the FL and the instability line (IL). The FL determined for
loose sand is the same as the CSL or the SSL (Chu, 1995; Leong
et al., 2000; Wanatowski and Chu, 2007). The IL is defined by the peak points of the effective stress paths of the undrained tests (Lade, 1992, 1993). The zone in between the FL and IL defines the zone of potential instability. It is known that that the IL is not unique but is affected by the void ratio of the soil, as shown in Figure 3(b). The IL is also affected by the effective confining stress. However, within a limited stress range, a linear IL can be defined as shown in Figure 3(a). The slope of the IL will be denoted as MIL in this paper.
When sand is dilative, that is, when the void ratio of sand is smaller than the void ratio at critical state, the specimen becomes dilative and a peak is no longer obtainable. In this case, the effective stress path in an undrained test will increase monotonically and approach a constant stress ratio line (CSRL) as shown in Figure 4. Chu et al. (2003) showed that a yield surface determined by CD tests on dense sand coincides with the CSRL obtained from the CU tests. Therefore, the CSRL can be used to determine the yield surface for dense sand. Chu et al. (2003) also reported that the CSRL is not sensitive to void ratio change, although generally the denser the soil, the higher the CSRL (Loke, 2004). Similar results were also reported by Chu and Lo (1993, 1994), Mooney et al. (1998), Tsukamoto et al. (1998) and Wanatowski et al. (2010). The CSL and
0
0·01 0·1 1 10
20 40 60 80 100
Per cent
finer:
%
[image:4.595.55.295.139.344.2]Particle size: mm
Figure 1. Grain size distribution curve of Changi sand
Type Mean size: mm
Uniformity coefficient
Specific gravity
Maximum void ratio
Minimum void ratio
Fines content: %
Shell content: % Marine
dredged sand
[image:4.595.316.554.148.346.2]0·3–0·35 2·0 2·60 0·916 0·533 0·4 14
Table 1. Basic properties of the tested sand
DR39 DR40 ISTD08 ISTD09 After consolidation
ec 0·657 0·647 0·668 0·663
q/p¢ 0 0 0 0
s3¢: kPa 150 150 100 200
Before reduction of cell pressure
ed 0·654 0·644 0·664 0·660
q/p¢ 1·21 1·31 0·97 0·57
s3¢: kPa 149 148 98 198
At the onset of instability
eIL 0·659 0·649 0·695 0·708
q/p¢ 1·64 1·66 1·40 1·40
s3¢: kPa 83 91 61 61
Table 2. Test conditions at different stages for dense specimens sheared along the CSD path
[image:4.595.56.555.706.782.2]the FL obtained from CD tests on specimens with comparable void ratios are also shown in Figure 4. It can be seen that the CSRL lies in between the FL and the CSL. The slopes of the FL and the CSRL obtained from Figure 4 are Mf = 1·63 and ML = 1·5, respectively.
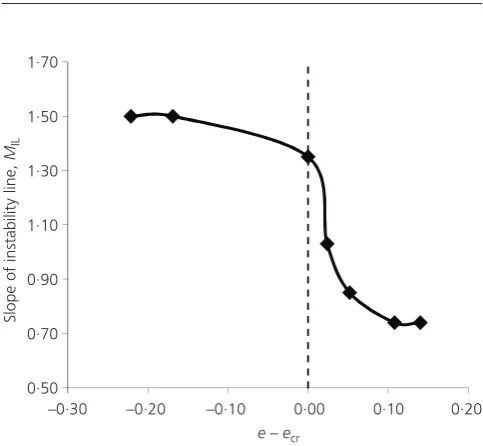
Based on Figures 3(b) and 4 and other similar test results, the slope of each IL, MIL, is plotted in Figure 5 against e – ecr, where e
is the void ratio at the instability point, and ecr is the void ratio at
the critical state at the same effective mean stress. It can be seen that the MIL levels off when the soil becomes extremely dense or
loose.
Instability of contractive sand under drained conditions It has been shown by several researchers that a loose sand specimen will become unstable under an undrained condition when the stress state applied to the specimen is within the zone of instability (Chu
et al., 2003; Darve et al., 2004; Lade, 1992; Leong et al., 2000; Sasitharan et al., 1993). An example for the tested soil is shown in the work of Chu et al. (2003). A loose sand specimen can also become unstable under drained conditions when the specimen is sheared along a CSD path. This has been discussed in detail in the work of Chu et al. (2003). The test results are summarised in Figure 6. The stress ratio at which the specimen becomes unstable,
MIL, increases with the decrease in void ratio. For more information
on Figure 6, see the work of Chu et al. (2003).
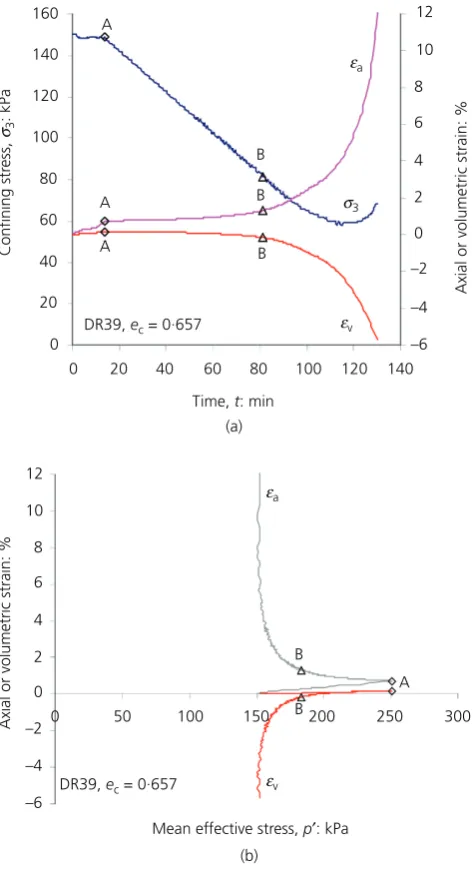
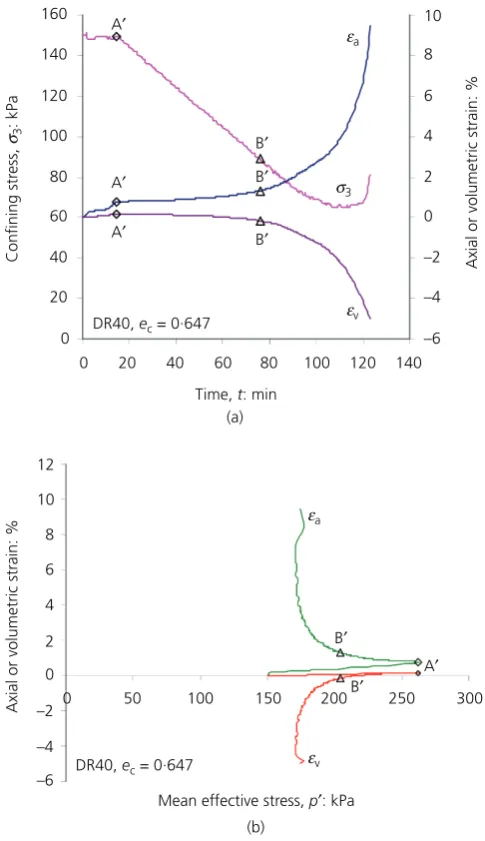
Instability of dilative sand under drained conditions Two tests, DR39 and DR40, were conducted on sand specimens with the consolidated void ratios of 0·657 and 0·647, respectively. The effective stress paths followed in the two tests are presented in Figure 7. After isotropic consolidation, the specimens were firstly sheared drained to points A (for DR39) or A¢ (for DR40). Starting from point A (or A¢), a CSD path was imposed with the mean stress reduced while the deviator stress was kept constant under a fully drained condition. The axial and volumetric strains plotted against time and the axial and volumetric strains plotted against mean effective stress curves are shown in Figures 8 and 9 for tests DR39 and DR40, respectively. It can be seen from Figures 8(a) and 9(a) that the axial strain started to increase abruptly at points B and B¢ for tests DR39 and DR40, respectively, signifying the onset of instability. The volumetric strain, ev, also began to develop
rapidly at point B (or B¢), respectively. It should be noted that the volumetric strain was in dilation. This observation is different from that for loose sand where the volumetric change is in compression (Chu et al., 2003).
To examine the stress state at point B (or B¢) where instability starts to develop, the CSL, the CSRL and the FL are plotted in Figure 7. The FL is drawn as the envelope to the two stress paths. As instability started at point B (or B¢), the line passing through point B (or B¢) defines the IL, which coincides with the CSRL (see
3 4
Data aquisition system
D
PV
C
#
2
D
PV
C
#
1
7 6
5
Triaxial chamber
DPVC #3
2 2
1
1
1. Internal LVDT 5. External LVDT
2. Pressure transducer 6. Hydraulic actuator
3. Specimen 7. Remote feedback module
[image:5.595.111.475.139.447.2]4. Load cell
Figure 2. Testing arrangement
Figure 7). The slope of this IL is higher than that of the CSL but lower than that of the FL. It can also be seen from Figures 8(b) and 9(b) that large yielding starts to develop at points B and B¢. Therefore, points B and B¢ are also two yield points for tests DR39 and DR40, respectively. This explains why the IL and the CSRL are the same for these two tests.
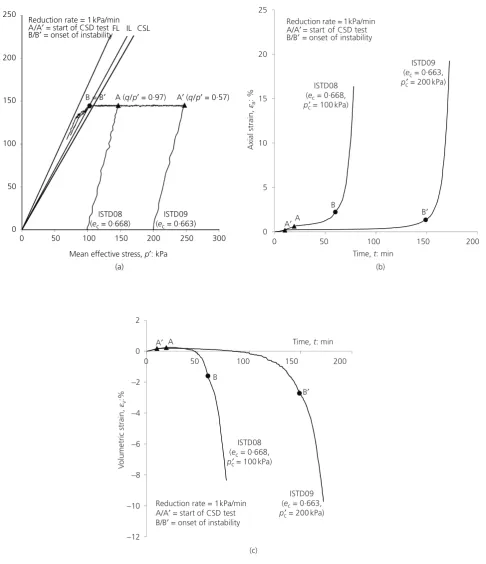
Another two CSD tests, ISTD08 and ISTD09, are conducted on specimens with consolidated void ratios of 0·668 and 0·663, respectively (Figure 10). As shown in Figure 10(a), the two tests are conducted along the same CSD path, but starting from two different initial stress states (points A and A¢). The axial strain and volumetric strain plotted against time curves are shown in Figures 10(b) and 10(c) for the two tests, respectively, from which the onset of instability points can be determined as points B and B¢. It can be seen from Figure 10(a) that points B and B¢ are almost the same. Using these points, the IL can be defined as shown in Figure 10(a). The IL is located above the CSL but below the FL.
Discussion
Physical meaningInstability as defined in this paper refers to behaviour in which large plastic strains are generated rapidly. For large plastic strain to develop, the soil must be in a yielding state. Therefore, yielding is the necessary condition for instability. This has been explained by Lade (1992) for the instability occurring for loose sand under undrained conditions. The IL, in fact, is associated with the yield surface and defines the conditions in which plastic yielding can take place (Chu et al., 1993, 2003; Imam et al., 2002; Lade, 1992; Wanatowski et al., 2010). As such, the zone of instability is defined without specifying the drainage condition. In fact, the instability
0
(a) 100
200 300 400 500
0 100 200 300 400
D
ev
ia
to
r
st
re
ss
,
q
:
kP
a
Mean effective stress, p¢: kPa Failure point from drained test
Peak point from undrained test of potential Zone instability
Critical state
line Instability
line
0
(b) 50
100 150 200
0 50 100 150 200
D
ev
ia
to
r
st
re
ss
,
q
:
kP
a
Mean effective stress, p¢: kPa CU21 Test ec MIL
CU21 0·864 1·35 CU26 0·888 1·05 CU20 0·916 0·89
CU44 0·972 0·74 CU26
CU20
[image:6.595.313.554.140.326.2]CU44
Figure 3. The instability line defined by undrained tests:
(a) instability line and zone of potential instability; (b) dependence of instability line on the void ratio of sand
Mean effective stress, p¢: kPa
Deviator str
ess,
q
: kPa
CSL – critical state line FL – failure line CU150
CU75 0
200 400 600 800
CSRL
CSL FL
1000
CSRL – constant stress ratio line
[image:6.595.292.555.145.593.2]0 200 400 600 800 1000
Figure 4. Effective stress paths of undrained tests on medium dense sand
0·50 0·70 0·90 1·10 1·30 1·50 1·70
–0·30 –0·20 –0·10 0·00 0·10 0·20
Sl
op
e
of
in
st
ab
ili
ty
li
ne
,
MIL
e – ecr
Figure 5. Relationship between the slope of the instability line,
MIL, and e – ecr
[image:6.595.62.292.147.516.2] [image:6.595.314.556.367.590.2]conditions of loose sand occurring under both undrained and drained conditions are defined by the same zone of instability, as shown in Figure 6 and discussed in detail by Chu et al. (2003) and Wanatowski et al. (2010).
As mentioned in the Introduction, instability will not occur under undrained conditions for dilative sand. This is because when a
dilative specimen is sheared under an undrained condition with the deviator load maintained constant, the pore water pressure will be reduced and the resulting effective stress moves inside the yield surface and thus a sustained plastic strain will not be generated.
When a dilative specimen is sheared under a drained condition along a CSD path, the effective stress path moves toward the FL. Once the stress path crosses the IL, that is, cuts the yield surface, plastic strain will be generated. Therefore, the instability that occurred for dilative specimens along the CSD path is also associated with plastic yielding. This explains why in tests DR39 and DR40, the onset of instability points, B and B¢, are also the yield points as can be seen from Figures 8(b) and 9(b) for tests DR39 and DR40,
Time, t: min 0
A A A
B
–6 –4 –2 0
Axial or volumetric strain:
%
Confining str
ess,
σ3
: kPa
2 4 6 8
B
B
10 12
DR39, ec = 0·657 εv
εa
σ3
20
(a) 40
60 80 100 120 140 160
0 20 40 60 80 100 120 140
Mean effective stress, p¢: kPa
Axial or volumetric strain:
%
DR39, ec = 0·657
–6 –4 –2 0
(b) 2
4 6 8 10 12
A B
B
0 50 100 150 200 250 300
εv
[image:7.595.44.272.138.397.2]εa
Figure 8. Results of test DR39: (a) variation of axial and volumetric strains with time curves; (b) axial and volumetric strains versus mean effective stress curve
0·60 0·70 0·80 0·90 1·00 1·10 1·20 1·30 1·40
0·00 0·02 0·04 0·06 0·08 0·10 0·12 0·14 0·16
Sl
op
e
of
in
st
ab
ili
ty
li
ne
,
MIL
e–ecr
[image:7.595.301.538.143.582.2]From CIU tests From CSD tests Instability curve from Figure 5 for loose sand
Figure 6. Comparison of the MIL–(e–ecr) relationship obtained from CSD tests and the instability curve defined in Figure 5 for loose sand
Mean effective stress, p¢: kPa
Deviator str
ess,
q
: kPa
CSRL – constant stress ratio line CSL – critical state line FL – failure line
0 50 100 150 200 250 300 350 400 450
CSL
A¢, q2 = 343 kPa A, q1 = 303 kPa CSRL
FL
B¢ DR40
DR39 B
DR39, ec = 0·657
DR40, ec = 0·647
0 50 100 150 200 250 300 350
Figure 7. Effective stress paths of tests DR39 and DR40
[image:7.595.41.277.460.669.2]respectively. For dense sand, the yielding condition appears to be defined by the CSRL, which assembles the yield surface, as shown in Figure 4. Therefore, the CSRL defines the stress ratio at which dilation and the associated large plastic yielding will start to develop. This explains why the onset of instability points B and B¢ coincides with the CSRL.
Although yielding is the necessary condition for instability to occur, it is not sufficient. In other words, plastic yielding does not necessarily cause a soil specimen to be unstable. Yielding means the development of a large strain for a small change in stress. It does not imply that the specimen will become unstable, which is characterised by a sudden increase in the strain increment rate, de1/
dt. Therefore, it cannot be assumed that yielding is automatically
the condition for instability. Whether instability can occur along a given stress path needs to be established separately.
Instability lines
The effective stress paths of the four instability tests DR39, DR40, ISTD08 and ISTD09 are presented in Figure 11 together with the CSL, the FLs and the ILs. It can be seen from Figure 11 that for dilative sand, the ILs are all above the CSL and the slope of the IL increases with the decrease in the void ratio of sand. It should be noted that the slope of the FL is not fixed but increases with the decrease in the void ratio, as the friction angle of dilative sand is dependent on the void ratio.
Combining the data obtained from instability tests on both contractive (Chu et al., 2003) and dilative sand, a relationship between the stress ratios of the ILs and the void ratios of soil at the onset of instability can be established in Figure 12. All the tests were conducted under the same effective confining stress (150 kPa), except ISTD08 and ISTD09. By connecting these points (shown by squares), an instability curve representing the change of the slope of IL with the void ratio at instability (eIL) can be obtained, as shown
in Figure 12. The void ratio and the effective stress ratio at the onset of conditional instability obtained from all the CSD instability tests are also plotted in Figure 12 as points for comparison. The data for loose to medium loose and medium dense to dense specimens are marked differently by diamonds (i.e. loose) and triangles (i.e. dense) in Figure 12. It can be seen from Figure 12 that a rather good agreement between the instability points and the instability curve is achieved, particularly for the dilative sand. It proves that the CSRL can be used to define the IL for dilative sand.
As shown in Figure 12, the instability conditions defined for soils with void ratios greater or smaller than the void ratio at the critical state are quite different. The slope of the IL, MIL, decreases abruptly
when the void ratio becomes slightly greater than the void ratio at the critical state. On the other hand, when the void ratio is getting smaller than the void ratio at the critical state, MIL only increases
marginally. This is consistent with the experimental observation that for medium loose to medium dense sand, the CSRL does not seem to change much with the void ratio (Mooney et al., 1998; Tsukamoto
et al., 1998), although generally speaking, the slope of the CSRL should increase with the decrease in the void ratio. It should also be pointed out that within a certain stress range, the stress ratio of the CSRL is not affected by the initial stress state and the stress history prior to an undrained path, as established by Chu and Lo (1994) and Kato et al. (2001). It can also be seen from Figure 12 that the instability curve seems to approach asymptotically some limiting
q/p¢ values when the sand becomes very loose or very dense. From the data available, q/p¢ at instability would be approximately constant and equal to 0·8 for e > 0·95 and 1·50 for e < 0·7.
Differences in instability for contractive and dilative sand
Although instability is observed to occur for both contractive (or loose) and dilative (or dense) sand, the types of instability can be
Time, t: min
εv
εa
σ3
DR40, ec = 0·647
A¢
A¢
A¢
B¢
0
(a)
–6 –4 –2 0
Axial or volumetric strain:
%
Confining str
ess,
σ3
: kPa
2 4 6 8 10
20 40 60 80 100 120 140 160
B¢
B¢
0 20 40 60 80 100 120 140
Mean effective stress, p¢: kPa
Axial or volumetric strain:
%
DR40, ec = 0·647
–2 0 2 4 6 8 10 12
–6
(b) –4
B¢
B¢
0 50 100 150 200 250 300
A¢
εv
[image:8.595.55.298.142.563.2]εa
Figure 9. Results of test DR40: (a) variation of axial and volumetric strains with time curves; (b) axial and volumetric strains versus mean effective stress curve
Mean effective stress, p¢: kPa 0
ISTD08 (ec = 0·668)
ISTD09 (ec = 0·663) 50
(a) 100
Deviator str
ess,
q
: kPa 150 B = B¢ A (q/p¢ = 0·97) A¢ (q/p¢ = 0·57)
200 250
Reduction rate = 1 kPa/min FL IL CSL A/A¢ = start of CSD test
B/B¢ = onset of instability
0 50 100 150 200 250 300 0
5 10 15 20 25
0 50 100 150 200
Axial strain,
εa
: %
Time, t: min Reduction rate = 1 kPa/min A/A¢ = start of CSD test B/B¢ = onset of instability
ISTD08 (ec = 0·668,
pc¢ = 100 kPa)
ISTD09 (ec = 0·663,
pc¢ = 200 kPa)
A A¢
B¢
B
(b)
-12
-10
-8
(c)
-6
-4
-2
ISTD08 (ec = 0·668,
pc¢ = 100 kPa)
ISTD09 (ec = 0·663,
pc¢ = 200 kPa)
0 2
0 50 100 150 200
Vo
lumetric strain,
εv
:%
Time, t: min
B
Reduction rate = 1 kPa/min A/A¢ = start of CSD test B/B¢ = onset of instability
B¢
[image:9.595.54.541.139.704.2]A A¢
Figure 10. Results of tests ISTD08 and ISTD09: (a) effective stress paths; (b) change in axial strain with time; (c) change in volumetric strain with time
different. First, for contractive sand, instability can occur under either drained or undrained conditions, whereas for dilative sand, instability cannot occur under undrained conditions. It needs to be pointed out that the undrained instability is different from the drained instability, as discussed in detail by Chu et al. (2003). The instability that occurs under undrained conditions is a runaway type because once runaway instability is initiated, the pore water pressure
and the axial strain rates increase dramatically and the soil specimen collapses almost instantly. In other words, the runaway instability cannot be stopped (Chu et al., 2003; Wanatowski and Chu, 2012). The instability under drained conditions is not a runaway type and has been called conditional instability by Chu et al. (2003). This is because the soil specimen does not collapse instantly during a drained instability test. Furthermore, instability under drained conditions can only take place along a stress path with a reduction in the mean effective stress. Therefore, for dilative sand, only conditional instability will occur under drained conditions, and this type of instability is different from the runaway type of instability occurring for contractive sand, for example, static liquefaction behaviour. Therefore, contractive sand can become unstable, but it does not imply that dense sand can liquefy as loose sand. The term ‘instability’ as defined in this paper carries a broader meaning than liquefaction or collapse of soil. In addition to runaway type of failure, the conditions where strain increases suddenly at an accelerating rate should also be established and considered in stability analysis.
Because the conditions for both types of instability are the same for loose sand, when a conditional instability occurs under a drained condition, it may evolve into a runaway instability if the drainage is insufficient to dissipate all the pore water pressure, for example, during an earthquake. This was observed in some of the tests. The drained collapse behaviour reported by Sasitharan et al. (1993) may belong to this type, in which ‘a slight increase in pore water (6·7 kPa) followed by a catastrophic undrained failure or collapse of the sample’ was observed. Similar observations were made by Eckersley (1990) from his model tests. He reported that static liquefaction had occurred for loose sand under essentially static, drained conditions (Eckersley, 1990). The flow slides in Eckersley’s experiments were initiated by slow water level increases, that is, along a stress path with a reduction in effective mean stress. Therefore, the flow slides in these model tests are likely caused by drained instability. Eckersley (1990) also reported that excess pore water pressures were developed after the start of flow slides. This pore water pressure building up was likely caused by the inability to dissipate fully the pore water, which was generated as a result of large volumetric strain development. The drained instability also offers an explanation for the failure of the north dike of Wachusett dam, where the failure is considered to occur under a completely drained condition (Olson et al., 2000).
It can also be explained now why under drained conditions instability was not observed in the tests reported by Lade et al. (1987), Chu (1991), and Leong et al. (2000). That is because those tests were conducted under a fixed stress state rather than along a stress path with reduction in the effective mean stress (i.e. the CSD path).
Other drainage conditions
It has been explained in previous sections that dilative sand does not become unstable under undrained conditions, but it may become unstable under fully drained conditions. It needs to be emphasised, however, that there are failure cases of dilative sand that occurred under other than fully drained conditions (e.g. Adalier and Elgamal, 2002; Sento et al., 2004; Torrey and Weaver, 1984). The possibility
0 50 100 150 200 250 300 350 400 450
0 50 100 150 200 250 300 350 400
Deviator stress,
q
: kPa
Mean effective stress, p¢: kPa FL1
ISTD08
DR39 DR40
IL1IL2CSL
FL2
ISTD09 Start of CSD test
[image:10.595.59.293.141.387.2]∆Onset of instability
Figure 11. Summary of drained instability tests on dense sand on
the q–p¢ plane
0·6 0·8 1·0 1·2 1·4 1·6 1·8
0·6 0·7 0·8 0·9 1·0 1·1
Ef
fe
ct
iv
e
st
re
ss
r
at
io
a
t
in
st
ab
ili
ty
,
MIL
Void ratio at instability, eIL
Instability curve (CIU tests) Loose sand (CSD tests) Dense sand (CSD tests)
Figure 12. Relationship between the stress ratio at instability and the void ratio of soil
[image:10.595.55.295.435.659.2]of dilating behaviour of soil masses prior to slope collapse has been reported in several case studies. For example, Been et al. (1987) argued that the Nerlerk berm failure case might have occurred for dilatant sand, which state lies below the SSL. Several other cases of flowslide in dilatant sand have been presented by Been et al. (1988). Fleming
et al. (1989) also reported that the Salmon Creek landslide in Marin Country, California, exhibited dominantly dilative transformation from solid landslide to liquid debris flow. Although some explanations for the causes of this and other failures have been proposed (Been et al., 1988; Hadala and Torrey, 1989; Schofield, 1980), the instability mechanisms of dilative sand have not been fully explained.
When dilative sand in a slope is subjected to conditions in which pore water pressure and volume of soil mass can change simultaneously, pre-failure instability can become possible, even though drainage conditions in such cases are neither completely undrained nor fully drained. These drainage conditions can be simulated experimentally by strain paths with the strain increment ratio (dev/de1) precisely
controlled (Chu, 1991; Chu and Leong, 2001; Chu et al., 1993, 2015; Lancelot et al., 2004; Sivathayalan and Logeswaran, 2007; Vaid and Eliadorani, 1998; Wanatowski and Chu, 2011; Wanatowski et al., 2008). When dev/de1 > 0 is imposed on dense sand, the pore water
pressure will reduce and instability will not occur. However, when an adequate dilative dev/de1 is imposed, the pore water pressure will
increase and instability becomes a possibility.
An example of instability test IST01, conducted on medium dense (i.e. dilative) sand, in order to illustrate that pre-failure instability can occur under dilatancy rate-controlled conditions, is shown in Figure 13.
The effective stress path obtained from test IST01 is plotted in Figure 13(a). The CSL and the FL obtained from drained triaxial tests on loose and dense Changi sand are also shown in Figure 13(a). The slopes of the CSL and the FL are Mcs = 1·35 and Mf = 1·63,
respectively (Chu et al., 2003; Wanatowski and Chu, 2007). As shown in Figure 13(a), the specimen in test IST01 was first sheared along a drained path from pc¢ = 150 kPa to a stress ratio of q/p¢ = 1·13. After
that, the external loads, that is, the axial load and the cell pressure, were maintained constant to conduct an instability check along a strain path of dev/de1 = –0·67. Under these conditions, instability
occurred at point B, and the axial strain and the pore water pressure increased suddenly, as shown in Figure 13(b). After occurrence of such instability, it was no longer possible to maintain the axial load constant, and thus the deviatoric stress dropped significantly, as can be seen in Figure 13(a). Physically, it was observed that the specimen collapsed suddenly, that is, pre-failure instability had occurred. This behaviour resembles the instability that occurs in loose sand under undrained conditions. This observation shows that dense sand, despite exhibiting strain hardening behaviour under an undrained condition, can become as vulnerable as loose sand when it is subjected to a dilative strain path.
It needs to be pointed out that the instability shown in Figure 13 was not only due to the control of a negative strain increment ratio but
also due to the stress state upon the instability check, as reported by Chu et al. (1993) and Chu and Leong (2001). Furthermore, the observed instability was not due to strain localization or rate/time effect, as explained by Chu et al. (1993) and Wanatowski and Chu (2011). This type of pre-failure instability can only occur when appropriate conditions are met (i.e. adequate strain increment ratio and stress state).
It is well known that when sand of different void ratios is sheared under a drained condition, the volumetric strain behaviour will
0
(a) 100
200 300
0 100 200 300
D
ev
ia
to
r
st
re
ss
,
q
: k
Pa
Mean effective stress, p¢: kPa CSL
Mcs = 1·35
A, B q/p¢ =1·13 IST01 (ec = 0·759)
A: Start of instability test (dεv/dε1= –0·67)
B: Onset of instability
FL
ηf = 1·63
–100 0 100 200
0 2 4 6
0 20 40
Po
re
w
at
er
p
re
ss
ur
e:
k
Pa
Axial
st
ra
in
,
e1
: %
[image:11.595.298.538.140.608.2]Time: min (b) Axial strain Pore water pressure IST01 (ec = 0·759)
A : Start of instability test (dεv/dε1 = –0·67) B : Onset of instability
A B
A
B
Figure 13. Pre-failure instability of dilative sand under dilatancy rate-controlled conditions: (a) effective stress path; (b) axial strain and excess pore water pressure versus time curves
be different. If the sand is loose, the volumetric strain will be contractive. On the other hand, if the sand is dense, it will dilate. A drained test defines the volumetric strain response of sand to a zero pore water pressure change condition. In other words, in order to keep the pore water pressure constant, the volume of the sand will have to change in the way as measured in a drained test. In a drained test, loose sand needs to contract, that is, to discharge water, to keep the pore water pressure constant. On the other hand, when volume change, that is, water discharge, is not allowed in an undrained test, the pore water pressure will increase. As a consequence, the effective confining stress will reduce, and the shear resistance will decrease accordingly. Static liquefaction or runaway instability will occur. Similarly, in a drained test, dense sand needs to dilate, that is, to absorb water in order to keep the pore water pressure constant. Under an undrained condition, water is not allowed to flow into the specimen, and hence the pore water pressure inside the specimen will reduce. This is why pre-failure instability does not occur in dense sand under undrained conditions. However, if a large enough dilatancy rate is imposed to force the specimen to dilate more than the sand would under a drained condition, extra water will have to flow into the specimen to generate the required dilation. As a result, positive pore water pressure will be developed. The dense specimen will become unstable under a dilatancy rate-controlled condition in a similar way to the loose sand under an undrained condition.
In a more general instability framework, the occurrence of runaway instability is affected by three main factors: (1) drainage conditions that can be simulated by the strain increment ratio imposed on the specimen (dev/de1)i; (2) the void ratio of the soil; and (3) the initial
effective stress ratio. As discussed in detail by Chu et al. (1993), Chu and Leong (2001) and Wanatowski and Chu (2011), the instability condition for both loose and dense sand can be expressed by the differences between the strain increment ratio imposed during a strain path test, (dev/de1)i, and the strain increment ratio of the soil,
(dev/de1)s, measured in a drained test.
As discussed earlier, the effect of the stress ratio on the instability behaviour of loose sand under undrained and fully drained conditions is specified by the IL shown in Figure 3(a). In recent studies, Chu et al. (2015) and Wanatowski and Chu (2011) demonstrated that the effective stress path obtained from a dilative strain path test on medium dense sand is very similar to that of the undrained test on loose sand. Therefore, a method similar to that under undrained and drained conditions may also be used to determine an ‘IL’ under dilatancy rate-controlled conditions by connecting the peak points of the effective stress paths obtained from dilative strain path tests (Chu et al., 2015; Wanatowski and Chu, 2011). Such a line determined for dense sand under dilatancy-controlled conditions can be referred to as the ‘peak stress line’. However, the effective stress ratio has to be sufficiently high to induce instability (Chu and Leong, 2001; Chu et al., 2015; Wanatowski and Chu, 2011).
Similar to the IL determined under undrained conditions, the peak stress line determined under dilatancy rate-controlled conditions is
associated with the yield surface and defines the conditions in which large plastic yielding can take place. As such, the zone of instability can be defined for specific drainage conditions if an appropriate strain increment ratio, dev/de1, is imposed on specimens. Pre-failure
instability can occur under any drainage conditions as long as the effective stress path can lead the stress state into the zone of potential instability. This behaviour is verified by the experimental data reported by Chu and Leong (2001), Chu et al. (2015) and Wanatowski and Chu (2011).
Conclusions
Experimental data, presented and discussed in this paper, demonstrate that dilative sand can become unstable under drainage conditions in which water infiltrates into soil mass. The factors governing the instability of dilative sand were discussed. The following conclusions can be derived from this study.
■ For loose to medium dense sand, pre-failure instability in the form of a rapid and sustained increase in the axial strain rate can occur under fully drained conditions. Unlike the pre-failure instability of loose sand under undrained conditions, such pre-failure instability is not a runaway type in which the pore water pressure and the axial strain rate increase very rapidly and the soil specimen collapses almost instantly. The pre-failure stability of sand under fully drained conditions can be restored by changing the stress conditions imposed. Furthermore, the average strain rate developed in this type of instability is smaller than that developed during a runaway type of instability. To differentiate this type of instability from the runaway type, it has been called ‘conditional’.
■ The conditional instability occurs when a specimen is sheared along a stress path with decreasing mean effective stress and when the stress path crosses the IL.
■ The slope of the IL changes with the void ratio. For loose sand, the IL determined for conditional instability is the same as that for runaway instability. For medium loose to medium dense sand, the ILs for the two types of instability are different.
■ The conditional instability may provide a better explanation for failures of slopes in which the drainage condition is more appropriately assumed to be drained rather than undrained. For instance, a drawdown in water table or dredging at the toe of a slope may cause the reduction of mean stress and lead to the conditional instability.
■ The pre-failure instability can occur under a dilatancy rate-controlled condition, that is, when the soil dilates. Furthermore, the conditions for the occurrence of pre-failure instability are defined based on the yielding conditions. Thus, the zone of instability can be determined regardless of the drainage conditions. The occurrence of pre-failure instability under generalised drainage conditions can be predicted using the frameworks developed by Chu et al. (1993, 2003) and Lade (1992, 1993) for undrained and drained conditions. Based on these frameworks, the peak
stress line can be determined by connecting the peak points of the effective stress paths determined from a series of dilative strain path tests conducted at different effective confining pressures. The validity of the peak stress line for predicting pre-failure instability of sand under dilative strain paths is verified by the experimental data reported by Chu and Leong (2001), Chu et al. (2015) and Wanatowski and Chu (2011).
ReFeRenCes
Adalier K and Elgamal AW (2002) Seismic response of adjacent
dense and loose saturated sand columns. Soil Dynamics and Earthquake Engineering22(2): 115–127.
Anderson SA and Riemer MF (1995) Collapse of saturated soil
due to reduction in confinement. Journal of Geotechnical Engineering121(2): 216–219.
Anderson SA and Sitar N (1995) Analysis of rainfall-induced
debris flows. Journal of Geotechnical Engineering121(7): 544–552.
Andrade JE (2009) A predictive framework for liquefaction
instability. Géotechnique59(8): 673–682.
Been K, Conlin BH, Crooks JHA et al.(1987) Back analysis of
the Nerlerk berm liquefaction slides: discussion. Canadian Geotechnical Journal24(1): 170–179.
Been K, Crooks JHA, Conlin BH and Horsfield D (1988)
Liquefaction of hydraulically placed sand fills. In Hydraulic Fill Structures (Van Zyl DJA and Vick SG (eds.)).
Geotechnical Special Publication 21, American Society of Civil Engineers, New York, pp. 573–591.
Bishop AW (1973) The stability of tips and spoil heaps. Quarterly
Journal of Engineering Geology 6(3–4): 335–376.
Bobei DC, Lo RSC, Wanatowski D, Gnanendran CT and Rahman MM (2009) Modified state parameter for characterizing
static liquefaction of sand with fines. Canadian Geotechnical Journal46(3): 281–295.
Brand EW (1981) Some thoughts on rain-induced slope failures.
Proceedings of the 10th International Conference on Soil
Mechanics and Foundation Engineering, Stockholm, vol. 3, pp. 373–376.
Buscarnera G and Nova R (2011) Modelling instabilities in triaxial
testing on unsaturated soil specimens. International Journal for Numerical and Analytical Methods in Geomechanics
35(2): 179–200.
Buscarnera G and Whittle AJ (2013) Model prediction of
static liquefaction: influence of the initial state on potential instabilities. Journal of Geotechnical and Geoenvironmental Engineering139(3): 420–432.
Casagrande A (1975) Liquefaction and cyclic deformation of
sands – a critical review. Proceedings of the 5th Pan American Conference on Soil Mechanics and Foundation Engineering,
Buenos Aires, vol. 5, pp. 79–133.
Chu J (1991) Strain Softening Behaviour of Granular Soils under
Strain Path Testing. PhD thesis, University of New South Wales, ADFA Campus, Canberra, Australia.
Chu J (1995) An experimental examination of the critical state
and other similar concepts for granular soils. Canadian Geotechnical Journal32(6): 1065–1075.
Chu J and Leong WK (2001) Pre-failure strain softening and
pre-failure instability of sand: a comparative study. Géotechnique
51(4): 311–321.
Chu J and Lo SCR (1993) On the measurement of critical state
parameters of dense granular soils. Geotechnical Testing Journal16(1): 27–35.
Chu J and Lo SCR (1994) Asymptotic behaviour of a granular soil
in strain path testing. Géotechnique44(1): 65–82.
Chu J and Wanatowski D (2008) Instability conditions of
loose sand in plane-strain. Journal of Geotechnical and Geoenvironmental Engineering136(1): 136–142.
Chu J, Lo SCR and Lee IK (1993) Instability of granular soils under
strain path testing. Journal of Geotechnical Engineering
119(5): 874–892.
Chu J, Leroueil S and Leong WK (2003) Unstable behaviour
of sand and its implication for slope stability. Canadian Geotechnical Journal40(5): 873–885.
Chu J, Wanatowski D, Loke WL and Leong WK (2015) Pre-failure
instability of sand under dilatancy rate controlled conditions.
Soils and Foundations (in press).
Daouadji A, AlGali H, Darve F and Zeghloul A (2010) Instability
of granular materials: experimental evidence of diffuse mode of failure for loose sands. Journal of Engineering Mechanics
136(5): 575–588.
Darve F, Servant G, Laouafa F and Khoa HDV (2004) Failure in
geomaterials: continuous and discrete analyses. Computer Methods in Applied Mechanics and Engineering193(27–29): 3057–3085.
Darve F, Sibille L, Daouadji A and Nicot F (2007) Bifurcations
in granular media: macro- and micro-mechanics approaches.
Comptes Rendus Méchanique335(9–10): 496–515.
di Prisco C and Imposimato S (1997) Experimental analysis and
theoretical interpretation of triaxial load controlled loose sand specimen collapses. Mechanics of Cohesive-Frictional Materials2(2): 93–120.
Eckersley JD (1990) Instrumented laboratory flowslides.
Géotechnique40(3): 489–502.
Farooq K, Orense R and Towhata I (2004) Response of
unsaturated sandy soils under constant shear stress drained conditions. Soils and Foundations44(2): 1–13.
Fleming RW, Ellen SD and Algus MA (1989) Transformation of
dilative and contractive landslide debris into debris flows – an example from Marin County, California. Engineering Geology
27(1–4): 201–223.
Gajo A, Piffer L and de Polo F (2000) Analysis of certain
factors affecting the unstable behaviour of saturated loose sand. Mechanics of Cohesive-Frictional Materials5(3): 215–237.
Hadala PF and Torrey VH (1989) Mississippi riverbank flowslides.
In The Art and Science of Geotechnical Engineering. Prentice-Hall, Englewood Cliffs, NJ, pp. 13–30.
Hill R (1958) A general theory of uniqueness and stability in
elastic-plastic solids. Journal of the Mechanics and Physics of Solids6(3): 236–249.
Imam SMR, Morgenstern NR, Robertson PK and Chan DH (2002)
Yielding and flow liquefaction of loose sand. Soils and Foundations42(3): 19–31.
Ishihara K (1993) Liquefaction and flow failure during
earthquakes. Géotechnique43(3): 351–415.
Kato S, Ishihara K and Towhata I (2001) Undrained shear
characteristics of saturated sand under anisotropic consolidation. Soils and Foundations41(1): 1–11.
Kokusho T (2003) Current state of research on flow failure
considering void redistribution in liquefied deposits. Soil Dynamics and Earthquake Engineering23(7): 585–603.
Lade PV (1992) Static instability and liquefaction of lose fine sandy
slopes. Journal of Geotechnical Engineering118(1): 51–72.
Lade PV (1993) Initiation of static instability in the submarine
Nerlerk Berm. Canadian Geotechnical Journal30(6): 895–904.
Lade PV and Pradel D (1990) Instability and plastic plow of
soils. I: experimental observations. Journal of Engineering Mechanics116(11): 2532–2550.
Lade PV and Yamamuro JA (2011) Evaluation of static
liquefaction potential of silty sand slopes. Canadian Geotechnical Journal48(2): 247–264.
Lade PV, Nelson RB and Ito YM (1987) Nonassociated flow
and stability of granular materials. Journal of Engineering Mechanics113(9): 1302–1318.
Lade PV, Nelson RB and Ito YM (1988) Instability of granular
materials with nonassociated flow. Journal of Engineering Mechanics114(12): 2173–2191.
Lancelot L, Shahrour I and Al Mahmoud M (2004) Instability
and static liquefaction on proportional strain paths for sand at low stresses. Journal of Engineering Mechanics130(11): 1365–1372.
Leong WK, Chu J and Teh CI (2000) Liquefaction and instability
of a granular fill material. Geotechnical Testing Journal23(2): 178–192.
Leroueil S (2001) Natural slopes and cuts: movement and failure
mechanisms. Géotechnique51(3): 197–243.
Lignon S, Laouafa F, Prunier F, Khoa HDV and Darve F (2009)
Hydro-mechanical modelling of landslides with a material instability criterion. Géotechnique59(6): 513–524.
Loke WL (2004) Failure Mechanisms of Gentle Granular Slopes.
MEng thesis, Nanyang Technological University, Singapore.
Lourenço SDN, Wang GH and Chu J (2011) Aspects of sand
behaviour by modified constant shear drained tests.
Environmental Earth Science62(4): 865–870.
Monkul MM, Yamamuro JA and Lade PV (2011) Failure,
instability, and the second work increment in loose silty sand.
Canadian Geotechnical Journal48(6): 943–955.
Mooney MA, Finno RJ and Viggiani MG (1998) A unique critical
state for sand? Journal of Geotechnical and Geoenvironmental Engineering124(11): 1100–1108.
Nicot F, Daouadji A, Laouafa F and Darve F (2011) Second-order
work, kinetic energy and diffuse failure in granular materials.
Granular Matter13(1): 19–28.
Olson SM, Stark TD, Walton WH and Castro G (2000) 1907 static
liquefaction flow failure of the north dike of Wachusett dam.
Journal of Geotechnical and Geoenvironmental Engineering
126(12): 1184–1193.
Orense R, Farooq K and Towhata I (2004) Deformation behaviour
of sandy slopes during rainwater infiltration. Soils and Foundations44(2): 15–30.
Rahman MM and Lo SR (2014) Undrained behavior of sand-fines
mixtures and their state parameter. Journal of Geotechnical and Geoenvironmental Engineering140(7): 04014036.
Rahman MM, Lo SCR and Dafalias YF (2014) Modelling the static
liquefaction of sand with low-plasticity fines. Géotechnique
64(11): 881–894.
Sasitharan S, Robertson PK, Sego DC and Morgenstern NR
(1993) Collapse behavior of sand. Canadian Geotechnical Journal30(4): 569–577.
Sawicki A and Swidzinski W (2010) Modelling of pre-failure
instabilities of sand. Computers and Geotechnics37(6): 781–788.
Schofield AN (1980) Cambridge geotechnical centrifuge
operations. Géotechnique30(3): 227–268.
Seed HB (1987) Design problems in soil liquefaction. Journal of
Geotechnical Engineering113(8): 827–845.
Sento N, Kazama M, Uzuoka R, Ohmura H and Ishimaru M
(2004) Possibility of postliquefaction flow failure due to seepage. Journal of Geotechnical and Geoenvironmental Engineering129(8): 727–737.
Sivathayalan S and Logeswaran P (2007) Behaviour of
sands under generalized drainage conditions. Canadian Geotechnical Journal44(2): 138–150.
Sladen JA, D’Hollander RD, Krahn J and Mitchell DE (1985) Back
analysis of the Nerlerk berm liquefaction slides. Canadian Geotechnical Journal22(4): 579–588.
Terzaghi K (1957) Varieties of Submarine Slope Failures.
Norwegian Geotechnical Institute, Publication 25, Oslo, pp. 1–16.
Torrey VH and Weaver FJ (1984) Flow failures in Mississippi
riverbanks. Proceedings of the 4th International Symposium on Landslides. Canadian Geotechnical Society, Toronto, ON, Canada, vol. 2, pp. 335–360.
Tsukamoto Y, Ishihara K and Nonaka T (1998) Undrained
deformation and strength characteristics of soils from reclaimed deposits in Kobe. Soils and Foundations38(4): 47–55.
Vaid YP and Eliadorani AA (1998) Instability and liquefaction of
granular soils under undrained and partially drained states.
Canadian Geotechnical Journal35(6): 1053–1062.
Wanatowski D and Chu J (2007) Static liquefaction of sand in
plane-strain. Canadian Geotechnical Journal44(3): 299–313.
Wanatowski D and Chu J (2011) Pre-failure instability behavior
of sand in strain path testing under plane-strain conditions.
Soils and Foundations51(3): 423–435.
WHAT DO YOU THINK?
To discuss this paper, please submit up to 500 words to the editor at [email protected]. Your contribution will be forwarded to the author(s) for a reply and, if considered appropriate by the editorial panel, will be published as a discussion in a future issue of the journal.
Wanatowski D and Chu J (2012) Factors affecting pre-failure
instability of sand under plane-strain conditions. Géotechnique
62(2): 121–135.
Wanatowski D, Chu J and Lo RSC (2008) Strain softening
behaviour of sand in strain path testing under plane-strain conditions. Acta Geotechnica3(2): 99–114.
Wanatowski D, Chu J and Loke WL (2010) Drained instability of
sand in plane-strain. Canadian Geotechnical Journal47(4): 400–412.
Zhao H and Zhang L (2014) Instability of saturated and
unsaturated coarse granular soils. Journal of Geotechnical and Geoenvironmental Engineering140(1): 25–35.
Zhu JH and Anderson SA (1998) Determination of shear strength
of Hawaiian residual soil subjected to rainfall-induced landslides. Géotechnique48(1): 73–82.