Between the devil and the deep blue sea: the role of the Amundsen Sea continental shelf in
1
exchanges between ocean and ice shelves
2
3
Karen J. Heywood1, Louise C. Biddle1, Lars Boehme2, Pierre Dutrieux3,4, Michael Fedak2, Adrian
4
Jenkins5, Richard W. Jones1, Jan Kaiser1, Helen Mallett1, Alberto C. Naveira Garabato6, Ian A.
5
Renfrew1, David P. Stevens1, Benjamin G.M. Webber1
6
7
1Centre for Ocean and Atmospheric Sciences, University of East Anglia, Norwich NR4 7TJ, UK
8
2 Sea Mammal Research Unit, University of St Andrews, UK
9
3 Polar Science Center, Applied Physics Laboratory, University of Washington, Seattle, US
10
4 Lamont-Doherty Earth Observatory of Columbia University, Palisades, NY 10964-8000, US
11
5
British Antarctic Survey, Cambridge, UK
12
6 Ocean and Earth Science, University of Southampton, UK
13
14
Correspondence to [email protected]
15
Submitted to special issue of Oceanography on ice-ocean interaction 20th June 2016
16
Revised 15th October 2016
17
18
ABSTRACT
19
The Amundsen Sea is a key region of Antarctica where ocean, atmosphere, sea ice and ice sheet
20
interact. For much of Antarctica, the relatively warm ocean water in the open Southern Ocean (a few
21
degrees above freezing) is unable to reach the continental shelf in large volumes under current
22
climate conditions. In the Amundsen Sea, however, warm water penetrates onto the continental shelf
23
and provides heat that can melt the underside of the floating ice shelves. Here we discuss how the
24
role of the ocean has come under increased scrutiny in recent years, because ocean heat fluxes have
25
been implicated in the thinning of the ice shelves. We present observations from the Amundsen Sea in
26
2014 and discuss their implications, highlighting aspects where our understanding is still incomplete.
27
28
BACKGROUND
29
The Antarctic Ice Sheet holds a vast reservoir of water, enough to increase global sea level by 58
30
m (Fretwell et al., 2013). This is a focus of attention because the ice sheet (predominantly in West
31
Antarctica) has been losing mass in recent decades (Shepherd et al., 2012); the mass lost by melting
32
into the sea and iceberg calving is greater than the mass added by precipitation on the Antarctic
33
continent. Under the action of gravity, the ice flows slowly away from the interior of the continent
34
often deepens towards the interior of the ice sheet. This situation means that any retreat of the
36
grounded ice sheet takes its margins into deeper water, where the ice is thicker and the discharge
37
tends to be higher, and the associated positive feedback can lead to unstable retreat (Weertman,
38
1974). The edges of the ice sheet begin to float where they meet the ocean, forming ice shelves.
39
These ice shelves regulate the flow of ice at the margins of the grounded ice sheet and can thus
40
prevent the unstable retreat. Observational evidence is growing that many ice shelves have been
41
thinning (Paolo et al, 2015), and this is widely held to be responsible for acceleration and thinning of
42
outlet glaciers and the associated retreat of their grounding lines (e.g. Park et al., 2013; Rignot et al.,
43
2014; Mouginot et al., 2014).
44
The Intergovernmental Panel on Climate Change (IPCC) Fifth assessment report chapter on sea
45
level rise (Church et al., 2013) was the first such report to be able to quantify a likely range of sea level
46
rise during the 21st century. This was made possible by recent improvements in our understanding and
47
modeling of ice sheet dynamics, ice-ocean interactions and climate dynamics. It was not however
48
possible to provide a very likely range or upper bound of global sea level rise, because of the unknown
49
risk of potential collapse of Antarctic ice shelves. There is an increasing rate of ice loss in the
50
Amundsen Sea Embayment in West Antarctica (Paolo et al., 2015). Here we focus on two vulnerable
51
ice shelves in the eastern Amundsen Sea, Pine Island and Thwaites glaciers, where ice shelf thinning
52
and glacier acceleration have been observed throughout the past four decades (Rignot et al., 2014;
53
Mouginot et al., 2014). Church et al. (2013) had “high confidence” that the retreat of Pine Island
54
Glacier (if it occurs) would lead to a sea level rise of several centimeters by 2100, but that models
55
were not yet good enough to predict when this might happen. They suggested that Thwaites Glacier
56
may be less prone to undergo ocean-driven grounding line retreat than its neighbor in the 21st
57
century, but that this remains uncertain. Modeling results (Joughin et al., 2014) suggest that unstable
58
retreat is already underway for Thwaites Glacier, but that eventual collapse is not likely to occur for
59
hundreds of years.
60
Why are the ice shelves thinning and losing mass? For some Antarctic ice shelves, such as the
61
Larsen ice shelf to the east of the Antarctic Peninsula, it is suggested that warmer surface winds are
62
the cause of the ice shelf disintegration (Doake et al., 1998; Elvidge et al., 2016). However in most
63
other locations around the continent, and especially in the Amundsen, Bellingshausen and West
64
Antarctic Peninsula sectors, the ocean has been implicated (e.g. Jacobs et al., 2011; Rignot et al.,
65
2013). If relatively warm ocean water is able to access the underside of the floating ice shelves, it can
66
provide its heat to melt the ice shelf. The principal source of ocean heat on the Amundsen Sea
67
continental shelf is Circumpolar Deep Water (CDW). This water mass, circulating around Antarctica
68
ubiquitous beneath the cold surface layer and broad thermocline that typically occupy the upper few
70
hundred meters of the water column (Schmidtko et al., 2014). The main pycnocline separating CDW
71
from surface waters typically deepens over the Antarctic continental slope to form the Antarctic Slope
72
Front, associated with westward flow around Antarctica in the slope current. The depth of the
73
pycnocline is a key control on exchange across the shelf break. The depth of the pycnocline may be
74
strongly dependent on the surface wind stress (Thoma et al., 2008; Spence et al., 2013; Jenkins et al.,
75
this issue). In the eastern Weddell Sea upstream of the vast Filchner-Ronne ice shelf system, the
76
pycnocline characteristically intersects the continental slope well below the shelf break, and the
77
Antarctic Slope Undercurrent flows eastward on the slope (Chavanne et al., 2010). In the Amundsen
78
Sea, in contrast, the pycnocline remains mostly above the level of the shelf break, especially where
79
the shelf edge is cut by troughs (Jacobs et al., 2012). As a result, almost unmodified CDW can cross
80
the shelf break (Jenkins et al., 2010), although shelf break mixing processes reduce the core
81
temperature by about 0.5 C (Jacobs et al., 2012). The undercurrent follows the shelf break and may
82
turn onto the shelf when it encounters cross-cutting troughs (Walker et al., 2013). Once on the
83
continental shelf, CDW is thought to follow the glacially-carved bathymetric troughs to the ice shelves
84
(Thoma et al., 2008; Jacobs et al., 2011, Nakayama et al., 2013).
85
Although the ocean has been implicated in the thinning and acceleration of ice shelves, it is too
86
simplistic to state that the ocean is undergoing global warming and that the ice shelf is melting like an
87
ice cube in a warm bath; the ocean dynamics have an important role to play. For example, Antarctic
88
sea ice is not undergoing the decline that is seen in the Arctic (Turner et al., 2015). Although the
89
precise combination of atmospheric, ocean and cryospheric processes responsible is still debated, the
90
observed increase in total Antarctic sea ice extent is consistent with the predictions of coupled climate
91
model experiments when perturbed with an addition of meltwater from the Antarctic ice sheet
92
(Richardson et al., 2005). Nonetheless, there is evidence that the waters of the Antarctic Circumpolar
93
Current are warming (Gille, 2008). Close to Antarctica, the historical record is sparse, but the available
94
data suggest a statistically significant warming and shoaling of the CDW core, particularly at the West
95
Antarctic Peninsula, Bellingshausen and Amundsen Sea continental slopes (Schmidtko et al., 2014);
96
nonetheless further long-term observations are required to clearly distinguish trends from decadal
97
variability. On the Antarctic continental shelf, the temperature of the water at the sea bed (often the
98
warmest location in the water column) shows a decadal warming trend in the Bellingshausen Sea and
99
a freshening in the Ross Sea (Jacobs et al., 2002; Jacobs and Giulivi, 2010; Schmidtko et al., 2014).
100
For much of Antarctica, however, there are insufficient data to be confident in any decadal trends or
101
variability.
102
Even if the ocean temperature were to remain generally the same, a greater volume of warm
103
front (perhaps by reduced diapycnal mixing occurring on the shelf, or perhaps by a more direct route
105
being taken), and/or a greater flux of water could enter the ice shelf cavity (Jacobs et al., 2011). The
106
variability in the volume flux and/or heat flux crossing the continental slope is difficult to estimate from
107
existing observations (Walker et al., 2007; Assmann et al., 2013), but the thickness of the CDW layer
108
at the shelf break has been used as a proxy (Thoma et al., 2008; Dutrieux et al., 2014). Such studies
109
have suggested the importance of the large-scale wind forcing in determining the cross-slope flow,
110
with particular emphasis on the zonal (east-west) winds at and north of the shelf break (Walker et al.,
111
2007; Thoma et al., 2008; Assmann et al., 2013; Walker et al., 2013; Spence et al., 2013). St Laurent
112
et al. (2015) put forward another alternative: that variability in the heat content on the continental shelf
113
is primarily driven not by the amount of CDW that crosses the Antarctic Slope Front but by the air-sea
114
interaction processes occurring in polynyas (open water regions surrounded by sea ice) on the
115
continental shelf.
116
Ocean-atmosphere interactions are complex in the Amundsen Sea; it has been hypothesized that
117
both zonal wind anomalies at the shelf break (Thoma et al., 2008) and large wintertime heat fluxes in
118
coastal polynyas (St. Laurent et al., 2015) can alter glacial melt rates. Zonal winds at the shelf break
119
are influenced by both the annual longitudinal cycle of the Amundsen Sea Low from the Ross Sea in
120
winter towards the Amundsen Sea in summer (Hosking et al., 2013), and larger-scale climate
121
variability associated with the El Niño - Southern Oscillation and the Southern Annular Mode (Fogt et
122
al., 2012; Steig et al., 2012; Turner et al., 2013). The Amundsen Sea has the greatest interannual
123
variability in mean sea level pressure field in the Southern Hemisphere (Connolley, 1997).
124
Atmospheric forcing is important for determining ocean conditions and dynamics, for sea ice formation
125
and melt processes, and for surface processes on the Antarctic continent determining ice mass
126
balance. Despite this, in-situ meteorological observations in the Amundsen Sea embayment remain
127
very sparse. Reanalysis products are therefore the only source of gridded, homogeneous
128
meteorological records; Jones et al. (2016) showed that while all such products contain biases,
ERA-129
Interim is the most accurate in the Amundsen Sea when compared with the sparse in situ
130
observations available.
131
iSTAR FRAMEWORK
132
The UK's Ice Sheet Stability Program (iSTAR, www.istar.ac.uk) contributes to international efforts
133
to understand better the causes and variability of melting of the Amundsen Sea ice shelves. Improved
134
understanding of these processes is a prerequisite for their incorporation into coupled climate models,
135
a key step if we are to improve our ability to predict sea level rise. iSTAR aims to investigate the
136
stability of the West Antarctic ice sheet, with a particular focus on the Amundsen Sea and Pine Island
137
Glacier, ice stream and ice shelf system. Four multi-institutional projects are funded through the
138
train, iSTAR C (Dynamic Ice) and iSTAR D (Ice Loss). Two undertook oceanographic fieldwork based
140
on a voyage of the UK’s research vessel RRS James Clark Ross in 2014 (Figure 1). Here we describe
141
some early new results coming from the two oceanographic elements of the program, iSTAR A
142
(Ocean2ice, led by the University of East Anglia, UEA) and iSTAR B (Ocean Under Ice, led by the
143
British Antarctic Survey, BAS) and provide some perspectives for future research. Ocean2ice seeks to
144
understand processes and variability of ocean heat transport towards the ice shelves in the Amundsen
145
Sea embayment, while Ocean Under Ice seeks to understand the circulation and melting beneath
146
these ice shelves.
147
The iSTAR research cruise took place in February-March 2014 (Figure 1). Over 100 CTD stations
148
were occupied together with Lowered ADCP (LADCP), measurement of tracers, and profiles of
149
turbulent microstructure. Low sea ice cover on the continental shelf (Figure 2) provided the opportunity
150
for hydrographic sections in the bathymetric troughs in the eastern Amundsen Sea. These troughs
151
provide a channel for relatively warm water offshore to reach the vulnerable Pine Island and Thwaites
152
ice shelves. We were able to repeat a quasi-meridional section crossing the shelf to the east of Burke
153
Island, occupied only once before (Jacobs et al., 1996). Our hope to re-occupy the zonal section
154
undertaken by RV Polarstern in 2010 (Nakayama et al., 2013) were thwarted by extensive sea ice in
155
the northern Amundsen Sea shelf, but we were fortunate that low sea ice cover allowed sections to be
156
undertaken across the front of Pine Island Glacier ice front (adding to a time series of such sections
157
every few years) and around the front of the pack ice around Thwaites ice shelf. The exciting data set
158
will allow investigation of processes of interaction between ocean, ice and atmosphere, for example
159
providing the first ever comprehensive surveys of turbulent mixing and of noble gases, as well as
160
advancing our understanding of the temporal and spatial variability of water masses in the region.
161
Although it was mid-summer, conditions in the Amundsen Sea were challenging. During the research
162
cruise the air temperature was frequently below -10 °C and there were several extended periods of
163
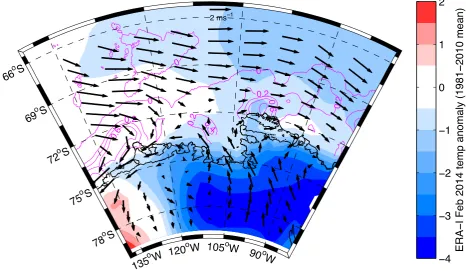
strong off-ice wind when work was being carried out in Pine Island Bay. Average temperatures close
164
to Pine Island Ice Shelf were 2 °C below the 1981-2010 February mean, and the northward
165
component of the wind was more than 1 m s-1 stronger than usual (Figure 2). In late February a
166
sustained period of northward winds combined with low temperatures saw the formation of frazil and
167
pancake ice and the northward transport of small icebergs towards the continental shelf break.
168
SEALS AS OCEANOGRAPHIC RECRUITS PROVIDE NEW PERSPECTIVES
169
The continental shelf of the Amundsen Sea is one of the most remote locations on Earth. It takes
170
a ship about a week to reach the region from any of the nearest ports, and is even beyond the reach
171
of most marine satellite communication systems. Nonetheless there have been several forays to the
172
region since the first oceanographic surveys in the 1990s (Jacobs et al., 1996); these include, for
173
described in a recent collection of papers in Deep-Sea Research II, and the US ASPIRE program
175
onboard the RV Nathaniel B. Palmer (Yager et al., 2012). The distribution of all accessible historical
176
CTD profiles on the continental shelf between 135° W and 100° W from 1994 until 2014 (1025 profiles;
177
Figure 3) reveals clusters of observations around the Getz, Dotson, Thwaites and Pine Island ice
178
shelves, and a more sparse coverage elsewhere. However this region is completely inaccessible to
179
vessels during the winter (April to October) because of extensive sea ice. To obtain temperature and
180
salinity profiles in winter, we enlisted the help of seven Southern Elephant seals (Mirounga leonine)
181
and seven Weddell seals (Leptonychotes weddellii), as part of a multidisciplinary study to characterize
182
the seals’ environment. CTD - Satellite Relay Data Loggers (tags, Boehme et al., 2009) were glued
183
onto the seals’ fur in February, and transmitted CTD profiles until October-November. The tags were
184
discarded during the seals’ next molt. In just those few months, the seals provided an order of
185
magnitude more hydrographic profiles than the entire historical data set (Figure 3): 10838 profiles with
186
either temperature or salinity or both passing quality control (8852 profiles with both temperature and
187
salinity passing quality control). Furthermore, the seal tags provided data during the period when sea
188
ice covered much of the region, between April and September. The seals obtained an unprecedented
189
snapshot of the ocean properties in one year, with data spread across much of the Amundsen Sea
190
continental shelf. The tagged seals provided relatively few profiles from the shelf break and the
191
deepest part of the Pine Island Trough. Like the ships, the seal profiles tend to cluster around the
192
edges of the Getz, Dotson, Thwaites and Pine Island ice shelves, presumably because there are
193
sources of food there in the coastal polynyas adjacent to the ice edge, possibly sustained by
micro-194
nutrients delivered by the glacier as explored during the ASPIRE program (Yager et al., 2012).
195
CIRCUMPOLAR DEEP WATER; THE ULTIMATE SOURCE OF HEAT
196
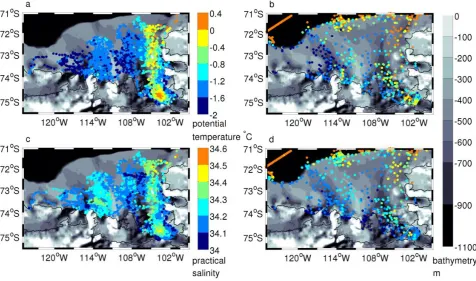
The temperature and salinity at 300 m from the seal tags and the historical CTD database (Figure
197
3) reveal the circulation of the water masses; the core water masses are most easily identified in the
198
iSTAR ship-based hydrographic section from the shelf edge to the Pine Island ice shelf (Figure 4).
199
This section retraces the CTD stations occupied in 1994 during the first scientific expedition to this
200
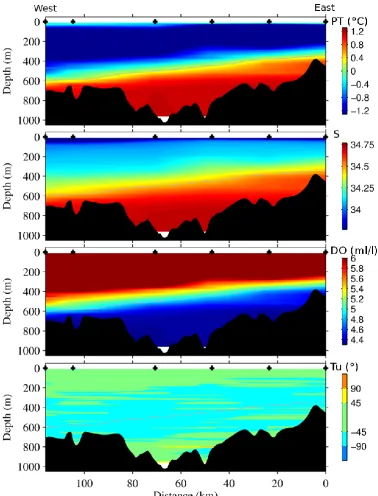
region (Jacobs et al., 1996). Offshore, the CDW is identified by its temperature maximum at a depth of
201
around 500 m. The CDW layer is relatively saline and has low dissolved oxygen concentrations
202
(Figure 4) because it has been out of contact with the atmosphere for a long time. This layer gains
203
access to the continental shelf through a series of shelf-edge depressions of depth 500-600 m. The
204
processes by which the water crosses the continental slope and associated slope current system are
205
not yet fully understood, and their variability only partially documented (Assmann et al., 2013; Wåhlin
206
et al., 2013), but are thought to include wind forcing (Thoma et al., 2008), onshore transport in bottom
207
Ekman layers (Wåhlin et al., 2012), and the topographically steered undercurrent (Walker et al., 2013).
208
determine the variability of ice shelf melting such as surface heat fluxes and polynya location (e.g.
210
Schodlok et al., 2012; Nakayama et al., 2014).
211
The properties of near-surface water masses are dominated by the seasonal processes of sea ice
212
formation and melt, and heat loss to and freshwater gain from the atmosphere. Salinification from
213
brine rejection during sea ice formation in autumn, and surface cooling, combine to create a winter
214
mixed layer of 100-200 m depth on the Amundsen Sea continental shelf. During summer, this layer
215
becomes stratified, primarily by sea ice melt at the surface, but also by solar radiation. The remnant of
216
the winter mixed layer below is known as Winter Water, and identified by its temperature minimum
217
(Figure 4). These near-surface layers exhibit high dissolved oxygen concentrations, near the values
218
expected for air-saturation at the corresponding temperature, salinity and atmospheric pressure
219
conditions.
220
The depth and pathway of the CDW is constrained by bathymetry, by the depth of the overlying
221
layers, and by the strength of the meridional geostrophic flow, which has an associated zonal tilt of the
222
isotherms and isopycnals. The quasi-meridional section from the continental shelf edge to the ice shelf
223
included stations to the east of Burke Island (about 200 km from the ice shelf; Figure 4). The core of
224
CDW is noticeably higher to the north and east of the island, and lower to the south. This may indicate
225
strong mixing at the sill south of Burke Island, or it may indicate a convergence of pathways after
226
passing both sides of the island. The map of seal tag temperature at 300 m (Figure 3) reveals warm
227
water passing on both sides of the island, but this may be temporally variable.
228
At 300 m, the warmest and most saline waters are found in the eastern channel (Figure 3) leading
229
to Pine Island and Thwaites ice shelves. Relatively warm and saline water is also found in front of the
230
Getz ice shelf. Pine Island Bay, in front of the ice shelf, hosts an anticyclonic gyre circulation
231
(Thurnherr et al., 2014), clearly identifiable in the doming of the isotherms and isohalines about 30 km
232
from the ice shelf (Figures 3 and 4). This gyre (certainly present in 2012 and 2014 ship-based surveys,
233
and visible in shipboard acoustic Doppler current profiler velocities, Figure 1) may be a variable
234
feature and its role in transporting warm water towards the ice shelf cavity remains to be explored.
235
In Figure 5 we provide quasi-meridional temperature and salinity sections from the seal-tags
236
during February to April 2014 inclusive, designed to be as comparable in location to the ship-based
237
section (Figure 4) as possible. On the outer shelf, the water mass properties are very similar and the
238
mid-thermocline isopycnal demonstrates a comparable structure. However in the region of the Pine
239
Island Bay, the doming marking the center of the gyre is located some 30 km further north (compare
240
the black and gray contours in Figure 5a). This intriguing observation suggests some temporal
241
variability of the gyre, probably caused by local wind forcing changes; this will be investigated further
242
PROCESSES ON THE CONTINENTAL SHELF
244
The pathways of water masses across the 400 km wide continental shelf from shelf break to ice
245
front (Figures 1 and 3) are complex and not well known. Nakayama et al. (2013) document the likely
246
merging of the inflows from the two easternmost bathymetric troughs (referred to as the eastern and
247
central troughs). Mixing of the CDW with the waters above likely influences the heat available for
248
melting that reaches the ice shelf front. Much of the meltwater from the ice shelf cavity is neutrally
249
buoyant at mid-depths so lies in the thermocline below the Winter Water (Dutrieux et al., 2014;
250
Nakayama et al., 2013). It is not known how the volume flux or properties of meltwater feed back into
251
the CDW volume flux and properties through mixing. Such mixing is not yet quantified, but we expect
252
greater mixing in regions of rough bathymetry, caused by breaking internal waves and near-boundary
253
turbulence.
254
In polar regions, diffusion can also play a significant role in diapycnal mixing. The Turner angle
255
(Ruddick, 1983) indicates the stability of the water column, and whether temperature or salinity is
256
providing that stability (You, 2002). Turner angles between -45° and -90° (turquoise in Figures 4d and
257
6d) represent the “diffusive” regime of double-diffusive convection (corresponding to cold, fresher
258
water overlying denser but warmer salty water). Much of the thermocline between the Winter Water
259
and the CDW is classified as being susceptible to diffusive mixing. The warm CDW is overlain by
260
colder, fresher Winter Water, so both temperature and salinity increase with depth, resulting in
261
diffusive mixing, however the mixing is driven by the temperature gradient in these regions. We do not
262
see strong evidence of a staircase structure in temperature and salinity profiles, which may suggest
263
that the circulation is too strong for such a diffusive regime to be detectable. Turner angles between
264
45° and 90° (yellow in Figures 4d and 6d) represent the “salt-finger” regime of double-diffusive mixing
265
(corresponding to warmer, salty water overlying denser but colder and fresher water). This occurs on
266
the lower boundary of the core of CDW, both as it approaches the continental slope, and on the
267
continental shelf near the sea bed, where temperature decreases with depth below the CDW core.
268
The upper few hundred meters, and many regions near the sea bed beneath the thermocline, are
269
typically characterized by Turner angles between -45° and 45° (green in Figures 4d and 6d), where
270
stable stratification is provided by both temperature and salinity gradients.
271
DELIVERING WARM CDW TO THE ICE SHELVES
272
The iSTAR campaign included deployments of the autonomous underwater vehicle Autosub
273
beneath the Pine Island ice shelf to extend the ship-based section into the cavity (Figure 4),
274
comparable with the sections published by Jenkins et al. (2010). 2014 was a fairly typical year
275
compared with historical measurements in terms of the heat content of the Pine Island Trough region
276
2000s. The thermocline was lower in 2014 than in 2009 when more relatively warm water was able to
278
access the ice shelf cavity (Jacobs et al., 2011; Dutrieux et al., 2014). The transport of CDW towards
279
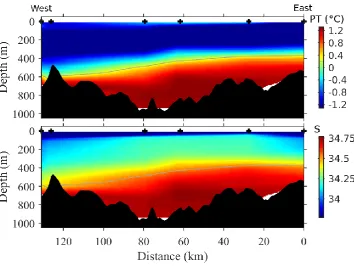
Pine Island and Thwaites ice shelves is estimated using the iSTAR ship-based quasi-zonal CTD
280
sections at the shelf edge in the central and eastern troughs (see Figure 1 for locations), as well as the
281
iSTAR ship-based quasi-zonal CTD section across Pine Island trough south of Burke Island at
282
approximately 73.8° S (Figure 6; see Figure 1 for location). The de-tided shipboard acoustic Doppler
283
current profiler currents (Figure 1) were used to reference the geostrophic shear using the portion of
284
the water column where the shear calculated from the iSTAR CTD sections matched the directly
285
observed shear. We derive a CDW flux by integrating the volume transport from the sea bed to a
286
neutral density of 28 kg m-3 assumed to denote the upper boundary of CDW (following Walker et al.,
287
2007). The heat fluxes through these sections are calculated using the temperature of the water above
288
the in-situ freezing point, following the definition of, for example, Walker et al. (2007). This quantity
289
represents the total heat flux available to melt the ice shelves and is therefore useful around the
290
Antarctic margins, but we do not account for the full heat budget of the Amundsen Sea or Pine Island
291
sector, only the portion that flows in through certain sections; we do not have land-to-land sections
292
with no net volume flux across them.
293
We calculate that a net volume flux of CDW of 270 mSv (1 Sverdrup, Sv, = 106 m3 s-1) crossed the
294
shelf break at the central trough in February 2014, but some of this may recirculate locally. This is very
295
similar to that measured by Walker et al. (2007), who calculated 234 mSv from a similar CTD section.
296
Our derived quasi-heat flux from the CDW flowing through this section is 3.3 TW, compared with 2.8
297
TW in 2003 derived in the same way (Walker et al., 2007). The volume flux and heat flux are greater in
298
2014 by a similar proportion. A net volume flux of CDW of 85 mSv crosses the shelf break at the
299
eastern trough, through which the warmest waters enter (Figure 3). Our section suggests that less
300
CDW penetrates onto the shelf here than at the central trough; however the two sections are not
301
directly comparable because they are of different zonal extent. The central trough section mostly
302
spans southward, onshore flow, whereas the eastern trough spans a narrow onshore flow in the east
303
together with a broader region of offshore flow in the west. These two flows from the eastern and
304
central troughs likely merge and the combined inflow at the shelf break from the central and eastern
305
troughs is 351 mSv. The CDW volume flux across the zonal section south of Burke Island (Figure 6) is
306
250 mSv, where the sloping isopycnals (Figure 6e) reveal the southward geostrophic flow of the deep
307
waters. Therefore 100 mSv of the CDW flux at the shelf break does not reach the section south of
308
Burke Island. Some mixing as the CDW travels across the continental shelf will necessarily lead to a
309
reduction in the volume of the densest waters. It is likely that some of this CDW enters the cavities
310
under Abbott and Cosgrove ice shelves in the eastern Amundsen Sea and is converted into lighter
311
flow under Abbott ice shelf and into the Bellingshausen Sea, although little is known about the flow
313
under this ice shelf.
314
Comparison of the ship-based zonal hydrographic section (Figure 6 a and b) with that derived
315
from the seal tag data for February to April (Figure 7) indicates a similar slope of the isotherms and
316
isohalines. However the CDW is both warmer and saltier in the sea tag data. This suggests variability
317
in the properties of the CDW approaching the Amundsen Sea ice shelves; understanding the driving
318
mechanisms behind such variability is a key part of the Ocea2ice project.
319
Circulation and meltwater transport across Pine Island Ice Front can be estimated from CTD and
320
LADCP data using the methods described by Jenkins and Jacobs (2008) and Jacobs et al. (2011).
321
The meltwater export of 40 +/- 16 km3 yr-1 is comparable with that estimated from 2012 data (Dutrieux
322
et al., 2014), showing that melt rates considerably lower than those found in the late 2000s have been
323
sustained throughout the recent cool period in Pine Island Bay. A cross-ice-front circulation of 0.48 +/-
324
0.09 Sv is comparable with all recent estimates (Dutrieux et al., 2014). Circulation of the warmest
325
waters below a depth of 800 m contributes about one fifth of the total circulation, but the net inflow
326
below that level is indistinguishable from zero. This is consistent with the waters below the level of the
327
ridge crest mapped by Jenkins et al. (2010) being confined to the outer cavity seaward of the ridge
328
and unable to interact with the ice.
329
PERSPECTIVES
330
Processes on the continental shelf and slope all around Antarctica are crucially important for
331
determining future sea level rise, for setting the properties and volume of exported dense bottom
332
water, and for regulating the carbon cycle. Yet our ability to model and predict these processes over
333
future decades is still rudimentary. Many of the state-of-the-art coupled climate models used for the
334
2013 IPCC report show biases in the temperature of water on the Antarctic continental shelf of greater
335
than 1 °C (Heuzé et al., 2013) which would lead to significant errors in any predicted melt rate of an
336
ice shelf encountering these water masses in the model. Climate models are often too coarse in
337
horizontal resolution to resolve the coastal polynyas critical to setting water mass characteristics
338
through air-sea interaction. St-Laurent et al. (2013) and Stewart and Thompson (2015) both find that a
339
resolution of about 1 km is required to accurately resolve eddies over the continental shelf, and the
340
polynya processes are likely on a similar scale. Jones et al. (2016) demonstrate that even the
341
meteorology of the continental shelf in the highly sensitive Amundsen Sea embayment is sparsely
342
observed and poorly simulated, with small-scale features such as katabatic winds not well
343
represented. This is the case in many other key regions around the continent, especially where there
344
Processes at the Antarctic continental slope are particularly challenging to observe. Moorings are
346
difficult to place precisely on a steep slope. The Rossby radius, which determines the mesoscale eddy
347
scale, is only about 1-2 km on the Antarctic continental shelves, and submesoscale processes occur
348
on an even smaller scale. Thus the Antarctic slope current is narrow and the undercurrent even more
349
so; understanding their driving forces requires extremely closely spaced moorings or hydrographic
350
profiles. Both currents vary in space and time on time scales of hours (due to internal waves and tides)
351
to years (due to forcing variability). Therefore we need to exploit the opportunities provided by new
352
technologies to make the necessary high-resolution ocean observations at the Antarctic shelf break
353
and slope. Ocean gliders, for example, can occupy repeat sections across the slope at sufficiently high
354
resolution to quantify the eddy processes shown to be key in transporting heat towards the continent
355
(Thompson et al., 2014).
356
Observations during winter are essential to understand what determines the ocean heat content
357
near the ice shelves, as well as to measure the exchanges of heat, freshwater and trace gases
358
between ocean, ice and atmosphere. In the Amundsen Sea, a strategically placed array of moorings,
359
such as that being nurtured by an international collaboration of South Korean, Swedish, UK and US
360
scientists, will begin to provide the information against which numerical models can be tested and
361
improved; such collaborations are being encouraged by the international initiative to design a
multi-362
disciplinary and cost-effective Southern Ocean Observing System (SOOS; http://www.soos.aq). The
363
Amundsen Sea shelf and slope are frequently infested with sea ice; whilst this poses a challenge to
364
ship-based scientists, marine mammals are able to shoulder the burden of monitoring the ocean
365
properties during winter. Moorings must be designed to withstand icebergs so are unable to carry
366
instruments in the upper few hundred meters; the seals can fill that crucial gap to help us to
367
understand the seasonal cycle in upper ocean stratification and mixing. Data sets provided by tagged
368
seals are now revealing the circulation of water masses on the Antarctic shelf between continental
369
slope and ice shelves (Zhang et al., 2016).
370
The polynyas on the continental shelf are likely to be a particular focus of future modeling and
371
observational efforts, for their impact on the ecology as well as their role in air-sea exchange. We
372
know very little about the processes in such polynyas during early spring, late autumn, or during
373
winter. Simultaneous observations of both ocean and atmosphere are needed. These polynyas have
374
been shown in model studies to be important in setting the heat content of waters approaching and
375
entering the ice shelf cavities (Nakayama et al., 2014; St Laurent et al., 2015). Monitoring the heat
376
fluxes at the ice shelf fronts is perhaps an even greater challenge, and was one of the topics
377
addressed at an international workshop (Keck Institute for Space Studies, 2015). Whilst the logistics
378
and environmental constraints mean that it is a great achievement to occupy a hydrographic section
379
we know that this is insufficient. We need to design an observing system that can monitor the heat flux
381
going into these ice shelf cavities on time scales of days, weeks, months and years.
382
ACKNOWLEDGEMENTS
383
This work was supported by funding from the UK Natural Environment Research Council's iSTAR
384
Program through grants NE/J005703, NE/J005649/1 and NE/J005770/1. We thank all involved with
385
RRS James Clark Ross cruise 294/295 for making these observations possible. We thank Simon
386
Moss, SMRU, for help with seal tagging and Fabien Roquet (MISU, Stockholm University) for help with
387
processing the seal tag data.
388
389
REFERENCES
390
Arndt, JE et al. 2013. The International Bathymetric Chart of the Southern Ocean (IBCSO) - digital
391
bathymetric model. doi:10.1594/PANGAEA.805734, In Supplement to: Arndt, Jan Erik; Schenke,
392
Hans Werner; Jakobsson, Martin; Nitsche, Frank-Oliver; Buys, Gwen; Goleby, Bruce; Rebesco,
393
Michele; Bohoyo, Fernando; Hong, Jong Kuk; Black, Jenny; Greku, Rudolf Kh; Udintsev, Gleb B;
394
Barrios, Felipe; Reynoso-Peralta, Walter; Taisei, Morishita; Wigley, Rochelle (2013): The
395
International Bathymetric Chart of the Southern Ocean Version 1.0 - A new bathymetric compilation
396
covering circum-Antarctic waters. Geophysical Research Letters, 40(9), 1-7, doi:10.1002/grl.50413
397
Assmann, K.M., Jenkins, A., Shoosmith, D.R., Walker, D.P., Jacobs, S.S. and Nicholls, K.W. 2013.
398
Variability of Circumpolar Deep Water transport onto the Amundsen Sea Continental shelf through
399
a shelf break trough. Journal of Geophysical Research: Oceans, 118(12), 6603-6620
400
Boehme L, Lovell P, Biuw M, Fedak M. 2009. Technical Note: Animal-borne CTD-Satellite Relay Data
401
Loggers for real-time oceanographic data collection, Ocean Science 5(2):685-695 DOI:
10.5194/os-402
5-685-2009
403
Chavanne, C. P., K. J. Heywood, K. W. Nicholls, and I. Fer. 2010. Observations of the Antarctic Slope
404
Undercurrent in the southeastern Weddell Sea, Geophysical Research Letters, 37, L13601,
405
doi:10.1029/2010GL043603.
406
Church, J.A., P.U. Clark, A. Cazenave, J.M. Gregory, S. Jevrejeva, A. Levermann, M.A. Merrifield,
407
G.A. Milne, R.S. Nerem, P.D. Nunn, A.J. Payne, W.T. Pfeffer, D. Stammer and A.S. Unnikrishnan.
408
2013. Sea Level Change. In: Climate Change 2013: The Physical Science Basis. Contribution of
409
Working Group I to the Fifth Assessment Report of the Intergovernmental Panel on Climate
410
Change [Stocker, T.F., D. Qin, G.-K. Plattner, M. Tignor, S.K. Allen, J. Boschung, A. Nauels, Y. Xia,
411
V. Bex and P.M. Midgley (eds.)]. Cambridge University Press, Cambridge, United Kingdom and
412
New York, NY, USA.
413
Connolley, W. M. 1997. Climate Dynamics Variability in annual mean circulation in southern high
414
latitudes. Climate Dynamics, 13(10), 745–756. doi:10.1007/s003820050195
415
Doake, C.S.M., Corr, H.F.J., Rott, H., Skvarca, P. and Young, N.W., 1998. Breakup and conditions for
416
stability of the northern Larsen Ice Shelf, Antarctica. Nature, 391(6669), 778-780.
417
Dutrieux, P., De Rydt, J., Jenkins, A., Holland, P.R., Ha, H.K., Lee, S.H., Steig, E.J., Ding, Q.,
418
Abrahamsen, E.P. and Schröder, M., 2014. Strong sensitivity of Pine Island ice-shelf melting to
419
climatic variability. Science, 343(6167), 174-178.
420
Elvidge, A. D., I. A. Renfrew, J. C. King, A. Orr, T. A. Lachlan-Cope, 2016: Foehn warming
421
distributions in non-linear and linear flow regimes: A focus on the Antarctic Peninsula, Quarterly
422
Journal of the Royal Meteorological Society, 142, 618-631. doi:10.1002/qj.2489
423
Fogt, R. L., Wovrosh, A. J., Langen, R. A., & Simmonds, I. 2012. The characteristic variability and
424
connection to the underlying synoptic activity of the Amundsen-Bellingshausen Seas Low. Journal
425
of Geophysical Research: Atmospheres, 117, D07111 doi:10.1029/2011JD017337
426
Fretwell, P., Pritchard, H. D., Vaughan, D. G., Bamber, J. L., Barrand, N. E., Bell, R., Bianchi, C.,
427
J., Corr, H. F. J., Damaske, D., Damm, V., Ferraccioli, F., Forsberg, R., Fujita, S., Gim, Y.,
429
Gogineni, P., Griggs, J. A., Hindmarsh, R. C. A., Holmlund, P., Holt, J. W., Jacobel, R. W., Jenkins,
430
A., Jokat, W., Jordan, T., King, E. C., Kohler, J., Krabill, W., Riger-Kusk, M., Langley, K. A.,
431
Leitchenkov, G., Leuschen, C., Luyendyk, B. P., Matsuoka, K., Mouginot, J., Nitsche, F. O., Nogi,
432
Y., Nost, O. A., Popov, S. V., Rignot, E., Rippin, D. M., Rivera, A., Roberts, J., Ross, N., Siegert, M.
433
J., Smith, A. M., Steinhage, D., Studinger, M., Sun, B., Tinto, B. K., Welch, B. C., Wilson, D.,
434
Young, D. A., Xiangbin, C., and Zirizzotti, A. 2013. Bedmap2: improved ice bed, surface and
435
thickness datasets for Antarctica, The Cryosphere, 7, 375-393, doi:10.5194/tc-7-375-2013, 2013.
436
Gille, S. T. 2008. Decadal-Scale Temperature Trends in the Southern Hemisphere Ocean, Journal of
437
Climate, 21, 4749–4765 doi:10.1175/ 2008JCLI2131.1.
438
Heuzé, C., K. J. Heywood, D. P. Stevens, and J. K. Ridley. 2013. Southern Ocean bottom water
439
characteristics in CMIP5 models, Geophysical Research Letters, 40, 1409–1414,
440
doi:10.1002/grl.50287.
441
Hosking, J. S., Orr, A., Marshall, G. J., Turner, J., & Phillips, T. 2013. The influence of the
Amundsen-442
Bellingshausen Seas Low on the climate of West Antarctica and its representation in coupled
443
climate model simulations. Journal of Climate, 26(17), 130315144221005.
doi:10.1175/JCLI-D-12-444
00813.1
445
Jacobs, S.S. and Giulivi, C.F., 2010. Large multidecadal salinity trends near the Pacific-Antarctic
446
continental margin. Journal of Climate, 23(17), 4508-4524.
447
Jacobs, S. S., H. H. Hellmer, and A. Jenkins. 1996. Antarctic Ice Sheet Melting in the Southeast
448
Pacific, Geophysical Research Letters 23 (9): 957–60.
449
Jacobs, S.S., Giulivi, C.F. and Mele, P.A., 2002. Freshening of the Ross Sea during the late 20th
450
century. Science, 297(5580), 386-389.
451
Jacobs, S. S., Jenkins, A., Giulivi, C. F., and Dutrieux, P. 2011. Stronger ocean circulation and
452
increased melting under Pine Island Glacier ice shelf, Nature Geoscience, 4, 519–523,
453
doi:10.1038/ngeo1188
454
Jacobs, S. S, H. Hellmer, C. Giulivi, F. Nitsche, B. Huber, and R. Guerrero, 2012: The Amundsen Sea
455
and the Antarctic Ice Sheet. Oceanography, 25, 154–163, doi:10.5670/oceanog.2012.90.
456
Jenkins, A., and S. Jacobs, 2008, Circulation and melting beneath George VI Ice Shelf, Antarctica,
457
Journal of Geophysical Research, 113, C04013, doi:10.1029/2007JC004449.
458
Jenkins, A., Dutrieux, P., Jacobs, S.S., McPhail, S.D., Perrett, J.R., Webb, A.T. and White, D., 2010.
459
Observations beneath Pine Island Glacier in West Antarctica and implications for its retreat. Nature
460
Geoscience, 3(7), 468-472.
461
Jones, R. W., Renfrew, I. A., Orr, A., Webber, B. G. M., Holland, D. M., & Lazzara, M. A. 2016.
462
Evaluation of four global reanalysis products using in situ observations in the Amundsen Sea
463
Embayment, Antarctica. Journal of Geophysical Research: Atmospheres.
464
doi:10.1002/2015JD024680
465
Joughin, I., B. E. Smith, and B. Medley. 2014. Marine ice sheet collapse potentially under way for the
466
Thwaites Glacier Basin, West Antarctica, Science, 334, 735–738, doi:10.1126/science.1249055.
467
Keck Institute for Space Studies (2015) The Sleeping Giant: Measuring Ocean-Ice Interactions in
468
Antarctica. Andrew Thompson, Josh Willis, Anthony Payne, study co-leads. Keck Institute for
469
Space Studies, California Institute of Technology, Pasadena CA.
470
http://kiss.caltech.edu/new_website/programs.html#ocean_ice
471
Mouginot, J., Rignot, E. and Scheuchl, B., 2014. Sustained increase in ice discharge from the
472
Amundsen Sea Embayment, West Antarctica, from 1973 to 2013. Geophysical Research Letters,
473
41(5), 1576-1584.
474
Nakayama, Y., M. Schroder, and H. H. Hellmer. 2013. From circumpolar deep water to the glacial
475
meltwater plume on the eastern Amundsen Shelf, Deep Sea Research Part I, 77, 50–62,
476
doi:10.1016/j.dsr.2013.04.001.
477
Nakayama, Y., R. Timmermann, M. Schröder, and H. Hellmer (2014), On the difficulty of modeling
478
Circumpolar Deep Water intrusions onto the Amundsen Sea continental shelf, Ocean Modelling,
479
Paolo, F.S., Fricker, H.A. and Padman, L. 2015. Volume loss from Antarctic ice shelves is
481
accelerating. Science, 348(6232), 327-331.
482
Park, J.W., Gourmelen, N., Shepherd, A., Kim, S.W., Vaughan, D.G. and Wingham, D.J., 2013.
483
Sustained retreat of the Pine Island Glacier. Geophysical Research Letters, 40(10), 2137-2142.
484
Richardson, G., M.R. Wadley, K.J. Heywood, D.P. Stevens and H.T. Banks. 2005. Short-term climate
485
response to a freshwater pulse in the Southern Ocean, Geophysical Research Letters, 32, L03702,
486
doi: 10.1029/2004GL021586.
487
Rignot, E., S. S. Jacobs, J. Mouginot, B. Scheuchl. 2013. Ice-shelf melting around Antarctica. Science
488
341, 266–270 doi:10.1126/science.1235798 pmid:23765278
489
Rignot, E., J. Mouginot, M. Morlighem, H. Seroussi, and B. Scheuchl. 2014. Widespread, rapid
490
grounding line retreat of Pine Island, Thwaites, Smith, and Kohler glaciers, West Antarctica, from
491
1992 to 2011, Geophysical Research Letters, 41, 3502–3509, doi:10.1002/2014GL060140.
492
Ruddick, B.R. (1983), A practical indicator of the stability of the water column to double-diffusive
493
activity. Deep Sea Research, 30, 1105–1107.
494
Schmidtko, S., K.J. Heywood, A.F. Thompson, and S. Aoki. 2014. Multidecadal warming of Antarctic
495
waters, Science, 346 (6214), 1227-1231.
496
Shepherd, A., Ivins, E.R., Geruo, A., Barletta, V.R., Bentley, M.J., Bettadpur, S., Briggs, K.H.,
497
Bromwich, D.H., Forsberg, R., Galin, N. and Horwath, M., 2012. A reconciled estimate of ice-sheet
498
mass balance. Science, 338(6111), 1183-1189.
499
Spence, P., S. M. Griffies, M. H. England, A. McC. Hogg, O. A. Saenko and N. C. Jouradin. 2014.
500
Rapid subsurface warming and circulation changes of Antarctic coastal waters by poleward shifting
501
winds. Geophysical Research Letters, 41, 4601-4610.
502
Steig, E.J., Ding, Q., Battisti, D.S. and Jenkins, A., 2012. Tropical forcing of Circumpolar Deep Water
503
inflow and outlet glacier thinning in the Amundsen Sea Embayment, West Antarctica. Annals of
504
Glaciology, 53(60), 19-28.
505
Stewart, A. L. and A. F. Thompson, 2015. Eddy-mediated transport of warm Circumpolar Deep Water
506
across the Antarctic shelf break. Geophysical Research Letters, 42, 432-440.
507
St-Laurent, P., J. M. Klinck and M. S. Dinniman, 2013. On the role of coastal troughs in the circulation
508
of warm circumpolar deep water on Antarctic shelves. Journal of Physical Oceanography, 43,
51-509
64.
510
St‐ Laurent, P., Klinck, J. M., & Dinniman, M. S. 2015. Impact of local winter cooling on the melt of
511
Pine Island Glacier, Antarctica. Journal of Geophysical Research: Oceans, 120(10), 6718–6732.
512
doi:10.1002/2015JC010709
513
Thoma, M., Jenkins, A., Holland, D., & Jacobs, S. 2008. Modelling Circumpolar Deep Water intrusions
514
on the Amundsen Sea continental shelf, Antarctica. Geophysical Research Letters, 35(18), L18602.
515
doi:10.1029/2008GL034939
516
Thompson, A.F., K.J. Heywood, S, Schmidtko and A.L. Stewart. 2014. Eddy transport as a key
517
component of the Antarctic overturning circulation, Nature Geoscience, 7, 879-884,
518
doi:10.1038/ngeo2289.
519
Thurnherr, A. M., S. S. Jacobs, P. Dutrieux, and C. F. Giulivi. 2014. Export and circulation of ice cavity
520
water in Pine Island Bay, West Antarctica, Journal of Geophysical Research: Oceans, 119, 1754–
521
1764, doi:10.1002/ 2013JC009307.
522
Turner, J., Phillips, T., Hosking, J. S., Marshall, G. J., & Orr, A. 2013. The Amundsen Sea low.
523
International Journal of Climatology, 33(7), 1818–1829. doi:10.1002/joc.3558
524
Turner, J., J.S. Hosking, T.J. Bracegirdle, G.J. Marshall, T. Phillips. 2015. Recent changes in Antarctic
525
sea ice. Philosophical Transactions of the Royal Society of London, DOI: 10.1098/rsta.2014.0163
526
Wåhlin, A. K., R. D. Muench, L. Arneborg, G. Bjork, H. K. Ha, S. H. Lee, H. Alsen. 2012. Some
527
implications of Ekman layer dynamics for cross-shelf exchange in the Amundsen Sea. Journal of
528
Physical Oceanography, 42, 1461–1474.
529
Wåhlin, A. K., O. Kalén, L. Arneborg, G. Björk, G. K. Carvajal, H. K. Ha, T. W. Kim, S. H. Lee, J. H.
530
Lee, and C. Stranne. 2013. Variability of warm deep water inflow in a submarine trough on the
531
Amundsen Sea shelf, Journal of Physical Oceanography, 43, 2054–2070, doi:
10.1175/JPO-D-12-532
Walker, D. P., M. A. Brandon, A. Jenkins, J. T. Allen, J. A. Dowdeswell, and J. Evans. 2007. Oceanic
534
heat transport onto the Amundsen Sea shelf through a submarine glacial trough, Geophysical
535
Research Letters, 34, L02602, doi:10.1029/2006GL028154.
536
Walker, D. P., A. Jenkins, K. M. Assmann, D. R. Shoosmith, and M. A. Brandon. 2013. Oceanographic
537
observations at the shelf break of the Amundsen Sea, Antarctica, Journal of Geophysical
538
Research: Oceans, 118, 2906–2918, doi:10.1002/jgrc.20212.
539
Weertman, J., 1974. Stability of the junction of an ice sheet and an ice shelf. Journal of Glaciology,13,
540
3-11.
541
Yager, P.L., R.M. Sherrell, S.E. Stammerjohn, A.-C. Alderkamp, O. Schofield, E.P. Abrahamsen, K.R.
542
Arrigo, S. Bertilsson, D.L. Garay, R. Guerrero, K.E. Lowry, P.-O. Moksnes, K. Ndungu, A.F. Post,
543
E. Randall-Goodwin, L. Riemann, S. Severmann, S. Thatje, G.L. van Dijken, and S. Wilson. 2012.
544
ASPIRE: The Amundsen Sea Polynya International Research Expedition. Oceanography 25(3):40–
545
53, doi: 10.5670/oceanog.2012.73.
546
You, Y. 2002. A global ocean climatological atlas of the Turner angle: implications for double-diffusion
547
and water-mass structure, Deep Sea Research I, 49, 2075–2093.
548
Zhang, X., Thompson, A. F., Flexas, M. M., Roquet, F. and Bornemann, H. 2016. Circulation and
549
meltwater distribution in the Bellingshausen Sea: from shelf break to coast. Geophysical Research
550
Figure 1. Map of the eastern Amundsen Sea with track of the RRS James Clark Ross in
February-March 2014 (red line), the 105 iSTAR CTD stations (green dots), shipboard acoustic Doppler
current profiler currents (black arrows, average current over the upper 40 m). Bathymetry is shown
in color shading. Ice information (gray shading) was provided by a MODIS satellite (TERRA) image
on January 27, 2014. Blue dashed oval denotes Pine Island Bay (PIB) and Red dashed curve
denotes the axis of Pine Island Trough (PIT). Acronyms for ice shelves are Pine Island (PIIS),
Figure 2. Near-surface atmospheric temperature anomaly (shading), 10 meter wind
vector anomalies and sea ice concentration (magenta contours) for February 2014, based on
ERA-Interim reanalyses and the OSTIA sea ice analysis (1/20th degree). The anomalies are from the
Figure 3. Measurements at 300 m of potential temperature (a, b) and practical salinity (c, d) from
seal-borne CTD tags (a, c) and from historical CTD and Argo float data between 1994 and 2014 (b,
Figure 4. Quasi-meridional hydrographic section from the iSTAR ship-based survey in 2014 from
the open ocean to the Pine Island Glacier (PIG). (a) Potential temperature referenced to the sea
surface (b) Practical salinity (c) Dissolved oxygen concentration (ml/l) (d) Turner angle shaded,
with mid thermocline isopycnal superimposed. Contours are interpolated from 2014 ship-based
casts (black crosses) in the open ocean, and from Autosub3 observations underneath the Pine
Figure 5. As Figure 4 but derived from seal-tag temperature and salinity profiles during February to
April 2014. The data beneath Pine Island Glacier are the same as in Figure 4. The gray contour is
the mid-thermoocline isopycnal from the ship-based data as shown in Figure 4, to enable
Figure 6. Zonal cross section from the iSTAR ship-based survey in 2014 across the Pine Island
trough just south of Burke Island. (a) Potential temperature referenced to the sea surface (b)
Practical salinity (c) Dissolved oxygen concentration (ml/l) (d) Turner angle shaded, with
Figure 7. As Figure 6 but derived from seal-tag temperature and salinity profiles during
February-April 2014. The gray contour is the mid-thermoocline isopycnal from the ship-based data as shown