Optimization of surface measurement
for metal additive manufacturing
using coherence scanning
interferometry
Carlos Gomez
Rong Su
Adam Thompson
Jack DiSciacca
Simon Lawes
Richard Leach
Optimization of surface measurement for metal additive
manufacturing using coherence scanning interferometry
Carlos Gomez,aRong Su,a,*Adam Thompson,aJack DiSciacca,b Simon Lawes,aand Richard Leacha
aUniversity of Nottingham, Manufacturing Metrology Team, Faculty of Engineering, University Park, Nottingham, United Kingdom bZygo Corporation, Middlefield, Connecticut, United States
Abstract. Surface topography measurement for metal additive manufacturing (AM) is a challenging task for contact and noncontact methods. We present an experimental investigation of the use of coherence scanning interferometry (CSI) for measuring AM surfaces. Our approach takes advantage of recent technical enhance-ments in CSI, including high dynamic range for light level and adjustable data acquisition rates for noise reduction. The investigation covers several typical metal AM surfaces made from different materials and AM processes. Recommendations for measurement optimization balance three aspects: data coverage, measure-ment area, and measuremeasure-ment time. This study also presents insight into areas of interest for future rigorous examination, such as measuring noise and further development of guidelines for measuring metal AM surfaces. ©The Authors. Published by SPIE under a Creative Commons Attribution 3.0 Unported License. Distribution or reproduction of this work in whole or in part requires full attribution of the original publication, including its DOI.[DOI:10.1117/1.OE.56.11.111714]
Keywords: coherence scanning interferometry; metal additive manufacturing; surface topography; metrology; roughness.
Paper 170516SS received Apr. 7, 2017; accepted for publication Jul. 10, 2017; published online Jul. 25, 2017.
1 Introduction
Additive manufacturing (AM) techniques provide additional options to industry and significant advantages for specific applications, relative to conventional manufacturing proc-esses. This is mostly because AM allows the creation of com-plex geometries and internal features that cannot be produced using subtractive methods due to their inherent tool path restrictions.1 Standard high-performance engineering and biomedical materials, which include titanium and aluminium alloys, are suitable for AM production.2
Among metal AM processes, powder bed fusion (PBF) has been the process with the greatest economic impact and is the subject of much research.3The two most common PBF processes are laser PBF (LPBF) and electron beam PBF (EBPBF). LPBF, also referred to as selective laser melting, is a process by which a laser is rastered over the surface of a bed of fine powder in an inert gas environment, causing selected areas to melt and fuse. By laying and fusing succes-sive layers (typically between 10 and 80μmin thickness) complex three-dimensional parts can be formed. EBPBF is based on the same principles as LPBF, but the source is an electron beam rather than a laser and the chamber is under vacuum. For EBPBF, each layer is sintered by a defocused beam to prevent smoke and to achieve near-fully dense parts.1,2LPBF and EBPBF are the processes used to manu-facture the samples used for this study.
A current limitation of these metal AM techniques is the poor quality of dimensional tolerance, surface texture, and surface integrity, compared with subtractively manufactured components,1–3caused in part by the thermal distortions of a highly energetic process and in part by the irregularity of partially melted particles that adhere to the part surface.4,5 PBF has proven to be a complex and difficult process to
control,2but it has been observed that key process conditions may be identifiable from the specific surface features that they produce.1 As such, there is a clear drive to achieve fast and reliable topographic measurement of metal AM sur-faces. Both LPBF and EBPBF surfaces present significant challenges for any measurement technique: high feature den-sity, large spatial frequency bandwidth, high surface slopes, varying surface texture and reflectivity, frequent discontinu-ities, and re-entrant features. A recent review of surface texture measurement methods for metal AM found that both contact and noncontact measurement methods require careful selection of measurement conditions to minimize a number of common error sources.4
A number of technologies have recently gained traction as methods of areal topography measurement, most notably using optical techniques.6 Metrology instruments based on optical imaging are significantly faster than stylus measure-ments that require mechanical raster scanning to cover a sur-face area. While other technologies exist, optical methods currently gaining industrial acceptance include confocal microscopy,7,8coherence scanning interferometry (CSI),9–11 and focus variation microscopy.12,13 Height map data acquired using one of these systems can be used to generate areal surface texture parameters (e.g,. Sa, Sq)14,15 that are considered to be a more complete description of surface structure than the analogous line profile parameters (e.g., Ra, Rq).16,17
CSI is a noncontact measurement method that uses a broadband light source and interference to measure surface topography and object geometry (see Ref.10for a detailed description of CSI). CSI systems are characterized by sub-nanometre noise at data rates of more than a million surface height points per second.10However, as a result of the limited numerical aperture (NA) of the imaging system, conven-tional CSI systems can be limited by poor signal-to-noise ratios (SNR) when measuring high-slope angle surface fea-tures and by multiply reflective feafea-tures common to rough
textures,4 resulting in an inability to reliably determine surface heights.
The need for high-slope measurement with a conventional CSI instrument often involves using a high magnification objective,18 not because of the need for magnification but because these objectives usually have high NA. The highest NA objectives in common use have maximum acceptance angles of∼45 deg. Reaching and even surpassing the NA limit requires a significant enhancement of the sensitivity of the instrument.10
Recent innovations in CSI technology have increased the baseline sensitivity of a measurement. This improved sensi-tivity increases the capability of CSI instruments to measure surface features with high slopes or low reflectance,19 mak-ing CSI a potentially valuable tool for process development and quality control of metal AM parts. In 2010, a good practice guide for CSI measurement of rough surfaces was published,20but the addition of new techniques further expands the range of measurement parameters beyond those outlined in this guide.
In this paper, we report an empirical sensitivity analysis of a state-of-the-art CSI system for several metal AM samples made from different materials and possessing large variations in surface features and roughnesses. The goals of this study are to demonstrate the feasibility of using CSI for measuring metal AM surfaces and to evaluate the effectiveness of rel-evant and advanced CSI measurement functions and settings. The fundamental principles of these functions are described in Sec.2. The details of the CSI system and the AM samples, as well as the methodology of the experimental design, are given in Sec. 3. The results are shown and discussed in Sec.4. Finally, we provide recommendations for optimiza-tion of future measurements on metal AM surfaces using CSI in terms of data coverage, measurement time, and area.
2 Advanced Functions in Coherence Scanning Interferometry
With recent advances, CSI now offers improved SNR and measurement accuracy for rough surfaces.21,22 The major improvements include the development of sophisticated fringe analysis methods and the possibility of performing a measurement with high dynamic range (HDR) lighting levels and control of the data acquisition bandwidth. The effects of these measurement settings, as well as the effect of spectral filtering of the broadband source, are investigated.
2.1 Topography Reconstruction Method
In CSI, surface topography is derived from the interference fringes that are observed as the objective is scanned in the direction of surface heights. The CSI signal for each pixel appears qualitatively as interference fringes modulated by a coherence envelope corresponding to the spectrally broad-band, extended illumination. The position of the envelope function provides a first estimate of height and a determina-tion of the integer fringe order, whereas the fringe phase information refines this estimate.20 Various methods have been developed for reconstructing surface topography from fringes, such as the frequency domain analysis (FDA),10envelope detection,23and the correlogram correla-tion method.24In practice, it is not always possible to per-form the second step of evaluating fringe phase, resulting
in a loss of precision as the price for greater tolerance of surface texture.25
When measuring rough surfaces at scales less than the lateral optical resolution of the microscope objective, the phase of the fringe data may not correlate well with the sur-face profile and random phase jumps may be observed in the fringe data.20For this reason, the potential for additional precision in the axial direction provided by phase measure-ment may not be exploited in the measuremeasure-ment of rough surfaces. In this case, fringe analysis methods based on the coherence envelope, e.g., the centroid or peak position, may provide a similar accuracy and higher robustness.
2.2 Filtering of the Source Spectrum
Typically, CSI instruments use a broadband source, e.g., a light-emitting diode, with a bandwidth of between 100 and 150 nm corresponding to a coherence length of∼3μm, which is suitable for acquiring data from most surfaces. However, rough surfaces may cause a CSI instrument to be prone to data dropout, as the signal strength becomes low if the roughness within the imaging area of a single pixel is larger than the coherence length.20,26 As the bandwidth of the source spectrum is inversely proportional to the coherence length, by narrowing down the bandwidth, the lost data due to inadequate signal strength may be captured as the coherence length is increased. The bandwidth of the source spectrum can be adjusted either through the use of bandwidth narrowing filters, which can be introduced into the optical path, or the use of multiple sources of different bandwidths.20However, this technique will also broaden the coherence envelope, and, consequently, the measurement uncertainty will increase.20
2.3 Signal Oversampling
A conventional CSI measurement may lose data coverage for the surface regions featuring high slopes and low reflectivity. The missing data may be detectable if the measurement is sufficiently sensitive. One technique for enhancing the sen-sitivity is sampling at smaller phase increments by increasing the number of camera acquisitions over each interference fringe. This method is sometimes referred to as signal oversampling.10,19
The signal oversampling leads to a dynamic noise reduc-tion. In principle, the noise level is inversely proportional to the square root of the data acquisition time. Increasing the signal oversampling factor, i.e., increasing the number of camera acquisitions over each fringe, improves the SNR and has been recently included by some commercial CSI systems, aiming to extract very weak signals from challenging surfaces,10,21such as those found in metal AM parts, which often feature a large roughness or steep slopes.
2.4 High Dynamic Range Lighting Levels
When performing conventional CSI measurements, the light level of the source is adjusted to avoid sensor saturation and hence is driven by the highest reflectance region at the inves-tigated surface. This strategy may have a negative impact over the measurement of regions with low reflectance fea-tures and/or high slopes, which already are prone to data dropout due to the low signal strength.
or exposure times, and a composite image is formed from the image data with the highest SNR, commonly gauged by the contrast that each pixel has to its neighbors.19 The HDR function optimizes the signal strength for a surface with a large variation in reflectance and/or slope, such that the number of missing data points and the measurement uncer-tainty may be reduced. The total measurement time is also increased by the number of light levels that have been used.
3 Method
3.1 Instrument
We used a ZYGO NewView™8300 CSI system27for this work. The instrument is located in a facility with a controlled temperature of ð201Þ°C, isolated from noise and dust. Four different objective lenses, with magnifications of 1.4×,285.5×,20×, and50×, were investigated and combined with 0.5× and 1× zoom lenses. The specifications of the objective lenses are shown in Table1.
A lens with a lower magnification provides a larger field of view (FOV) but a lower lateral resolution.30 Usually a large FOV is desired when measuring AM parts because the surface areas are often large and rough, and form infor-mation can be obtained without using stitching of many single measurements. Consequently, the measurement takes less time if using a lens with a large FOV for the same surface since fewer individual measurements are required. A lens that offers a small FOV but a high NA may become very useful when high-resolution local details of the surface topography are desired or when the surface contains a large number of high-slope areas.
In the NewView system, the source spectrum can be con-trolled by manually changing the filter in the instrument between a neutral density (attenuating) filter and a 40-nm bandpass filter. The number of camera acquisitions over each fringe can be controlled using the “oversampling” function in the software, where an integer multiple of the unit camera acquisition number (referred to as “signal
oversampling factor”in this paper) can be selected. A higher SNR, as well as a longer measurement time, is expected and is proportional to the selected integer number. By enabling the HDR function, two or three different lighting levels may be used to optimize the measurement.
3.2 Samples
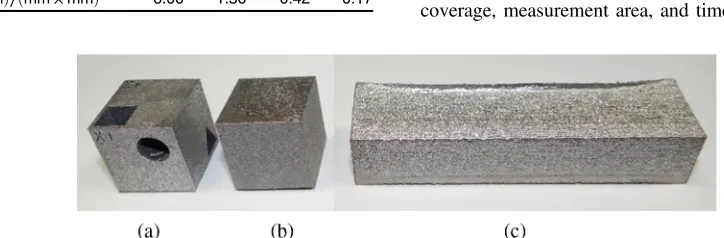
Ti-6Al-4V exhibits good strength-to-weight ratios, high resistance to fatigue and corrosion, and high-temperature performance, leading to many aerospace applications.31 Ti-6Al-4V is also biocompatible, making it an ideal candidate for biomedical applications.32 Al-Si-10Mg also has good strength, corrosion resistance, low density, and high-thermal conductivity compared with other alloys and is often found in aerospace and automotive components, as well as in func-tional prototypes.33For these reasons, both materials were selected to build three customized artefacts to be used as samples for this study, from the LPBF and EBPBF metal AM processes described in Sec.1. The first and second arte-facts consist of 20 mm Al-Si-10Mg and Ti-6Al-4V LPBF cubes, shown in Figs.1(a)and 1(b), respectively. The third sample is a20 mm×15 mm×75 mm Ti-6Al-4V EBPBF rectangular prism, shown in Fig.1(c).
3.3 Experimental Design
The experimental work conducted through this study is designed to provide evidence as to whether CSI is suitable for measuring metal AM surfaces, to demonstrate the effects of implementing the selected advanced functions and set-tings of a modern CSI system for measuring metal AM surfaces, and to provide good practice guidelines for using CSI to measure metal AM surfaces.
Experiments were performed using metal AM samples with reasonably large variations in materials and surface topography features, and measurement parameters were chosen to reveal the most important and interesting aspects of the performance of a state-of-the-art CSI system. Further investigations could have been performed using additional samples and measurement parameters with diminishing returns, but the authors have limited experiments to minimize redundancy and to maintain concision. Experiments include (1) five common metal AM surfaces that cover a large range of surface roughness, slope distribution, and characteristic topography and (2) a series of measurements performed using a combination of four objective lenses and two optical zoom settings, two spectral filters, five signal oversampling settings, and two HDR lighting levels. For each surface, the optimized measurements are suggested in terms of data coverage, measurement area, and time.
Table 1 Optical parameters for different objectives.29
Magnification 1.4× 5.5× 20× 50×
NA 0.04 0.15 0.40 0.55
Optical resolution/μm 7.13 1.90 0.71 0.52
FOVð0.5×zoomÞ∕ðmm×mmÞ 12.09 3.02 0.84 0.34
FOVð1×zoomÞ∕ðmm×mmÞ 6.00 1.50 0.42 0.17
[image:4.630.116.478.604.723.2]Data coverage is used as an indicator that shows how many data points are accepted in a measurement. In this paper, data coverage is calculated as the ratio between the number of accepted data points and the number of total pixels in the camera (a1024×1024 array). In general, the acceptance of a data points depends on the SNR. The latter can be evaluated for an individual pixel, for example, by cal-culating the ratio between the signal strength and the noise level. For this study, missing data has not been filled, just omitted. The fringe analysis method based on the coherence envelope (obtained using the FDA method) is used in this study because it is more robust when the SNR is low due to high roughness of the surface (as discussed in Sec. 2.1); thus, the data coverage can be optimized.
4 Results
4.1 Areal Surface Texture Measurements
The surfaces were evaluated using the ISO 25178-2 areal sur-face texture parameters Sq and Sdq.14,34The Sq parameter is a height parameter calculated from the root mean square
(RMS) of the ordinate values within a defined area, while the Sdq parameter is a hybrid parameter calculated from the RMS of the surface gradient within a defined area. These parameters were selected to provide sufficient insight into the topography of the investigated surfaces, regarding not only height but also gradient.
It has been observed that limited data coverage biases these parameters, having a significant impact on Sdq, while Sq is less affected. This results from Sdq accounting for the slope information, which may be challenging to measure when in the presence of high-slope angle surface features that meet or surpass the NA limit of the imaging system of a CSI. Therefore, Sdq and Sq have been always calculated from the best possible measurement, with data coverage above 99%.
The values of the parameters shown in Table2were taken using a5.5×objective lens at a 1× zoom. An S-filter with a nesting index of5μmand an L-filter with a nesting index of 1000μm were applied.35 Filtering of the surface was performed to bandwidth match36data while removing only high-frequency noise and long-scale waviness/form, with the intention of maximizing the examined measurement bandwidth.
[image:5.630.64.303.74.193.2]Absolute accuracies of the surface topography measure-ments are somewhat complex to evaluate.37–39Evaluations of measurement noise (which is surface-tilt dependent40) and topography repeatability for measuring very rough surfaces are also complex, and relevant information is rare in the lit-erature. Therefore, the evaluation of noise is out of the scope of this paper, but it will be addressed in a subsequent paper. With the complex surfaces used in this paper, the variations of the surface parameters across the surface have been con-sidered by measuring ten different areas across the investi-gated surface and then calculating the standard deviations of Sq and Sdq. The standard deviations are listed in Table2. The measured topographies of the corresponding sample surfaces are shown in Fig.2, where the topography of S2 Table 2 Results of the areal surface texture parameters.
Surfaces Sq (μm) Sdq
S1 LPBF Al-Si-10Mg cube, top surface 181 0.60.1
S2 LPBF Al-Si-10Mg cube, side surface 192 0.90.1
S3 LPBF Ti-6Al-4V cube, top surface 212 1.00.1
S4 EBPBF Ti-6Al-4V rectangular prism,
top surface 331 1
.60.2
S5a LPBF Ti-6Al-4V cube, side surface 151 121 aS-filter with a nesting index of1μm and an L-filter with a nesting
index of100μm.
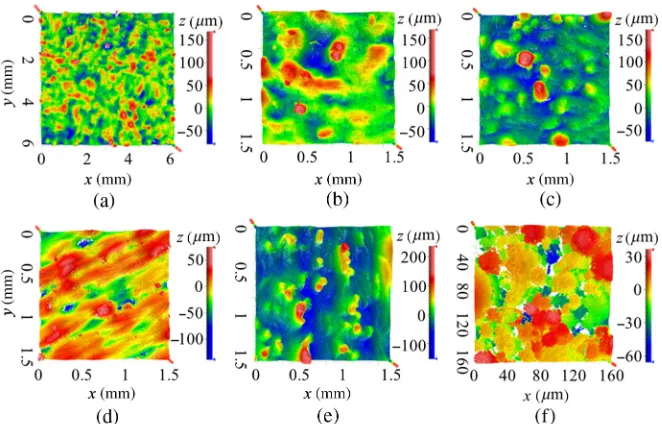
Fig. 2 CSI measurements of metal AM surfaces: (a) and (b) LPBF Al-Si-10Mg cube top surfaces, (c) LPBF Al-Si-10Mg cube side surface, (d) LPBF Ti-6Al-4V cube top surface, (e) EBPBF Ti-6Al-4V rec-tangular prism top surface, and (f) LPBF Ti-6Al-4V cube side surface. The1.4×objective lens (1×zoom) was used for (a), the5.5×objective lens (1×zoom) was used for (b)–(e), and the50×objective lens (1×zoom) was used for (f).
[image:5.630.150.481.485.697.2]obtained by the1.4×objective lens is also included to show the advantage of wide-field topography measurement [see Fig. 2(a)].
4.2 Effects of Measurement Functions and Settings
on Data Coverage
4.2.1 Effects of spectral filtering
The surfaces S1 to S4 are measured using the5.5×objective lens (1× zoom) and different source spectrum filters. The
filters used here are neutral density filters that provide band-widths of∼100and 40 nm, respectively. The data coverage of each dataset is plotted against the corresponding Sq and Sdq parameters in Fig.3. The result shows that the data cov-erage values inversely correlate with these surface parame-ters, i.e., data coverage decreases when surfaces are rougher. In addition, it is also observed that data coverage is improved using the source spectrum with a relatively narrow bandwidth (see discussions in Sec. 2.2), and the degree of improvement correlates with the roughness and slope Fig. 3Effects of spectral filtering on data coverage. The5.5×objective lens (1×zoom) was used.
The data coverage is plotted against (a) Sq and (b) Sdq.
[image:6.630.113.513.62.224.2] [image:6.630.114.515.390.687.2]parameters, i.e., the improvement is more pronounced for a surface with large Sq and Sdq values. The result agrees with the theory discussed in Sec. 2.2.
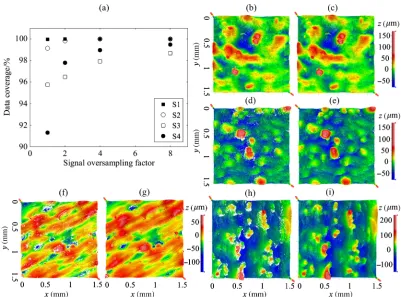
4.2.2 Effects of signal oversampling
Increasing the signal oversampling factor improves the SNR and has been shown to be useful in expanding data coverage as the latter is directly related to the SNR of each data point (see Sec.3.3for a description of data coverage). As shown in Fig. 4, this effect is more evident for surfaces with larger
values of Sq and Sdq. Nevertheless, using a substantial signal oversampling factor will increase the total measurement time by the same factor.
For rougher surfaces, such as the EBPBF Ti-6Al-4V rec-tangular prism top surface (S4), significant improvements were achieved, as shown in Figs.4(e)and4(i). Regions pre-senting steep slopes, peaks, and pits that previously caused the instrument to gather scarce data were almost fully covered using8× signal oversampling.
The LPBF Ti-6Al-4V cube side surface (S5) features multilevel hills and dales, presumably formed by loose
Fig. 5Effects of signal oversampling on data coverage for EBPBF Ti-6Al-4V rectangular prism top sur-face (S4) and Ti-6Al-4V LPBF side sursur-face (S5). (a) The5.5×objective lenses with 0.5 and1×zoom were used and (b) the20×and50×objective lenses (1×zoom) were used. The 40-nm bandwidth spectrum was used.
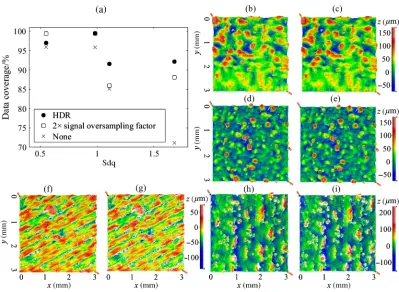
Fig. 6 Comparison of performance between HDR (two light levels) and signal oversampling (2×). (a) The data coverage is plotted against Sdq. The result of the original measurement without using any of the advanced functions is shown as the crosses; (b), (d), (f), and (h) measured topography maps of S1, S2, S3, and S4 using HDR, respectively; (c), (e), (g), and (i) measured topography maps of S1, S2, S3, and S4 using2×signal oversampling, respectively. The 5.5× objective lens (0.5×zoom) and the 40-nm bandwidth spectrum were used.
[image:7.630.157.476.209.338.2] [image:7.630.115.514.399.691.2]powder and poorly melted particles during the manufactur-ing process, creatmanufactur-ing a significant measurement challenge. Despite these features, reasonably good measurements (in terms of data coverage) can be achieved using objective lenses with higher system NAs in addition to the signal oversampling function (see Fig.5).
4.2.3 Effects of HDR of lighting levels
Enabling the HDR function for lighting levels may enhance data coverage, as shown in Fig.6. Measurement time will be doubled if two levels of lighting are used; thereby, it makes sense to also compare the results with those obtained using 2×signal oversampling. For rough surfaces featuring a large number of high slopes and relatively dark regions, the HDR function generated better results than those obtained using the signal oversampling function, given that the total meas-urement time is equal (twice the time of a single scan). In the case of smoother surfaces, using 2× signal oversampling provided similar or slightly better data coverage compared with HDR. It is clearly shown that both of these advanced functions provide improved measurements, particularly in the case of very rough surfaces.
4.3 Recommendations for the Optimization of
the Measurement
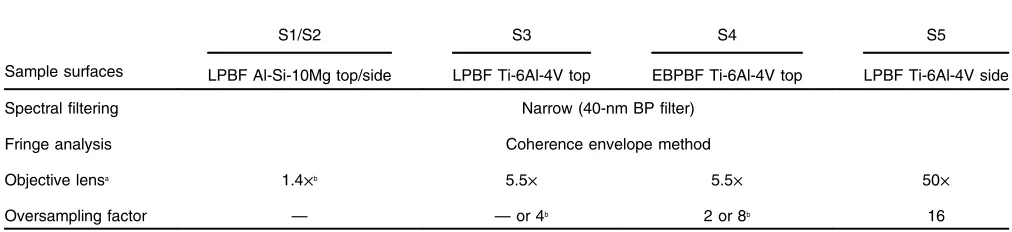
Results presented in the previous section show that progres-sively increasing the signal oversampling factor, using HDR of lighting and a narrow bandwidth source spectrum (after properly adjusting the most basic settings of a CSI instru-ment, e.g., tilt and scan length), will improve the SNR and, therefore, increase data coverage without sacrificing measurement area due to the usage of a high NA lens; how-ever, the measurement time may be compromised. In this section, recommendations for optimizing the CSI measure-ments for metal AM surfaces, in terms of measurement time and area within acceptable levels of data coverage, are pro-vided. Recommendations are given in Table3by considering a minimum data coverage level of 95%. Higher data cover-age, 99%, (marked with superscript“a”in Table3) may be achieved for some measurements at the cost of increased measurement time. Some examples of the optimized mea-surements are shown in Fig.2.
Relatively smooth metal AM surfaces, e.g., LPBF Al-Si-10Mg (S1 and S2), can be easily measured using low mag-nification objectives, e.g., the1.4×wide-field lens, without the need of additional advanced functions. Rougher metal
AM surfaces, e.g., EBPBF and LPBF Ti-6Al-4V top surfa-ces, can still be measured with 95% data coverage using low-magnification objectives, without significantly increasing the measurement time. In the case of even more challenging metal AM surfaces, an objective lens with high NA should be selected to measure the high slopes, and a much larger signal oversampling factor is needed. Consequently, the measurement area will be reduced and the measurement time will be increased significantly.
5 Conclusions
AM surfaces have high roughness and contain a large number of high slopes and loose particles. Thus, it is very difficult to accurately measure surface topography at a high resolution. The CSI technique was originally designed to measure relatively smooth surfaces (e.g., optics). This technique has previously not been considered feasible for measuring AM surfaces; however, recent progress in the development of the CSI technique allows a significantly enhanced detection sensitivity through the use of advanced measurement functions, such as filtering of the source spec-trum, HDR lighting levels, adjustable number of camera acquisitions over each interference fringe, and sophisticated topography reconstruction algorithms.
In this paper, the effects of advanced measurement functions on the measurements of several typical AM surfa-ces have been demonstrated and analyzed systematically. Recommendations are provided for optimization of measure-ment for metal AM surfaces in terms of time, measuremeasure-ment area, and data coverage. Results show that the CSI technique may provide excellent surface topography measurements for metal AM surfaces with various roughness levels and slope distributions.
Acknowledgments
This work was supported by the Engineering and Physical Sciences Research Council (EPSRC) (Grant Nos. EP/ M008983/1 and EP/L01534X/1) and 3TRPD Ltd.
References
1. I. Gibson, D. W. Rosen, and B. Stucker, Additive Manufacturing Technologies, 2nd ed., Springer, New York (2015).
2. National Institute of Standards and Technology,Measurement Science Roadmap for Metal-Based Additive Manufacturing, Energetics Incorporated, Columbia, Maryland (2013).
[image:8.630.61.567.77.193.2]3. J. S. Taylor,“Surface characteristics of additive-manufactured compo-nents,”in15th Int. Conf. on Metrology and Properties of Engineering Surfaces, University of North Carolina, Charlotte (2015).
Table 3 Measurement optimizations for metal AM surfaces in terms of measurement time and FOV (95% data coverage by default).
Sample surfaces
S1/S2 S3 S4 S5
LPBF Al-Si-10Mg top/side LPBF Ti-6Al-4V top EBPBF Ti-6Al-4V top LPBF Ti-6Al-4V side
Spectral filtering Narrow (40-nm BP filter)
Fringe analysis Coherence envelope method
Objective lensa 1.4×b 5.5× 5.5× 50×
Oversampling factor — —or 4b 2 or 8b 16
a1×zoom lens.
4. A. Townsend et al.,“Surface texture metrology for metal additive manu-facturing: a review,”Precis. Eng.46, 34–47 (2016).
5. D. Gu,Laser Additive Manufacturing of High-Performance Materials, Springer-Verlag, Berlin (2015).
6. R. K. Leach,Fundamental Principles of Engineering Nanometrology, Elsevier, Oxford (2014).
7. ISO 25178-602:2010 Geometrical product specification (GPS)— surface texture: areal—part 602: nominal characteristics of non-contact (confocal chromatic probe) instruments.
8. R. Artigas,“Imaging confocal microscopy,”inOptical Measurement of Surface Topography, R. K. Leach, Ed., pp. 237–286, Springer-Verlag, Berlin (2011).
9. ISO 25178-604:2013 Geometrical product specifications (GPS)— surface texture: areal—part 604: nominal characteristics of non-contact (coherence scanning interferometry) instruments.
10. P. de Groot,“Principles of interference microscopy for the measurement of surface topography,”Adv. Opt. Photonics7, 1–65 (2015). 11. J. Schmit,“White-light interference 3D microscopes,”Chapter 10 in
Handbook of Optical Dimensional Metrology, K. Harding, Ed., pp. 395–418, Taylor & Francis, Boca Raton (2013).
12. ISO 25178-606:2015 Geometrical product specification (GPS)— surface texture: areal—part 606: nominal characteristics of non-contact (focus variation) instruments.
13. F. Helmli,“Focus variation instruments,”inOptical Measurement of Surface Topography, R. Leach, Ed., pp. 131–166, Springer-Verlag, Berlin (2011).
14. ISO 25178-2:2012 Geometrical product specifications (GPS)—surface texture: areal—part 2: terms, definitions and surface texture parameters. 15. R. K. Leach, Characterisation of Areal Surface Texture,
Springer-Verlag, Berlin (2013).
16. ISO 4287:1997 Geometrical product specifications (GPS)—surface tex-ture: profile method—terms, definitions and surface texture parameters. 17. R. K. Leach, The Measurement of Surface Texture Using Stylus Instruments, NPL measurement good practice guide no. 37, National Physical Laboratory, Teddington (2014).
18. P. Lehmann and W. Xie,“Signal formation in depth-scanning 3D inter-ference microscopy at high numerical apertures,” Proc. SPIE9660, 966015 (2015).
19. M. Fay, X. C. de Lega, and P. de Groot,“Measuring high-slope and super-smooth optics with high-dynamic-range coherence scanning interferometry,” in Classical Optics, OSA Technical Digest (online) (2014).
20. J. Petzing, J. Coupland, and R. K. Leach,The Measurement of Rough Surface Topography Using Coherence Scanning Interferometry, NPL measurement good practice guide no. 116, National Physical Laboratory, Teddington (2010).
21. M. Fay, V. Badami, and X. C. de Lega,“Characterizing additive manu-facturing parts using coherence scanning interferometry,” in ASPE Spring Topical Meeting on Dimensional Accuracy and Surface Finish in Additive Manufacturing, University of California, Berkeley (2014).
22. M. Schmidt, N. Gilfoy, and M. Fay,“High slope metrology with non-contact interferometry,”Quality Mag.(2014).
23. K. G. Larkin,“Efficient nonlinear algorithm for envelope detection in white light interferometry,”J. Opt. Soc. Am. A13, 832–843 (1996). 24. I. Kiselev et al., “Precision of evaluation methods in white light
interferometry: correlogram correlation method,” Instrum. Detect., arXiv:1703.05570 (2017).
25. R. K. Leach et al., Guide to the Measurement of Smooth Surface Topography Using Coherence Scanning Interferometry, NPL measure-ment good practice guide no. 108, National Physical Laboratory, Teddington (2008).
26. J. Roth and P. de Groot,“Wide-field scanning white light interferometry of rough surfaces,”inSpring Topical Meeting on Advances in Surface Metrology, pp. 57–60 (1997).
27. Zygo Corporation, NewView 8300, specification sheet SS-0100 01/15 (2015).
28. P. de Groot and J. Biegen,“Interference microscope objectives for wide-field areal surface topography measurements,”Opt. Eng.55(7), 074110 (2016).
29. Zygo Corporation, Nexview/Newview 8000/ZeGage objective chart, specification sheet SS-0101 12/15 (2015).
30. P. de Groot,“The meaning and measure of vertical resolution in optical surface topography measurement,”Appl. Sci.7, 54 (2017).
31. ASM Aerospace Specification Metals, Titanium Ti-6AL-4V-AMS-4911 (2015).
32. A. T. Sidambe,“Biocompatibility of advanced manufactured titanium implants—a review,”Materials7, 8168–8188 (2014).
33. E. Brandl et al., “Additive manufactured AlSi10Mg samples using selective laser melting (SLM): microstructure, high cycle fatigue, and fracture behaviour,”Mater. Des.34, 159–169 (2012).
34. R. K. Leach,Optical Measurement of Surface Topography, Springer-Verlag, Berlin (2011).
35. ISO 25178-3:2012 Geometrical product specifications (GPS)—surface texture: areal—part 3: specification operators.
36. R. K. Leach and H. Haitjema,“Bandwidth characteristics and compar-isons of surface texture measuring instruments,”Meas. Sci. Technol.21, 032001 (2010).
37. C. L. Giusca and R. K. Leach, Calibration of the Metrological Characteristics of Coherence Scanning Interferometers (CSI) and Phase Shifting Interferometers (PSI), NPL measurement good practice no. 127, National Physical Laboratory, Teddington (2013).
38. H. Haitjema,“Uncertainty in measurement of surface topography,”Surf. Topogr. Metrol. Prop.3, 035004 (2015).
39. A. Thompson et al.,“Topography of selectively laser melted surfaces: a comparison of different measurement methods,”CIRP Ann. 66(1), 543–546 (2017).
40. R. Su et al.,“On tilt and curvature dependent errors and the calibration of coherence scanning interferometry,”Opt. Express25, 3297–3310 (2017).