Constraining the temperature–density relation of the intergalactic
medium with the Lyman
α
and
β
forests
Elisa Boera,
1‹Michael T. Murphy,
1George D. Becker
2,3and James S. Bolton
41Centre for Astrophysics and Supercomputing, Swinburne University of Technology, Hawthorn, Victoria 3122, Australia 2Space Telescope Science Institute, 3700 San Martin Dr, Baltimore, MD 21218, USA
3Department of Physics and Astronomy, University of California, Riverside, 900 University Avenue, Riverside, CA,92521, USA 4School of Physics and Astronomy, University of Nottingham, University Park, Nottingham NG7 2RD, UK
Accepted 2015 October 28. Received 2015 October 27; in original form 2015 June 20
A B S T R A C T
The post-reionization thermal state of the intergalactic medium is characterized by a power-law relationship between temperature and density, with a slope determined by the parameterγ. We describe a new method to measureγusing the ratio of flux curvature in the Lymanαand
βforests. At a given redshift, this curvature ratio incorporates information from the different gas densities traced by Lymanαandβ absorption. It is relatively simple and fast to compute and appears robust against several observational uncertainties. We apply this technique to a sample of 27 high-resolution quasar spectra from the Very Large Telescope. While promising statistical errors onγ appear to be achievable with these spectra, to reach its full potential, the dependence of the curvature ratio on the thermal state of the gas in the foreground Lymanα forest will require further, detailed forward modelling.
Key words: intergalactic medium – quasars: absorption lines – cosmology: observations.
1 I N T R O D U C T I O N
The intergalactic medium (IGM) at low densities, with overdensities =ρ/ρ¯ 10 atz∼2–4, where ¯ρis the gas mean density, has a long adiabatic cooling time that allows it to maintain a record of important events that affected its thermal history, such as HIand HeII reionization (Hui & Gnedin1997). The energy injected on relatively short time-scales during these epochs will increase the IGM temperature, but it should also change its temperature–density (T–ρ) relation (e.g. Ricotti, Gnedin & Shull 2000; Schaye et al. 2000). In the simplest scenario, the interplay between cooling and photoionization heating by the UV background (UVB) results in a well-definedT–ρ relation,T()= T0γ−1, with a power-law slope,γ−1, and a temperatureT0at the cosmic mean density (Hui & Gnedin1997; McQuinn & Upton Sanderbeck2015).
However, during and immediately after the HIand HeII reion-izations (atz=6–11 and 3–4, respectively, e.g. Syphers & Shull 2014; Worseck et al.2014; McGreer, Mesinger & D’Odorico2015) cosmological simulations predict thatγ may vary, becoming mul-tivalued and spatially-dependent (e.g. Bolton, Meiksin & White 2004; McQuinn et al.2009; Meiksin & Tittley2012; Compostella, Cantalupo & Porciani2013; Puchwein et al.2015). Despite con-siderable recent improvements, accurately simulating the effect of reionization events on the IGM remain an open challenge. Precise observational constraints are therefore desirable.
E-mail:[email protected]
The main laboratory to detect variations in theT–ρrelation has been the HILymanα(Lyα) forest in quasar spectra. Efforts to infer the thermal state of the IGM have used either line-profile decomposition to measure gas temperature as a function of column density (e.g. Ricotti et al.2000; Schaye et al.2000; McDonald et al. 2001; Rudie et al.2013; Bolton et al.2014) or a variety of statistical approaches which are valuable at higher redshifts,z >3, where line fitting is problematic (e.g. Theuns et al.2002; Becker, Rauch & Sargent2007; Bolton et al.2008; Lidz et al.2010; Becker et al. 2011; Boera et al.2014; Lee et al.2015). While these methods probe wide redshift and density ranges (z≈1.6–5,≈ 0.3–8), large uncertainties, particularly in the measurements ofγ, remain.
and Lyβ+αforest regions (i.e. around the same redshift, where in the Lyβ+αregion the redshift refers to Lyβonly) is sensitive to differences in the IGM thermal state between the two density regimes. Averaged over many lines of sight, this curvature ratio allowsγto be measured with little sensitivity toT0.
We demonstrate the potential for this technique using 27 quasar spectra spanning the redshift range 2z3.8. That potential is currently limited by assumptions regarding the thermal state of the foreground Lyαforest; we propose how these can be overcome with future simulations and a refined data analysis approach.
2 T H E O B S E RVAT I O N A L DATA
The 27 quasar spectra were originally retrieved from the archive of the Ultraviolet and Visual Echelle Spectrograph (UVES) on the Very Large Telescope (VLT). They were selected on the basis of quasar redshift, wavelength coverage and signal-to-noise ratio from the sample of 60 spectra used in Boera et al. (2014) (hereafterB14). They have resolving power R ∼50 000 and continuum-to-noise ≥24 pix−1in the Lyαforest region. This level of spectral quality is necessary so that the curvature measurement is not dominated by noise and unidentified metal lines. Because our new method compares the curvature of the Lyαandβ+αforest regions, we extended these same criteria to the Lyβ+αregion atz∼2.0–3.8, reducing the sample from 60 to 27 spectra. The quasar sample details are provided in table 1 in the Supporting Information (hereafter SI). To establish an initial continuum in the Lyβ+αregion, we ap-plied the same automatic, piece-wise polynomial fitting algorithm in B14, with the same parameters, leaving the Lyα region un-changed. While manual refitting was necessary in some spectra for particular parts of the Lyβ+αregion, this initial continuum has little effect on the final curvature measurements because the spectra are subsequently renormalized based on a b-spline fit to the flux profile (see Section 4.1).
3 T H E S I M U L AT I O N S
We used the same hydrodynamical simulations inB14to produce synthetic spectra for Ly β + α and Ly α in the redshift range z=2.0–3.5. TheGADGET-3 smoothed-particle hydrodynamic simu-lations include dark matter and gas, with 2×5123particles and a gas particle mass of 9.2×10⁴M
in a periodic box of 10 comoving
h−1Mpc (seeB14for details). The gas, assumed to be optically thin, is in equilibrium with a spatially uniform UVB (Haardt & Madau 2001), but the photoheating rates have been rescaled so that the cor-responding values ofT0andγvary between different simulations. The parameters characterizing the different models are summarized in table 2 in the SI. From each model, synthetic Lyαforest
spec-Box size and mass resolution convergence tests are available in fig. 1 and table 3 of the SI.
4 T H E C U RVAT U R E R AT I O M E T H O D
The curvature for a region of spectrum is defined as κ ≡
F(1 + F2)−3/2 (Becker et al.2011), with the first and second derivatives of the normalized flux (i.e. transmission;F,F) taken with respect to wavelength or relative velocity. As demonstrated in previous works, the Lyαforest curvature is directly related to the IGM temperature at the characteristic overdensities probed by this absorption (α 5–2 forz=2–3.5), regardless ofγ. Because the median overdensity contributing to Lyβforest absorption is higher than that for Lyα(Furlanetto & Oh2009), the mean absolute curva-ture computed from sections of Lyβ+αforest will be, on average, a tracer of the IGM temperature in a higher density regime (β 8–5 forz=2–3.5). Therefore, the curvature ratio, at each redshift z,
Rκ(z)≡ |κ|κβ+α(z)| α(z)| ,
(1)
probes temperatures at two different gas densities and, consequently, is sensitive toγ. Here, the mean absolute curvatures for Lyβ+αand Lyαare averaged over spectral sections of 10 comovingh−1Mpc centered on the same redshift (corresponding to the simulation box size and, again,zin the Lyβ+αregion refers to Lyβabsorption). Due to the presence of foreground Ly α absorption, Rκ(z) also depends on the evolution ofγandT0withz(see Section 4.3).
4.1 Analysis of simulated spectra: theγ–logRκrelation
We find the connection between the curvature ratio,Rκ, andγ at the redshifts of the simulation snapshots (z=[2.173, 2.355, 2.553, 2.760, 3.211, 3.457]) by computing the meanRκ over the 1024 simulated lines of sight for each thermal history, and fitting a simple function between logRκandγ.
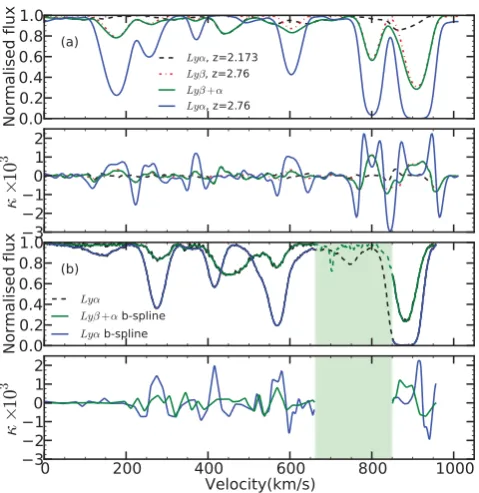
Figure 1. Curvature for simulated and real spectra. The top two panels display the simulated Lyα(blue solid line) and Lyβ+αforests (green solid line) atz=2.76 and the curvature from b-spline fits. The spectra are obtained by contaminating the corresponding Lyβforest (red dotted line) with a randomly chosen Lyαsection at lower redshift (black dashed line). The lower two panels are as above but for a real Lyαand Lyβ+αspectrum. The spectra (black lines) are plotted behind the b-spline fits. Shading shows a Lyβ+αregion contaminated by metal absorption (green dashed line); the corresponding part of the Lyαspectrum is also masked (black dashed line).
the re-normalized b-spline fit falls in the range 0.1–0.9 are used to measure the mean absolute curvature of each section. In this way we maximize the sensitivity to the signal and avoid possible systematic uncertainties: we exclude saturated pixels, which do not contain useful information, and pixels with little-to-no absorption whose curvature is near zero and uncertain.
In Fig. 2, we present theγ–logRκrelationship obtained by averaging the curvature ratio computed from the synthetic spectra with different thermal histories, i.e. differentγ andT0values. At each redshift, models characterized by the sameγ value, but with
T0ranging between 5000–31 000 K, yield logRκvalues that vary
by only0.01 dex. Therefore, for each redshift, it is possible to fit a simple powerlaw (aγb+c) that connects the mean logR
κand
γindependently ofT0, at least in these simulations (see also table 4 and fig. 2 in the SI). As redshift decreases, the relation between logRκandγbecomes steeper, as shown in Fig.2. Given this tight correspondence, the curvature ratio represents an interesting tool to independently measure the slope of the IGMT–ρrelation.
The sensitivity of this nominalγ–logRκrelation to observa-tional uncertainties in the spectra was tested as follows.
[image:3.595.315.540.56.214.2](i) Noise: the synthetic spectra from which we obtain the nominal relationship need to include noise at the same level as in the real spectra. If, as an extreme example, no noise was added, Fig. 2 shows the effect on theγ–logRκrelation: an∼5 per cent decrease inRκ(∼0.02 dex in logRκ). This would cause an∼8 per cent underestimation ofγ, comparable to the statistical errors in our observational sample (see Section 4.2). Therefore, any errors in how the noise properties of a sample like ours are incorporated into
Figure 2. Relationship betweenγ and the mean curvature ratio, logRκ, from our nominal simulations at three different redshifts. For clarity, we show the values of logRκfrom the different models and the relation with-out noise forz=2.760 only (coloured points and dashed line, respectively). See fig. 2 and table 4 in the SI for the plots corresponding to the other redshifts and the fitting parameters.
the γ–logRκrelation should cause relatively small systematic uncertainties inγmeasurements.
(ii) Effective optical depth: changing the effective optical depth by 10 per cent alters logRκby 0.01 dex and, consequently,γ by ∼4 per cent, again well within the statistical uncertainties in our observational sample. This point is particularly promising because the curvature for the Lyαforest alone (and the Lyβ+αforest alone) is considerably more sensitive to this quantity, as explored inB14.
However, while the nominalγ–logRκrelation is robust to these observational aspects, systematic uncertainties in the evolution of the IGM thermal state must also be considered (see Section 4.3).
4.2 The observed curvature ratio
To apply the method to the 27 real quasar spectra we compute the curvature ratio in sections of 10 comovingh−1Mpc of metal-free Lyαand corresponding Lyβ+αforest regions. Narrow metal lines (b15 kms−1) represent a potentially serious source of systematic errors in any measure of forest absorption and should be avoided. With this aim we ‘clean’ the spectra, using the exact procedure detailed inB14, extended to the Lyβ+αregion: metal absorbers redward of the Lyαemission line are identified and all strong metal transitions at their redshifts are masked out, followed by a by-eye check of the remaining forest.
While the metal correction produces spectra that are reasonably free of contaminants, this procedure reduces the quantity of infor-mation available in different sections in a non-uniform way, intro-ducing a possible source of bias. Because the curvature ratio traces differences in the absorption features of two different regions of the same observed spectrum, avoiding systematic effects requires that they cover the same absorption redshift range. Therefore, be-fore measuringRκ from the real data, we mask out regions of the Lyβ+αforest corresponding to any range masked from the Lyα forest, and vice versa. Fig.1shows an example of this masking procedure. Finally, possible edge effects are avoided: we do not include the 4 pixels closest to the edge of any masked region in the curvature ratio calculation.
Fig. 3 presents the curvature ratio results from our observa-tional sample. The statistical uncertainty in an individual logRκ
Figure 3. Curvature ratio,Rκ from each pair of Lyβ+αand Lyα sec-tions from 27 UVES/VLT quasar spectra (black circles). The measure-ment of logRκ, averaged within each redshift bin, is shown with 1σ bootstrap errors both before (red squares) and after (green points) the metal masking procedure. The expected evolution of logRκ, from our nominal simulations with relatively constantγ, is presented forγ ∼1.5 (solid blue line) and γ ∼ 1.0 (dashed blue line). The redshift bins are (zmin,z, z¯ max)=(2.0,2.27,2.5),(2.5,2.86,3.1),(3.1,3.36,3.74), and the
(metal-masked) logRκ measurements are−0.110±0.026,−0.019± 0.030 and 0.017±0.032, respectively.
spectral sections, is negligible compared to the much larger vari-ance among different measurements. Therefore, in each of three broad redshift bins, which include>30 individual measurements, we calculate the mean logRκand its uncertainty using a bootstrap technique using the measurements in the bin. The width and roughly Gaussian shape of the logRκdistribution within each bin is also re-produced by our simulated spectra, providing some confidence that the simulations adequately describe the statistical properties of the observed forest absorption (see fig. 3 in the SI).
There is evidence for a mild evolution in logRκas a function of redshift. A Spearman rank correlation test reveals a positive cor-relation (r≈0.26) with an associated probability of≈0.001. For a constantγ, this increase in logRκis consistent with the expected increase in logRκat increasing redshifts seen in Fig.2. In particu-lar, our logRκmeasurements in Fig.3show good agreement with the expected evolution for a model withγ ∼1.5, i.e. a scenario consistent with the recent result of γ =1.54±0.11 at z∼2.4 from Bolton et al. (2014). The absence of a strong change in the curvature ratio in the redshift range considered is consistent with the assumption in the nominal simulations thatγremains relatively constant over redshiftsz=2–3.5 (but see discussion on systematic uncertainties below).
Fig.3also shows logRκcomputed without first masking the metal absorption lines. Even though the effect of metal contamina-tion is important when measuring the curvature of the Lyαforest alone (B14), it is similar in the corresponding sections of Lyβ+α forest, so the curvature ratio is less sensitive to this correction. The results in Fig.3show that, evenwithout applying the metal cor-rection, the bias introduced in logRκis∼0.05 dex. Therefore, possible errors in the metal masking procedure will introduce small uncertainties inγ compared to our statistical ones.
4.3 Modelling uncertainties
Our nominal simulations assume only mild evolution inT0(T0∼ 2000 K) andγ(γ0.02) between the Lyβand the foreground
atures at a given overdensity from shock-heating/radiative cooling. However, in this way we can easily modify theT0andγparameters, and their evolution, to explore the effect on theγ–logRκwithout running new hydrodynamical simulations. The largest effects on the γ–logRκrelation were found in the following two tests.
(i) Rapid evolution inT0: for the redshift rangez=2–3.5,T0 evolves in our nominal simulations such that the temperature dif-ference between the foreground and the Lyβ redshift is small, T0≡T0(Lyβ)−T0(foreground)2000 K. To test the effect of much stronger variations in the temperature at the mean density, we modified the values ofT0in each of our nominal simulations, for the foreground Lyαforest only, using the post-processing approach. We then computed the change in logRκcompared to the nominal values,logRκ. Fig.4shows the direct relationship betweenT0 andlogRκ. For example, ifT0changes by a further≈5000 K betweenz=3.2 (Lyβ) andz=2.6 (foreground), we would expect a systematic error in our measurement of logRκof≈0.03, similar to the statistical error per redshift bin derived from our 27 quasar spectra.
(ii) Rapid evolution inγ: similar to theT0test above, we emu-lated rapid changes inγover short time-scales,z≈0.6, by post-processing the foreground Lyαforest only. Again, we find a strong correlation between the change in foregroundγand logRκ; for ex-ample, a decrease in the foregroundγby 0.15 implieslogRκ ≈
0.03, again equivalent to the statistical uncertainties in our three redshift bins.
On the other hand, we found that theγ–logRκrelation was insensitive to variations in the integrated thermal history in the
Figure 4. Expected relation between the variation in logRκand the tem-perature change,T0between the Lyβredshift and foreground Lyαforest
(black curve, see text for details). The green shading indicates the typical sta-tistical uncertainty in our measured logRκvalues. TheT0in our nominal
[image:4.595.311.539.532.655.2]simulations (i.e. Jeans smoothing effects) when the instantaneous
T0andγare held fixed (see fig. 4 in the SI).
While highlighting the potential importance of assumptions for the foreground Lyαforest, the above tests rely on a rather simplistic toy model that does not reproduce self-consistently the evolution of the complex relationships between physical parameters. Ideally, the sensitivity of theγ–logRκrelation to different physical as-sumptions and thermal histories would need to be tested with ad-ditional self-consistent simulations in the redshift range of interest. Our simulation suite does offer one such self-consistent test in the case of strongT0evolution: we used the ‘T15fast’ and ‘T15slow’ simulations of Becker et al. (2011) (see their fig. 8) to mimic a possible∼5000 K heating event from HeIIreionization atz >3 such that between the Lyβand foreground redshifts there was a typical decreaseT0≈2000–4000 K. In both simulations we find that logRκ, varies by0.01 compared to the nominal simulations (see Fig.4), which seems less sensitive to substantial evolution in
T0than implied by our simplistic toy model. However, differences in the pressure smoothing scale in these models (which may be act-ing to improve the agreement) prevent us from reliably estimatact-ing the systematic uncertainties involved without further self-consistent tests. Nevertheless, these results suggest that the curvature ratio is a promising alternative tool to measure the density dependence of the IGM thermal state.
5 C O N C L U S I O N S
We have presented a new approach to constraining the slope of the
T–ρ relation using the ratio of curvatures,Rκ, in the Lyαand βforests. The statistic appears robust against observational uncer-tainties in the noise level, metal contamination and effective optical depth, and is relatively simple and fast to compute. We measure Rκin 27 VLT/UVES quasar spectra, achieving≈6 per cent sta-tistical accuracy in three redshift bins coveringz=2.0–3.5. In the absence of any other systematics, this translates to a10 per cent uncertainty inγ, suggesting thatRκshould be a useful tool to constrain the slope of theT–ρrelation, possibly competitive with recent attempts to measureγusing line decomposition (Rudie et al. 2013; Bolton et al.2014).
The primary goal of this Letter is to introduce theRκstatistic. However, we emphasize that the thermal state of the foreground Lyα forest may complicate a direct translation ofRκinto a constraint on γ. The simulations used in this Letter have simple thermal histories where bothT0andγremain relatively constant over 2z5. The impact onRκfor some deviations from these histories are explored in Section 4.3; however, we have not attempted to capture the full range of possibleT0andγevolutions expected for non-equilibrium photoheating during HeIIreionization (e.g. McQuinn et al.2009; Haardt & Madau2012; Puchwein et al.2015) or more exotic models incorporating e.g. blazar heating (Puchwein et al.2012). We intend to more fully explore these issues in a future work. If the major systematic uncertainties can be marginalized over, or ifRκcan be combined with other statistics to simultaneously determineT0(z) andγ(z), then the curvature ratio promises to be an effective tool for constraining the thermal history of the IGM over a large redshift range.
AC K N OW L E D G E M E N T S
The simulations were performed using the Darwin Supercomputer of the University of Cambridge High Performance Computing Ser-vice, provided by Dell Inc. using Strategic Research Infrastructure
Funding from the Higher Education Funding Council for England. MTM thanks the Australian Research Council forDiscovery Project
grant DP130100568, GDB acknowledges support from the Kavli Foundation and JSB acknowledges the support of a Royal Society University Research Fellowship.
R E F E R E N C E S
Becker G. D., Rauch M., Sargent W. L. W., 2007, ApJ, 662, 72
Becker G. D., Bolton J. S., Haehnelt M. G., Sargent W. L. W., 2011, MNRAS, 410, 1096
Becker G. D., Hewett P. C., Worseck G., Prochaska J. X., 2013, MNRAS, 430, 2067
Boera E., Murphy M. T., Becker G. D., Bolton J. S., 2014, MNRAS, 441, 1916 (B14)
Bolton J., Meiksin A., White M., 2004, MNRAS, 348, L43
Bolton J. S., Viel M., Kim T.-S., Haehnelt M. G., Carswell R. F., 2008, MNRAS, 386, 1131
Bolton J. S., Becker G. D., Haehnelt M. G., Viel M., 2014, MNRAS, 438, 2499
Compostella M., Cantalupo S., Porciani C., 2013, MNRAS, 435, 3169 Dijkstra M., Lidz A., Hui L., 2004, ApJ, 605, 7
Furlanetto S. R., Oh S. P., 2009, ApJ, 701, 94
Haardt F., Madau P., 2001, in Neumann D. M., Tran J. T. V., eds, Clusters of Galaxies and the High Redshift Universe Observed in X-rays. CEA Haardt F., Madau P., 2012, ApJ, 746, 125
Hui L., Gnedin N. Y., 1997, MNRAS, 292, 27
Irˇsiˇc V., Viel M., 2014, J. Cosmol. Astropart. Phys., 12, 24 Lee K.-G. et al., 2015, ApJ, 799, 196
Lidz A., Faucher-Gigu`ere C.-A., Dall’Aglio A., McQuinn M., Fechner C., Zaldarriaga M., Hernquist L., Dutta S., 2010, ApJ, 718, 199
McDonald P., Miralda-Escud´e J., Rauch M., Sargent W. L. W., Barlow T. A., Cen R., 2001, ApJ, 562, 52
McGreer I. D., Mesinger A., D’Odorico V., 2015, MNRAS, 447, 499 McQuinn M., Upton Sanderbeck P., 2015, preprint (arXiv:1505.07875) McQuinn M., Lidz A., Zaldarriaga M., Hernquist L., Hopkins P. F., Dutta
S., Faucher-Gigu`ere C.-A., 2009, ApJ, 694, 842 Meiksin A., Tittley E. R., 2012, MNRAS, 423, 7
Padmanabhan H., Srianand R., Choudhury T. R., 2015, MNRAS, 450, L29 Puchwein E., Pfrommer C., Springel V., Broderick A. E., Chang P., 2012,
MNRAS, 423, 149
Puchwein E., Bolton J. S., Haehnelt M. G., Madau P., Becker G. D., Haardt F., 2015, MNRAS, 450, 4081
Ricotti M., Gnedin N. Y., Shull J. M., 2000, ApJ, 534, 41
Rudie G. C., Steidel C. C., Shapley A. E., Pettini M., 2013, ApJ, 769, 146 Schaye J., Theuns T., Rauch M., Efstathiou G., Sargent W. L. W., 2000,
MNRAS, 318, 817
Syphers D., Shull J. M., 2014, ApJ, 784, 42
Theuns T., Zaroubi S., Kim T.-S., Tzanavaris P., Carswell R. F., 2002, MNRAS, 332, 367
Worseck G., Prochaska J. X., Hennawi J. F., McQuinn M., 2014, preprint (arXiv:1405.7405)
S U P P O RT I N G I N F O R M AT I O N
Additional Supporting Information may be found in the online ver-sion of this article:
Tables 1, 2, 3 and 4, and Figures 1, 2, 3 and 4.(http://www.mnrasl. oxfordjournals.org/lookup/suppl/doi:10.1093/mnrasl/slv172/-/DC1). Please note: Oxford University Press is not responsible for the content or functionality of any supporting materials supplied by the authors. Any queries (other than missing material) should be directed to the corresponding author for the article.