2012. Vol.2, No.1, 33-40
Published Online January 2012 in SciRes (http://www.SciRP.org/journal/ojf) http://dx.doi.org/10.4236/ojf.2012.21005
Forest Biomass Availability Analysis and Large-Scale
Supply Options
Tapio Ranta, Olli-Jussi Korpinen, Eero Jäppinen, Kalle Karttunen
The Faculty of Technology, Lappeenranta University of Technology, Mikkeli, FinlandEmail: [email protected]
Received September 27th, 2011; revised October 31st, 2011; accepted November 8th, 2011
Finnish forest companies aim to produce biodiesel based on the Fischer-Tropsch process from forest re- sidues. This study presents method to evaluate biomass availability and supply costs to the selected biore- finery site. Forest-owners’ willingness to sell, buyers’ market share, and regional competition were taken into account when biomass availability was evaluated. Supply logistics was based either on direct truck transportation deliveries from forest or on railway/waterway transportation via regional terminals. The large biomass need of a biorefinery demanded both of these supply structures, since the procurement area was larger than the traditional supply area used for CHP plants in Finland. The average supply cost was 17 €/MWh for an annual supply of 2 TWh of forest biomass. Truck transportation of chips made from log-ging residues covered 70% of the total volume, since direct forest chip deliveries from forest were the most competitive supply solution in terms of direct supply costs. The better supply security and lower ve-hicle capacity needs are issues that would favour also terminal logistics with other raw-material sources in practical operations. One finding was that the larger the biomass need, the less the variation in biomass availability and supply costs, since almost the whole country will serve as a potential supply area. Bio-mass import possibilities were not considered in this study.
Keywords: Logistics; Forest Residues; Supply Chain; Biorefinery
Introduction
In Finland, the target for renewable energy as a share of final energy consumption will be 38% by 2020 (Long-Term Climate and Energy Strategy, 2008). In the year of comparison 2005, the share was 28.5%, but it has fallen to 26% in 2010 because of the declining production volumes in the forest industry (Sta-tistics Finland, 2011). In particular, wood fuels will be tasked with a considerable share of the work to meet Finnish targets. Wood fuels accounted for 81% (308 PJ) of renewable energy primary use (380 PJ) in 2010 (Statistics Finland, 2011). The Climate and Energy Strategy of Finland presupposes wood fuel primary use to achieve the level of 335 PJ (forest chips: 76 PJ) under the base scenario or 349 PJ (forest chips: 86 PJ) in the target scenario by 2020 (Long-Term Climate and Energy Strat-egy, 2008). The target scenario strives toward the aim of RES for Finland. The difference between the scenarios follows from the increased forest chip use, while use of forest industry vol-ume-dependent wood by-products and black liquor is forecast to decline according to both scenarios, which underpins the development of forest chip use. The study by Pöyry Energy (2009) estimated that supply by products would decline some 16% (16 PJ) between 2005 and 2010.
Under the Climate and Energy Strategy, the total use of for- est chips (86 PJ) involves some 12 million solid cubic metres. The latest aim stated by the Government of Finland is to increase this volume to the level of 13.5 million solid cubic metres (90 PJ). Techno-economical potential will lie somewhere around 151 - 168 PJ by 2020 (Pöyry Energy, 2009); therefore, the target is challenging to utlilise more than half of the potential within this time frame. Uncertainties arise from the development of round- wood felling levels, energy wood subsidy schemes, pricing of
emission allowances and prices of alternative fuels. In addition, Finland aims to build three biorefineries, each needing at least 1 million·solid·m3 of forest chips a year outside of the forest in-
dustry site. These targets and related incentives were announced in a national action plan sent for the European Commission in June 2010. The incentives included an energy subsidy for energy wood from first thinnings, a feed-in tariff for small-scale CHP (<20 MW) using forest chips, and a production subsidy depen- dent on EU-ETS allowance price for electricity produced from forest chips in co-combustion boilers (>20 MW). The idea is to replace peat and coal with wood and link the level of the sub- sidy to the price development of CO2 allowances.
The development of forest chips’ use has been rapid so far in the 21 century. From 2000 to 2010, the use of forest chips increased from 7 PJ (0.9 million·solid·m3) to 50 PJ (6.9 million·solid·m3).
The energy industry (district heat and power production) used 45 PJ and small houses 5 PJ in 2010 (Ylitalo, 2011). Forest chips con-sisted of logging residues (36%), small-diameter energy wood (41%), stumps (16%), and roundwood (8%).
an especially essential part of railway logistics for keeping the train capacity in use (Korpinen et al., 2008).
It could be expected that other transport modes will claim a certain part of domestic transport markets for forest chips. Larger forest chip supply volumes calls for logistics systems including buffer terminals and transport modes suitable for longer distances. Supply costs will increase because of more handling and stor- age, but at the same time it is possible to increase the availabil- ity and supply security.
The larger forest chip volumes and longer transport distances will be clearly manifested with biorefineries despite their inte- gration into paper and pulp mills. Finnish forest companies aim to produce biodiesel from domestic forest chip raw-material sources, where the biofuel production technology will use the Fischer-Tropsch process. At the moment, the production tech- nology is being further developed and evaluated for forest chips through demonstration and pilot plants. Also tentative produc-tion sites for commercial-scale plants have been selected and biomass availability estimated. In practical terms, only existing forest integrates would be suitable sites in Finland. The advan- tages of process integration will increase the conversion effi- ciency from 60% to 90% (McKeough & Kurkela, 2008). There are three groups of operators interested in investing in a biore- finery and thus three parallel projects in progress in Finland. The additional biomass need per commercial site is at least 1 mil-lion·m3, i.e., 2 TWh of biomass and hundreds of truckloads per
day, depending on the use of other modes of transport. The maximum need would be double this: 4 TWh of biomass.
The analysis tool reported upon in this study will be targeted at assisting availability and alternative supply chain studies for potential biorefinery sites in Finland. The biorefinery scale is commercial, with production of 100,000 tonnes of biodiesel a year. The analysis will be bound to a regional operational envi- ronment of supply infrastructure, including alternative transport networks such as roads, inland waterways and railways, poten- tial forest biomass resources and alternative supply logistics struc- tures. Regional competition is an important part of the study, for evaluating realistic biomass availability. Logistical structures dic- tate how the supply chain is constructed between supply and de- mand site including storage phases and the form in which mate- rial is handled in the various stages. Geographical information system (GIS) use is applied for analysing biomass resources in a competitive situation among end users and alternative supply logistics structures and for examining supply costs.
Material and Methods
Forest Biomass Reserves
Calculations of biomass potential were based on commercial fellings reported upon at municipality level in Metinfo forest information services in 2009. Volumes were obtained for 2004- 2008 and averaged. The biomass calculation method was re- ported upon in an earlier study, where techno-economical log- ging residue and stump volumes were converted from round-wood felling volumes (Laitila et al., 2008). The calculation me- thod for small-diameter energy wood was based on National Forest Inventory data and also reported in the earlier study (An- ttila et al., 2009). Biomass volumes at municipal level (448 units) were distributed over smaller collection points (55,292 units). These points were based on actual regeneration felling points from 2002 to 2004. In this way, the municipal volume was spread to forestry land where fellings will occur also in the future. The
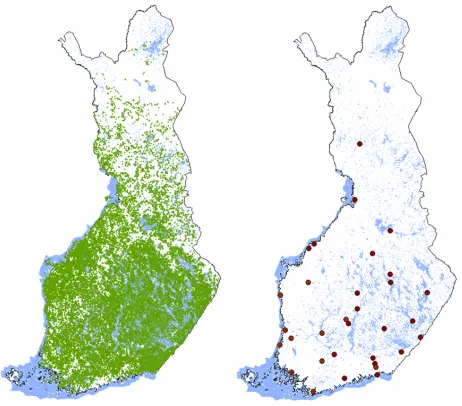
volume was divided equally across points within each munici- pality, for more fine-grained geographical coverage. The cove- rage of collection points was greater in areas where regenera-tion felling activity has been higher, such as eastern and central Finland (see Figure 1). With the volume assigned to these points, the regional availability and logistics calculations could be made more detailed.
Competition among End Users
Alternative end users of forest chips were geographically pinpointed to take into account the regional competition. Only large-scale users with more than 50 GWh of annual actual or planned use (approx. 30 sites) were selected (Figure 1). In prac- tice, these were municipal or industrial CHP plants. Also future potential user sites were taken into account, where the invest- ment has been decided on or is under construction. No potential biorefinery sites were selected, as no construction site decision has yet been made. Small-scale heating plant sites (approx. 400) were omitted, since their effect on regional use is rather low. Large-scale users account for 75% of forest chips’ end use, and the small-scale use could have been incorporated into large-scale use (Ylitalo, 2011). The regional coverage of users was extensive except in northern Finland.
The forest chips are supplied mainly in the proximity of ex-isting CHP plants, since the typical procurement area lies within 100 km. Because of the extensive geographical coverage and plants’ proximity to each other, the procurement areas are over- lapped, especially in the southern part of Finland. End users have access to only certain of the biomass sources surrounding the plants, since the biomass supply market is oligopolistic by na- ture. Many organisations supply biomass to alternative end users in the same region; in this study, the maximum market share was assumed to be 50%.
[image:2.595.309.540.500.703.2]At first, for each CHP plant the supply areas were calculated via road network to build an isodistance area (same road dis- tance at outer ring) that could meet the full demand. This area was called the inside supply area. From this area, 50% was allo- cated to the plant accounting for the maximum market share.
Figure 1.
The coverage of forest biomass collection points at the left side map and large-scale (>50 GWh/a) users of forest chips at right side map.
first stage. The supply area will be quadrupled with double the The rest was available for other users. Secondly, the outside sup- ply area was calculated with a distance double that used in the distance, and 17% of this area was allocated to the plant, with the rest being volume free for other users (Figure 2). From the overlapping area, the free volume (i.e., collection sites) was al- located by a method minimising the transport distance between alternative users.
Both the potential and the availability of small diameter energy wood are increasing in the northern part of Finland. Normally, the potential maps without competition showed the opposite si- tuation, since the potential of spruce logging residues and stumps is concentrated in central and eastern Finland (Ranta, 2005).
The supply potential for the inside area is the demand of the end user if the market share is 100%. Max. transport distance = r
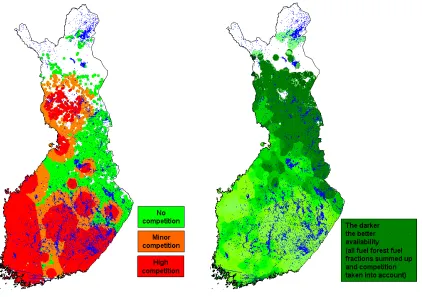
Especially in areas with high forest fuel demand and several overlapping supply areas, the transport distances increased. How- ever, the areas with the highest demand also had the highest poten-tial in central and eastern Finland. The western part of the country was outside the scope of the study. The intensity of the competition was illustrated through the use of colours in the map presentation (see Figure 3). Areas depicted in red had the highest competition, and 50% of the volume was allocated to CHP plants in the region. By contrast, in areas shown in brown, 17% was allocated; for those in green, all biomass volume was free and no competition existed. The greatest competition was in central and eastern Finland, where are many large-scale CHP-plants with high demand. The individual points with the highest demand were in Jyväskylä, in central Finland (1000 GWh), and in the city of Lappeenranta (800 GWh), in eastern Finland. The north-eastern part of the country had the least competition from biomass.
Transport distance to the periphery of the outside area = 2r
Availability from the inside area to the other users 50 %
Availability from the outside area to the other users 83% Mikkeli
Forest biomass availability was illustrated in a map presenta- tion via colour shading, with darker colour indicating better bio- mass availability (Figure 3). The map showed the biomass free after competition. Therefore, availability was best in the north-
ern part of the country, where there was the least competition. Figure 2. Isodistance areas and biomass volume allocation rules from the areas.
[image:3.595.308.539.146.373.2]Figure 3.
[image:3.595.90.512.403.700.2]Factors in Availability of Biomass to a Biorefinery
Forest resources, types, and felling activity dictate the bio- mass potential. So far, the spruce-dominated regeneration fellings have been the main source for forest chips’ recovery. Nowadays, also pine-dominated small diameter energy wood fellings and pine stump recovery has become more common. Regional compete- tion is a very important factor in examination of availability to a specific end-user site. The market share of roundwood fellings and forest-owners’ willingness to sell biomass for energy deter- mine the actual free biomass availability. Logging residues and stumps’ recovery are typically integrated into roundwood fellings; therefore, access to roundwood fellings provides the possibility of harvesting also energy wood from the same felling site if forest owners are willing to sell it. Forest industry companies are poten- tial biorefinery investors in Finland, and the domestic market share of one company is, on average, one third, although it varies a great deal by region. Forest-owners’ willingness to sell was examined in a survey done in the county of Etelä Savo in 2009. Alternative stumpage prices were taken into consideration. The results concerning willingness indicated 80% for logging resi- dues, 75% for small-diameter energy wood, and 50% for stumps. The main reason for declining energy wood harvesting was lack of information and fear of jeopardising the nutrient balance at the forest site.End-user site location and its proximity to biomass resources, regional geography, and transport networks and related infra- structure are site-dependent factors that dictate availability to the selected end user. The railway and waterway network will widen the procurement area beyond the normal area of less than 100 km via road network. Overall, the counties of Pohjois-Kar- jala, Kainuu, and Pohjois-Savo (in the north-east) and the south- ern part of Lapland are especially suitable for railway or water- way transport logistics.
Supply Logistics Alternatives
Supply logistics decisions were based on either roadside chip- ping and direct truck transportation or terminal chipping and railway/waterway transportation to the end-user site. The termi- nal chipping option included loose material’s transportation by trucks to terminals. Only inland and lake-area domestic supply was examined. Import options were excluded from this study.
The terminal sites were existing terminals, and selection for the study was based on suitability to act as a biomass supply ter- minal for the selected end-user site. Primarily, each location’s proximity to biomass sources and transport networks (rail-way/waterway) dictated the terminal sites. The secondary selec- tion criteria were technical properties and the terminal site’s suitability in terms of storage capacity, loading capacity and length of the loading rail or quay, and chipping conditions (re-moteness from residential areas). The maximum pre hauling distance for loose material was set to 80 km. Waterway termi-nals were on Lake Saimaa, along the deep channel (4.2 m). In total, 28 railway terminals and three waterway terminals were chosen (Figure 4).
Railway transportation was based on container logistics. Rail- way shipment involved 20 wagons each carrying 3 containers (modified 20 ft, 48 m3), for a total frame volume of 2880 m3 of
[image:4.595.309.536.79.479.2]forest chips. The properties of loading places imposed a limit on the train length, less than 450 m, or a 20-wagon train. The ma- ximum net load would in this case be 976 tonnes, which yields 2380 MWh. Each wagon took three containers, with the total,
Figure 4.
Railway and waterway terminals.
approx. 140 m3, being equivalent to a full 140 m3 trailer truck.
The bearing capacity of one wagon is 61 tonnes, so a fifth of the bearing capacity will remain unused. Loading was done by front loader and unloading with a forklift truck. Forklifts could be equipped with a weighing appliance and RFID-marking sys- tem. Biomass was chipped at the railway terminal to keep the degree of capacity utilisation of chipping facilities and trains as high as possible. Biomass was stored for the long term in un- comminuted form, to avoid material loss and any risk of self- ignition.
Waterway transportation was based on barge logistics, wherein a tugboat operates with a barge. Only the Lake Saimaa area is suitable for this option, apart from in the winter season, 3 - 4 months for which the lake is frozen. A typical suitable barge size for the Lake Saimaa area is the Europa IIa type: hold: 2650 m3,
load with heaped shape: 4000 m3, approx. 1200 tonnes. Stor-
age and chipping were done as with railway logistics. Loading and unloading were done by heavy material machines or exca-vators. Larger loads are possible with extended sides, since there is still a lot of carrying capacity (maximum: 2500 tonnes) left. Uncomminuted biomass from islands will come as deck load,
but for this study those options were excluded.
Supply Costs of Alternative Supply Chain Options
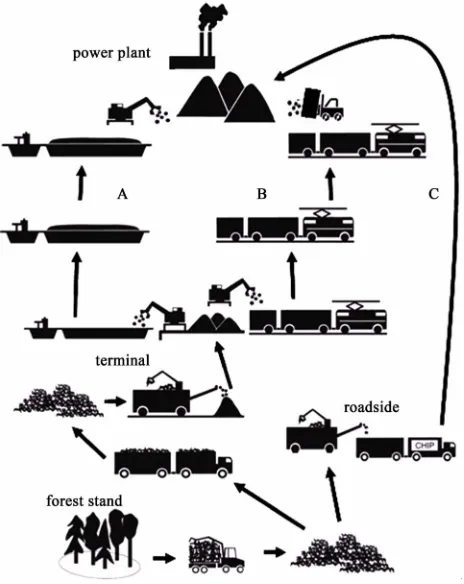
First supply cost without transport was calculated for each bio- mass fraction. Each collection point had alternative transporta- tion options, either direct truck transportation to the end user or transportation via terminals to the end user (Figure 5). Direct transport involved roadside chipping and truck transport of forest chips. Stump biomass was chipped not at the roadside but at ter- minals only, or it was transported as uncomminuted loads to the end user. Terminal options included also loose biomass truck transportation to terminals and further forest chip transportation to the end user by either railway or waterway, according to the terminal type.
Logging residues were the cheapest source of raw material, ahead of stumps and small-diameter energy wood. Small-diameter energy wood harvesting and chipping received a production sub- sidy. Without that, they would not be a competitive source (Fi-
gure 6).
Secondly, the transportation cost was calculated for each col- lection site, for the end user and alternative terminals. The chea- pest option was selected, either direct transport or transport via terminal. The increase in truck transportation costs was much greater than the increase for railway or waterway transport (Fi-
gure 7). The larger individual loads—by railway 20 trucks and
[image:5.595.308.540.92.349.2]by water 30 - 40 trucks—flatten out the growth in transport costs with these options. The cost functions were based on ear- lier studies, with updated cost parameters applied (Karttunen et al., 2008; Ranta & Rinne, 2006; Ryymin et al., 2008).
Figure 5.
[image:5.595.306.540.241.489.2]Alternative supply chain option for forest chips: waterway route A, railway route B, and road transport route C by truck.
Figure 6.
Supply costs without transportation.
Figure 7.
Transportation cost with alternative long distance transport options (label rank the same as the line rank in the figure).
Estimation of Vehicle and Chipper Capacity Needs
An important part of the supply logistics planning is estima-tion of how many vehicles and other machines are needed to feed enough biomass to the biorefinery in view of the supply logistics structure selected. Capacity calculation was based on the annual output of alternative vehicles and machines (Table 1). Capacity values were gathered from earlier studies (Kart-tunen et al., 2008; Enström, 2008; Ranta & Rinne, 2006; Ry-ymin et al., 2008).
Results
[image:5.595.57.289.411.703.2]Table 1.
Annual capacity of vehicles and chippers.
Vehicle/Chipper m3/a
Trucks
Logging residues 21,200
Stumps 23,600
Energy wood 21,200
Forest chips 26,800
Train 160,000 Barge 245,000 Mobile chipper
Logging residues at roadside 46,700
Stumps at terminal 80,800
Energy wood at terminal 92,300
F ue l f ra ction’ s pr opor ti on of tota l su pply vo lu m e
Total supply of forest fuels, GWh Logging residue Stumps 0 0% 20% 40% 60% 80% 100%
Demand point A
Small diameter wood w/subsidies Other small diameter wood
limited to below 300 km when defined as a direct truck trans- port distance and less than 80 km when defined as a pre-hauling distance to supply terminals. Therefore, the maximum availabi- lity was 4.5 TWh to the selected site. In particular, the market share and forest-owners’ willingness to sell limited the total biomass potential to one fourth of the original free techno-eco- nomical potential. Local competition, taken into account to deter- mine the free techno-economical potential, decreased availabil- ity particularly in eastern Finland.
The average supply costs were used in the figures, while with marginal costs the shape would have been an exponential growth curve. The average supply cost increased steadily at around 2 TWh, which was the targeted supply volume for the plant, cor- responding to approx. 1 million·solid·m3. The average supply
cost was 17 €/MWh for a 2 TWh supply. One source of supply cost variation was the biomass source. The cheapest was log-ging residues (16 €/MWh), ahead of stumps (17.5 €/MWh), and the most expensive was small diameter energy wood (21 €/MWh), regardless of the production subsidies. Production subsidies de- creased the costs of small-diameter energy wood supply by 5.2 €/MWh and made these sites one potential energy source. It was assumed that 25% of energy wood sites were subsidised. Without subsidies, the energy wood fraction would be too expensive. The reason for lower availability of stump biomass was stricter col- lection site selection rules and less willingness of forest-owners to sell them.
Logging residues accounted for the majority of supply vol-umes, approx. 70% of 2 TWh supply, and decreased slowly after this. Stumps accounted for approx. 20% and subsidised energy wood roughly 10% (Figure 8). Unsubsidised energy wood be- came an option until the volume surpassed 2.5 TWh and the sup- ply cost more than 20 €/MWh. Truck transport vehicles domi-nated the transportation, at approx. 70% for 2 TWh supply, and decreased with larger volumes, to 60% (Figure 9). The selected site did not have any waterway option.
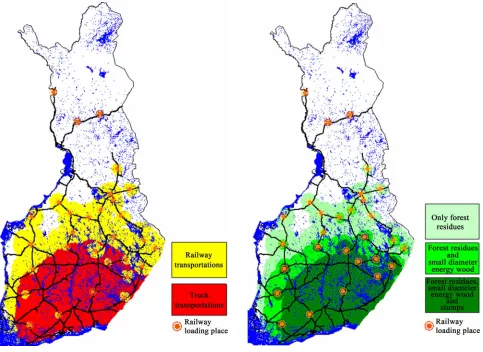
The map illustrations showed the aerial supply solution, where direct deliveries and delivery via railways terminals take place, and on which raw-material sources these deliveries were based. Direct truck loads were delivered at a transport distance of less than 300 km, and the railway option was possible outside that area, except for small areas surrounding terminals (Figure 10). All biomass sources were transported by truck, but for longer
Figure 8.
The shares of alternative biomass sources as a function of total biomass availability (label rank the same as the line rank in the figure).
T ra ns port m ode ’s s ha re o f t ot al s uppl y GWh truck transportation
intermodal (truck + train/vessel 0 0% 20% 40% 60% 80% 100%
Demand point A
[image:6.595.56.286.109.283.2])
Figure 9.
The share of transport modes as a function of the total biomass avail-ability (label rank the same as the line rank in the figure).
distances only energy wood and finally logging residues were viable option. Stumps were too costly an option for railway trans- portation.
The vehicle needs for supply of 2 TWh biomass were esti- mated. In this case, the forest chip trucks and mobile chippers were needed because of the large number of direct deliveries from the roadside. The need for units of other transport modes was marginal (Table 2). To increase the supply from this level will require, in particular, trucks for uncomminuted biomass and mobile chippers for logging residues and energy wood.
Discussion
The results of biomass availability and supply cost studies are typically very site-dependent, because of the variation in biomass resources, geography, and transport infrastructure. In particular, end-user sites near coastal or border areas have been ranked as poorer sites in comparison to inland sites in this respect (Ranta, 2005). However, long-distance transport with terminal logistics will level off their difference when biomass is also transported
[image:6.595.309.536.302.487.2]Figure 10.
Map illustrating transport mode selection (left side red for trucks and yellow for railway) and biomass raw-material options (right side, dark green for all fractions, middle green without stumps and light green only logging residues ) for 2 TWh supply.
Table 2.
Vehicle needs assuming a supply of 2 TWh.
Vehicle Units
Truck (uncomminuted biomass) 9
Truck (forest chips) 22
Train (20 wagons) 2
Barge 0 Mobile chippers (logging residues, energy wood) 16
Mobile crushers (stumps) 2
outside the typical procurement area, in which solely truck trans- portation is used. Coastal sites with their own harbours also have better possibilities for import of a large variety of biomass streams from abroad via large seagoing vessels.
This study shows that the biomass need of a biorefinery is so great that procurement areas must be extended beyond the nor- mal supply area handled with trucks. Typically, truck transport is a suitable option for less than 100 km, because of a rapid in- crease in transport costs (Ranta & Rinne, 2006). However, they are still the cheapest transport option for longer distances, with the cost parameters used in this study. The transport costs in-
[image:7.595.54.288.498.611.2]crease to a lesser extent with other transport modes (cf. Figure 7), but the extra stage of pre-hauling to the terminal increases the supply costs with terminals above those of direct transport. However, terminal handling costs form a rather minor cost com- ponent, because of efficient material handling machines (cf. Fi-
gure 10). If the biorefinery will be somewhere in eastern or cen-
tral Finland, the variation in biomass availability and supply cost will be minor, because of the need for a large procurement area. The greater the biomass need, the less the variation in bio- mass availability and supply costs, since almost the whole country will be a potential supply area. Only sites in the north-western and northern part of the country will have a poorer supply si- tuation, especially because of scarcity of logging residues and stumps in that area. Particularly important is a site’s location in relation to transport networks, where there should be easy access in all directions, as for a transport node or inland logistics hub.
is the capacity and characteristics of the storage area. Terminals act also as buffer storage; therefore, enough space is needed for both uncomminuted and comminuted biomass, as is stable ground (asphalted concrete), for chipping machines and trucks. Ease of access and short distance between storage and loading track are a self-evident need. For biorefineries, buffer storage capability is particularly essential for maintaining even supply year-round. From forest sites only via direct deliveries, this would not be possible. Therefore, the result of this case study is to some ex- tent theoretical, and more biomass should be directed via termi- nal supply. The results rely solely on minimising supply costs on the basis of summing costs of supply stages and transport costs. In this case, supply security issues and availability of free vehi- cle capacity and labour were omitted. In the terminal system, there are better possibilities to increase biomass quality, by control- ling the moisture content and impurity levels. There is the pos- sibility of sieving out impurities and selecting and mixing se- parate biomass lots to homogenise deliveries. Vehicle needs (trucks and mobile chippers) will be lower for a terminal system feeding in the same amount of biomass, in comparison to de- centralised supply from forest sites to the biorefinery.
In the study, only railway transport was used via terminals, and in this way 20 truckloads were transported in one shipment. Depending on the terminal’s location (remote or in the immedi-ate vicinity), also truck transport from terminals would be an option, but it was not considered in this study. Waterway trans- port based on barges could take 30 - 40 truckloads at a time. The waterway option is viable only in the Lake Saimaa area, where the best terminal sites are existing harbours for round- wood or other commodities. These sites have the best facilities for handling biomass. The waterway deep water channel (4.35 m) reaches a rather large area in eastern Finland, but the maxi-mum transport distances will be to the line between south and north. For example, the route between harbours of Lappeenranta (southernmost) and Joensuu (northernmost on the east channel route) is 312 km and Lappeenranta and Siilinjärvi (northern-most on the western channel route) is 339 km. These distances are rather short for making waterways a competitive solution, since in most cases the practical distance will be much shorter in this area. Waterway transport will become part of a supply solution only if the biorefinery has its own harbour and is in the lake area. The Saimaa canal connects the lake to the sea, the Gulf of Finland, and also makes imports from abroad possible. The sea transport would be based on dry cargo vessels instead of the barges used in the lake area.
A common challenge with other transport modes is the un- der-utilisation of capacity, both bearing capacity and utilisation rate. The latter could be addressed with better management of logistics and the first with vehicle structure development. Both railway wagon and barge capacity could be increased by enlarge- ing the load frame. It is possible to use higher containers in rail- way wagons or extended sides in barges. Wagon frames could be increased approx. 20%, but to make multi-mode transporta- tion possible, containers should be dimensioned in view of truck logistics. Also, various compacting systems could be used, such as vacuum feed for containers and pressing the load down by running over it with heavy machines for barge loads.
A common challenge with other transport modes is the un- der-utilisation of capacity, both bearing capacity and utilisation rate. The latter could be addressed with better management of logistics and the first with vehicle structure development. Both railway wagon and barge capacity could be increased by enlarge-
ing the load frame. It is possible to use higher containers in rail- way wagons or extended sides in barges. Wagon frames could be increased approx. 20%, but to make multi-mode transporta- tion possible, containers should be dimensioned in view of truck logistics. Also, various compacting systems could be used, such as vacuum feed for containers and pressing the load down by running over it with heavy machines for barge loads.
So far, no biorefinery investment has been decided on in Fin- land. The first site’s location will have a major effect on the site decision for other potential sites, because of the tighter compe- tition for biomass in the proximity of the biorefinery. Also, other biomass sources may come into play, such as pulpwood, short- rotation forestry, and agro biomass. At the moment, these are more expensive sources, but if there arises a shortage of bio- mass, other sources will be mobilised. Peat would be an abun-dant source of biomass, especially in the northern part of the country, but biofuel produced from it would not have an RES label and Finland will not be able to count it toward the com- mitment set for RES fuel in the traffic sector.
REFERENCES
Anttila, P., Korhonen, K. T., & Asikainen, A. (2009). Forest energy potential of small trees from young stands in Finland. In M. Savolainen (Ed.), Bioenergy 2009. Sustainable bioenergy business. 4th international bioenergy conference from 31st August to 4th Sep-tember 2009 (pp. 221-226). Jyväskylä: FINBIO Publications. Enström, J. (2008). Efficient handling of wood fuel within the railway
system. In K. Suadicani, & B. Talbot (Eds.), The Nordic-Baltic con-ference on Forest operations (pp. 53-55), Copenhagen, 23-25 Sep-tember 2008. Forest and Landscape Working Papers (30/2008). Karttunen, K., Jäppinen, E., Väätäinen, K., & Ranta, T. (2008).
Metsäpolttoaineiden vesitiekuljetus proomukalustolla. Waterway transportation of forest fuels by barges. (abstract). Lappeenranta University of Technology. LUT Energy. Final Report. EN B-177. Korpinen, O.-J., Karttunen, K., Ranta, T., & Jäppinen, E. (2008).
Inte-gration of railroads and waterways with forest fuel logistics in Finland. In K. Suadicani, & B. Talbot, (Eds.), The Nordic-Baltic Conference on Forest Operations (pp. 65-67). Copenhagen, 35-25 September 2008. Forest and Landscape Working Papers (30/2008). Laitila, J., Asikainen, A., & Anttila, P. (2008). Energiapuuvarat. In M.
Kuusinen, & H. Ilvesniemi (Eds.), Energiapuun korjun ympäris- tövaikutukset, tutkimusraportti. Tapion ja Metlan julkaisuja, Helsinki: Metsäntutkimuslaitos and Metsätalouden kehittämiskeskus Tapio. Long-term Climate and Energy Strategy. Government Report to
Par-liament 6 November 2008. Työja elinkeinoministeriön julkaisuja, Energia ja ilmasto (36/2008).
McKeough, P., & Kurkela, E. (2008). Process evaluations and design studies in the UCG project 2004-2007. Espoo. VTT Tiedotteita, Re-search notes 2434.
Metinfo. Forest information services (2009). http://www.metla.fi/metinfo/index-en.htm
Pöyry Energy Oy (2009). Metsäbioenergian saatavuus energiantuotantoon eri markkinatilanteissa. Loppuraportti 30.4.2009. Energiateollisuusry. Ranta, T. (2005). Logging residues from regeneration fellings for
bio-fuel production—A GIS-based availability analysis in Finland. Bio-mass and Bioenergy, 28, 171-182.
doi:10.1016/j.biombioe.2004.08.010
Ranta, T., & Rinne, S. (2006). The profitability of transporting uncom-minuted raw materials in Finland. Biomass and Bioenergy, 30, 231- 237. doi:10.1016/j.biombioe.2005.11.012
Ryymin, R., Pohto, P., Laitila, J., Humala, I., Rajahonka, M., Kallio, J. et al. (2008). Metsäenergian hankinnan uudistaminen. Loppuraportti 12/2008. Statistics: Energy supply, consumption and prices [e-publication].
ISSN=1798-338X. 4th quarter 2010. Helsinki: Statistics Finland [re-ferred: 1.9.2011].
Ylitalo, E. (2011). Puun energiakäyttö 2010. Metsäntutkimuslaitos, Metsätilastotiedote (16/2011).