ISSN Online: 2161-7392 ISSN Print: 2161-7384
DOI: 10.4236/ojms.2019.91004 Jan. 25, 2019 49 Open Journal of Marine Science
Characteristics of the Fish Assemblage in the
Intertidal Salt Marsh and Mudflat of the
Yangtze Estuary
Heng Zhang
1,2,3,4, Jingyu Ye
1,2,3, Xuehui Wang
2, Shenglong Yang
11East China Sea Fisheries Research Institute, Chinese Academy of Fishery Sciences, Shanghai, China 2Key Laboratory of Open-Sea Fishery Development, Ministry of Agriculture, Guangzhou, China 3College of Marine Sciences, Shanghai Ocean University, Shanghai, China
4State Key Laboratory of Estuarine and Coastal Research, Shanghai, China
Abstract
During July 2015 to June 2016, two permanent sampling sites were estab-lished in Scirpus mariqueter salt marsh and its adjacent mudflat on the inter-tidal zone of Chongming-Dongtan in the Yangtze Estuary. Based on monthly trap net surveys of fishes, the characteristics of the fish assemblages in the different subhabitats, including the salt marsh and mudflat, and the monthly variations were analyzed. A total of 19 species of fishes were found belong to 12 Families. The characteristics including the dominant fish species were dif-ferent in these two subhabitats. 18 species of fish were recorded in the mud-flat, of which the dominant species were the Coilia ectenes, Pelteobagrus ni-tidus and Lateolabrax maculatus. Ten species of fish were recorded in the salt marsh of which the dominant species were the Coilia ectenes, Saurogobio dumerili, Liza haematocheila, Lateolabrax maculatus and Acanthogobius ommaturus. Pelteobagrus nitidus prefers to use the mudflat, while Lateola-brax maculatus and Liza haematocheila prefer to use the salt marsh. There was a significant difference in the monthly variation of fish abundance be-tween the fish abundance of salt marsh and mudflat, while there was no sig-nificant difference in fish biomass. The Simpson index of the fish of the mud-flat was significantly higher than that of the salt marsh, while the Margalef index and the Pielou index were lower than the salt marsh. The community can be divided into two groups: winter-spring (A) and summer-autumn (B). The abundance of fish in the mudflat and the salt marsh show a very signifi-cant correlation with the water temperature (r = 0.773, 0.830, respectively) and a significant correlation with the water salinity(r = 0.654, 0.648, respec-tively). The abundance of fish in mudflat and salt marsh are both significantly
How to cite this paper: Zhang, H., Ye, J.Y., Wang, X.H. and Yang, S.L. (2019) Charac-teristics of the Fish Assemblage in the In-tertidal Salt Marsh and Mudflat of the Yangtze Estuary. Open Journal of Marine Science, 9, 49-63.
https://doi.org/10.4236/ojms.2019.91004
Received: January 2, 2019 Accepted: January 22, 2019 Published: January 25, 2019
Copyright © 2019 by author(s) and Scientific Research Publishing Inc. This work is licensed under the Creative Commons Attribution International License (CC BY 4.0).
http://creativecommons.org/licenses/by/4.0/
DOI: 10.4236/ojms.2019.91004 50 Open Journal of Marine Science correlated with water temperature and salinity. The abundance of fish of the mudflat (r = 0.470, P > 0.05) is more related to the highest submerged depth than of the salt marsh (r = 0.087, P > 0.05).
Keywords
Yangtze Estuary, Intertidal Zone, Subhabitat, Fish Assemblage, Species Richness
1. Introduction
The intertidal wetland in the estuary is the area where the river runoff flows into the ocean; it has both freshwater and saltwater habitats, which results in its di-versification of topographical features and differences of habitat [1]. The differ-ent subhabitats of the intertidal wetlands in the estuary provide diverse habitat types for living organisms (such as fish, benthos and plants), the most typical of which are the mudflat, creek and salt marsh [2][3]. Many studies have shown that increasing habitat heterogeneity can enhance diversity and key functions, yet research is limited on how different subhabitats affect higher trophic levels [4][5][6][7].
The intertidal wetland in the estuary is an important habitat for fish, and the fishery productivity of the estuary is supported by the detrital food chain under the action of salt marshes [7][8]. Most of the important coastal economic fish have dependence of estuary, and some of their life history is completed in the shallow water area of estuary [8][9]. The intertidal wetland in the estuary pro-vides many food organisms and prey refuges for fish, and it is also a necessary passage for anadromous migration and seaward migration of fish [10]. In the past ten years, humans have gradually realized that the estuary intertidal wetland is the area where fish are fed as food, avoid predator and breeding offspring, and have powerful supporting function for the estuary and coastal fishery.
DOI: 10.4236/ojms.2019.91004 51 Open Journal of Marine Science composition of fish assemblages in the different subhabitats of intertidal zone of the Chongming-Dongtan wetland, and found out the fish species, abundance and biomass of the fish assemblage in the mudflat were all higher than those in the salt marsh. Based on monthly survey, authors analyzed the species composi-tion and biodiversity of fish species in intertidal salt marsh zone and mudflat of the Chongming-Dongtan wetland in the Yangtze River estuary, and discussed the value of different subhabitats for fish, thus providing a theoretical basis for protecting and scientific using of the Yangtze River estuary intertidal wetland.
2. Materials and Methods
2.1. Study Area
Study area was located at the southwest area of Chongming-Dongtan wetland that is one of the largest salt marshes in the Yangtze Estuary (namely Tuanjiesha, 31˚27'N - 31˚28'N, 121˚54'E - 121˚55'E). This area is the northern subtropical monsoon climate with an average annual temperature of 15.7˚C, the average annual precipitation is 1123.7 mm, the plant growth season is from April to No-vember. The regional tide is irregular half-day tides, and the average tidal range is 2.5 m, up to 3.5 m. The highest astronomical tide tidal range is 5.2 m. The av-erage tidal salinity is 1 - 3 [16][17].
2.2. Fish Sampling
Scirpus mariqueter salt marsh (numbered H) and its adjacent mudflat (num-bered G) on the intertidal zone of Chongming-Dongtan was surveyed monthly from July 2015 to June 2016. It was sampling twice a day, which sampling time is 12 hours. The sampling net is a long-bag ground bamboo cage net (semi-section in section), the length is 15 m, the width is 0.5 m, the height is 0.4 m, the cod-end mesh size is 8 mm, and the representative water area collected by the net is about 200 m2. The structure is particularly beneficial for the sampling of the demersal fish (such as Gobioidei) and other swimming organisms in the tertidal subhabitats, which are not easily broken by surf or wind waves in the in-tertidal zone [18]. All the fish samples were taken back to the laboratory for analysis. The excess water of the body surface was absorbed by absorbent paper, the body mass was weighed (accurate to 0.1 g), and the standard body length of each fish was recorded (the standard length, SL) is taken as the body length of the fish (accurate to 0.1 mm). The species of the fish samplings were identified by reference to the literature [19][20]. The salinity (accurate to 0.1‰) and the water temperature (accurate to 0.1˚C and the water depth of the monitoring sta-tion (accurate to 0.1 m) were measured during the day and night tide floods.
2.3. Date Analyze
DOI: 10.4236/ojms.2019.91004 52 Open Journal of Marine Science Tang et al. 2016). SPSS 17.0 was used for variance analysis and Pearson correla-tion coefficient. One-way ANOVA was used to analyze the differences in diver-sity and biomass of fish in different subhabitats. From December to February of the next year, it is winter, March to May is spring, June to August is summer, and September to November is autumn. Pearson correlation coefficient was used to analyze the correlation between monthly fish abundance and environmental factors. The correlation of fish composition in different habitats in different ha-bitats was analyzed by Bray-Curtis and non-Metric Multidimensional Scaling (nMDS) with Primer V5.0. All cluster analysis is based on the distance between the samples. The Bray-Curtis distance is the most commonly used indicator for the difference between the two communities. Most ecologists like to use this in-dicator to characterize the differences between the two communities. After the four-square root transformation of the abundance data of the corresponding species, the Bray-Curtis similarity coefficient is calculated, and then the similar-ity matrix is constructed. On this basis, hierarchical clustering and nMDS analy-sis are performed. The advantages and disadvantages of the nMDS results are measured by Stress. It is generally considered that when St << 0.2, it can be represented by the two-dimensional dot diagram of nMDS, and the graph has a certain explanatory meaning; when Stress < 0.1, it can be considered as a good arrangement, Stress < 0.05, is considered to be very representative [23]. Because of the natural complementarity of these two methods, they can be an effective tool for analyzing biotic community data, and verify the correctness of each oth-er. We also use Primer V5.0 for Similarity percentages-species contribution (SIMPER) to analyze the average contribution rate of the species to Average si-milarity within group and Average dissisi-milarity between groups.
3. Result
3.1. Survey Environment
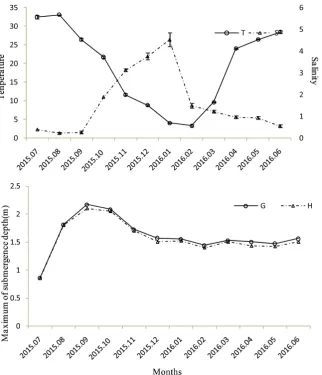
During the investigation, the water temperature showed a seasonal change (Figure 1). The water temperature gradually increased from March to August. The highest recorded temperature in August was 33.1˚C. The temperature in September-February was gradually decreased. The lowest temperature in Febru-ary was only 3.4˚C. The annual fluctuation of salinity is relatively small, and the salinity is lower than 1 in May to September, and the salinity is gradually in-creased from autumn to winter (Figure 1). The highest value in January is 4.5. There was no significant difference in the maximum of submerged depth be-tween the mudflat and the salt marsh (T test, P > 0.05). The maximum of sub-merged depth of the two habitats was the lowest in July, and it was relatively high from August to November.
3.2. Species Composition and Diversity
DOI: 10.4236/ojms.2019.91004 53 Open Journal of Marine Science
Figure 1. Monthly changes of the water temperature, salinity and maximum of
submer-gence depth in 2 subhabitats (T, Temperature; S, Salinity; G, the Mudflat; H, the Salt marsh).
Gobiidae (4 species) were the most, Mugilidae (2 species) came second, and the other families have only one species. There are significant differences in fish as-semblages and dominant species in the intertidal salt marsh zone and adjacent mudflat. A total of 18 species of fish were recorded in the mudflat, belonging to 12 families. The dominant species were Pelteobagrus nitidus, Lateolabrax macu-latus and Coilia ectenes. A total of 10 species of fish were recorded in the salt marsh zone, belonging to 6 families. The dominant species were Lateolabrax maculatus, Liza haematocheila, Acanthogobius ommaturus, Coilia ectenes and Saurogobio dumerili. The proportion of fish species in the mudflat and salt marsh is 9:5. Except for Periophthalmus magnuspinnatus, all fish species in the salt marsh are recorded in the mudflat.
DOI: 10.4236/ojms.2019.91004 54 Open Journal of Marine Science
Table 1. Season changes of abundance and species of fish (G, the Mudflat; H, the Salt
marsh, Y, Berger-parker index).
Species Spring Summer Autumn Winter Y G H G H G H G H G H Fish
Engraulidae
Coilia ectenes 1 1 73 13 2 1 0.021 0.027 Anguillidae
Anguilla japonica 1 1 <0.001 <0.001 Cyprinidae
Hemiculter bleeleri 1 <0.001
Pseudolaubuca engraulis 1 5 <0.001 0.011 Saurogobio dumerili 1 7 17 9 5 0.017 0.021 Carassius auratus 1 1 1 2 2 0.001 0.007
Bagridae
Pelteobagrus nitidus 86 7 7 0.085 Mugilidae
Liza haematocheila 1 10 5 7 3 3 1 2 0.007 0.107 Liza affinis 1 4 1 1 <0.001 0.011 Polynemidae
Eleutheronema
tetradactylum 1 <0.001
Serranidae
Lateolabrax maculatus 2 10 29 32 2 2 1 0.034 0.137 Gobiidae
Acanthogobius
ommaturus 14 12 4 7 0.013 0.051 Periophthalmus
magnuspinnatus 3 0.002
Boleophthalmus
pectinirostris 2 1 1 1 <0.001 Scartelaos histophorus 2 <0.001
Cynoglossidae
Cynoglossus gracilis 1 1 3 0.004 Tetraodontidae
Takifugu obscurus 2 <0.001
Hemiramphidae Hyporhamphus
intermedius 1 <0.001
Salangidae
Salanx ariakensis 1 <0.001
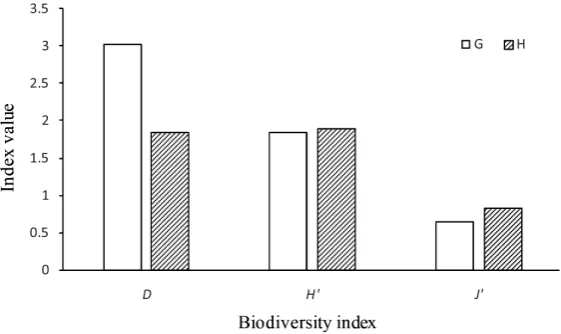
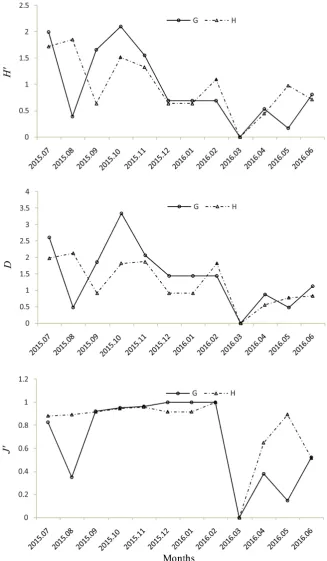
DOI: 10.4236/ojms.2019.91004 55 Open Journal of Marine Science 10 species in summer and 7 species in autumn. Generally speaking, the Simpson index (Figure 2) of the fish assemblage the mudflat was significantly higher than that in the salt marsh, while the Margalef index and the Pielou index of the fish assemblage in the salt marsh were higher than those in the mudflat. There are significant inter-monthly changes in fish assemblage biodiversity index in two subhabitats. As we can see from Figure 3, the Shannon-Wiener index and Simpson index of the fish assemblage in the mudflat are higher than that of the salt marsh, but there is no corresponding relation.
3.3. Abundance and Biomass Monthly Variation
In terms of monthly changes in fish abundance, from December to March, the fish abundance in the mudflat and the salt marsh was less than 5 (Figure 4). The highest abundance of fish in the mudflat was in September, at 224. The highest abundance of fish in the salt marsh occurred in August, at 47, which is about 1/5 of the abundance of fish in the mudflat. There was significant difference in fish abundance between the two sub-habitats (ANOVA, P < 0.05). In terms of fish biomass, the biomass of the fish in the mudflat is small fluctuation, while the fluctuation of the salt marsh is larger (Figure 5). From December to March, fish biomass in the mudflat and the salt marsh were lower continuously. The highest abundance of fish in the mudflat was in May, which was 605.2 g. The highest abundance of fish in the salt marsh was in April, which was 638.6 g. There was no significant difference in fish biomass between the two sub-habitats (ANOVA, P > 0.05).
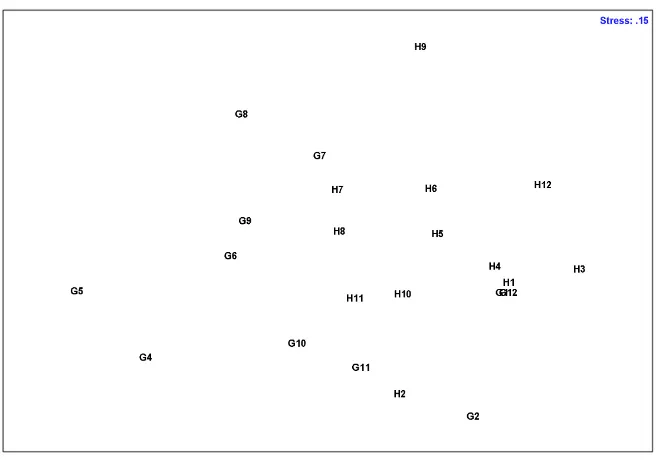
[image:7.595.235.516.527.694.2]There are some differences between the Bray-Curtis similarity cluster (Figure 6) and the nMDS (Figure 7) (Stress = 0.14, with certain reference value) of monthly fish abundance in different subhabitats. Because there is no fish was recorded in the mudflat in January, so we have to remove the date of it when performing nMDS. Can be seen from Bray-Curtis similarity cluster, in addition to the fish of the salt marsh in October and the fish of the mudflat in March, the
Figure 2. Biodiversity of fish in two subhabitats (G, the Mudflat; H, the Salt
DOI: 10.4236/ojms.2019.91004 56 Open Journal of Marine Science
Figure 3. Biodiversity monthly change of fish assemblage in two subhabitats.
DOI: 10.4236/ojms.2019.91004 57 Open Journal of Marine Science
Figure 4. Monthly changes of fish abundance in two subhabitats (G, the Mudflat; H, the
Salt marsh).
Figure 5. Monthly changes of fish biomass in two subhabitats (G, the Mudflat; H, the Salt
marsh).
abundance in April-October of the mudflat and fish abundance in July-August of the salt marsh, group B) two groups. The nMDS shows that the similarity of fish in the salt marsh is higher in each month, while that in the mudflat is lower.
[image:9.595.208.540.307.494.2]DOI: 10.4236/ojms.2019.91004 58 Open Journal of Marine Science
Figure 6. Bray-Curtis similarity cluster on abundance of fish in two subhabitats (G1-G12,
Monthly fish abundance of the mudflat; H1-H12, Monthly fish abundance of the salt marsh).
Figure 7. nMDS on abundance of fish in two subhabitats (G1-2 and G4-G12, Monthly
fish abundance of the mudflat; H1-H12, Monthly fish abundance of the salt marsh).
3.4. Analysis of the Factors Affecting
[image:10.595.209.539.331.561.2]DOI: 10.4236/ojms.2019.91004 59 Open Journal of Marine Science
Table 2. Fish species which contributed >90% accumulative similarity within a group and
dissimilarity between group A and B.
Species A (33.09) B (22.13) A-B (86.64) AS C% AS C% AD C% Pelteobagrus nitidus 5.7 25.74 23.86 27.54
Coilia ectenes 4.59 20.75 17.28 19.95 Lateolabrax maculatus 8.28 25.04 2.16 9.78 12.59 14.54 Saurogobio dumerili 4.66 21.08 9.71 11.21 Acanthogobius ommaturus 2.30 10.40 7.06 8.14
Liza haematocheila 20.43 62.41 1.04 4.68 4.33 5.00
Pseudolaubuca engraulis 2.29 2.64
Cynoglossus gracilis 1.78 2.05
Carassius auratus 2.74 8.30
AS: Average similarity within group; AD: Average dissimilarity between groups; C: Contribution of similar-ity within group and dissimilarsimilar-ity between groups by fish species.
Table 3. Pearson Correlation Coefficient between abundance and environment factor.
Species Environmental factor
T S MH
G 0.773** 0.654* 0.470
H 0.830** 0.648* 0.087
T: Temperature; S: Salinity; MH: Maximum of submergence depth; *P < 0.05; **P < 0.01
4. Discussion
[image:11.595.207.540.344.413.2]DOI: 10.4236/ojms.2019.91004 60 Open Journal of Marine Science on the Mediterranean coast was higher in the distribution of salt marsh than in other habitats, but the abundance of juvenile fish was similar in different habi-tats. This study also found that the dominance (Y) of Pelteobagrus nitidus in the mudflat reached 0.085, but it was not recorded in the salt marsh; the dominance of Lateolabrax maculatus in the salt marsh reached 0.137, and that in the mud-flats was 0.034.
In terms of monthly changes in fish assemblages, some studies have shown that fish abundance in the Yangtze River estuary has obvious seasonal variation characteristics, and the species and abundance of fish in winter are the lowest, with the increase of spring water temperature and fish abundance, and those are higher in Summer [27][28]. Studies have shown that seasonal changes in inter-tidal fish assemblages can be divided into three community types in winter, spring-summer and autumn [27]. Another study showed the intertidal fish community can be divided into three community types in spring-summer-autumn and winter [29]. The study found that the densities of fish in these two subhabi-tats were extremely low during the end of winter to the beginning of spring, and then increased with the water temperature. The abundance of fish in these two subhabitats reached the highest in August and September respectively. The community can be divided into two groups: winter-spring (A) and sum-mer-autumn (B). The species that cause differences in fish communities between groups A and B are mainly Coilia ectenes, Lateolabrax maculatus, Acanthogo-bius ommaturus, Saurogobio dumerili, Liza haematocheila, Pelteobagrus nitidus and Carassius auratus. These fish are mainly ecological groups such as estuarine brackish water species, estuarine transitional species and marine fish. Juveniles of most species enter the estuarine intertidal wetlands seasonally or temporarily for feeding or hiding [27] [30]. This suggests that seasonal changes of fish as-semblages are related to the composition.
DOI: 10.4236/ojms.2019.91004 61 Open Journal of Marine Science 0.470) is higher than that of the salt marsh (r = 0.087), which may indicate that when the water depth of the mudflat is higher, it can provide better condition for feeding and hiding, then increasing the abundance of fish.
Acknowledgements
We thank the World Wide Fund for Nature for permission to do research work in protected areas under their jurisdiction. This study was financially supported by the Open Fund of the State Key Laboratory of Estuarine and Coastal Research (SKLEC-KF201805), the National Natural Science Foundation of Shanghai (18ZR1449800), the Fundamental Research Funds for the Central Universities (2015M07) and Open Fund of the Key Laboratory of Offshore Fisheries Devel-opment, Ministry of Agriculture (LOF 2018-01). And we would not have been done without the help from many people.
Conflicts of Interest
The authors declare no conflicts of interest regarding the publication of this pa-per.
References
[1] Whitcraft, C.R. and Levin, A. (2007) Regulation of Benthic Algal and Animal Communities by Salt Marsh Plants: Impact of Shading. Ecology,88, 904-917.
https://doi.org/10.1890/05-2074
[2] Lu, J.J. (2006) Wetland Ecology. Higher Education Press, Beijing.
[3] Yuan, X.Z., Lu, J.J. and Liu, H. (2002) Distribution Pattern and Variation in the Functional Groups of Zoobenthos in the Changjiang Estuary. Acta Ecological Sinca, 22, 2054-2062. (In Chinese)
[4] Laikin, D.J., Madon, S.P., West, M.J. and Joy, B.Z. (2008) Topographic Heterogene-ity Influences Fish Use of an Experimentally Restored Tidal Marsh. Ecological Ap-plications, 18, 483-496.https://doi.org/10.1890/06-1984.1
[5] Gratwicke, B. and Speight, M.R. (2005) The Relationship between Fish Species Richness, Abundance and Habitat Complexity in a Range of Shallow Tropical Ma-rine Habitats. Journal of Fish Biology, 66, 650-667.
https://doi.org/10.1111/j.0022-1112.2005.00629.x
[6] Green, B.C., Smith, D.J. and Graham, J.C.U. (2012) Habitat Connectivity and Spa-tial Complexity DifferenSpa-tially Affect Mangrove and Salt Marsh Fish Assemblages.
Marine Ecology Progress Series, 466, 177-192.https://doi.org/10.3354/meps09791
[7] Able, K.W., Nemerson, D.M. and Grothues, T.M. (2004) Evaluating Salt Marsh Restoration in Delaware Bay: Analysis of Fish Response at Former Salt Hay Farms.
Estuaries,27, 58-59.https://doi.org/10.1007/BF02803560
[8] Peterson, G.W. and Turner, R.E. (1994) The Value of Salt Marsh Edge vs Interior as a Habitat for Fish and Decapod Crustaceans in a Louisiana Tidal Marsh. Estuaries, 17, 235-262.https://doi.org/10.2307/1352573
[9] Quan, W.M., Ni, Y., Shi, L.Y. and Chen, Y.Q. (2009) Utilization of Tidal Creek Ha-bitat by the Nektons in a Newly Formed Salt Marsh at Yangtze River Estuary. Chi-nese Journal of Ecology, 28, 560-564. (In Chinese)
DOI: 10.4236/ojms.2019.91004 62 Open Journal of Marine Science
(2012) Fish Community Structure in Intertidal Area of Acipenser sinensis Natural Reserve in Yangtze River Estuary. Journal of Ecology, 31, 1194-1201. (In Chinese) [11] Tong, C.F. (2012) Characteristics of the Fish Assemblages in the Intertidal Salt
Marsh Zone and Adjacent Mudflat in the Yangtze Estuary. Acta Ecological Sinca, 32, 6501-6510. (In Chinese)
[12] Jin, B.-S. (2010) Temporal and Spatial Distribution Patterns of Fish Diversity in Salt Marsh Creeks of the Yangtze River Estuary. Ph.D. Thesis, Fudan University, Shanghai. (In Chinese)
[13] Zhang, H., He, W., Tong, C.F. and Lu, J.J. (2007) Species Composition and Diversi-ty of Fishes in Winter Tidal Flats of Chongxi Wetland. Resources and Environment in the Yangtze Basin, 16, 308-313. (In Chinese)
[14] Zhang, H. and Yang, S.L. (2012) Changes of Community Structure of Fish Eggs and Larvae in the Yangtze River Estuary Wetland. Chinese Society for Oceanology and Limnology Fish Credit Union, China Zoological Society Fish Credit Union 2012
Academic Symposium, Lanzhou, 1 September 2012, 69. (In Chinese)
[15] Zhang, H. and Zhu, G.P. (2009) Spatiotemporal Changes of Fish Community in Yangtze Estuary Intertidal Zone. Chinese Journal of Appied Ecology, 20, 2519-2526. (In Chinese)
[16] Yuan, X.Z., Lu, J.J. and Liu, H. (2002) Distribution Pattern and Variation in the Functional Groups of Zoobenthos in the Changjiang Estuary. Acta Ecological Sinca, 10, 2054-2062. (In Chinese)
[17] Yang, S.L., Li, H., Ysebaert, T., Bouma, T.J., Zhang, W.X., Wang, X.Y., Li, P., Li, M. and Ding, P.X. (2008) Spatial and Temporal Variations in Sediment Grain Size in Tidal Wetlands, Yangtze Delta: On the Role of Physical and Biotic Controls. Estua-rine, Coastal and Shelf Science, 77, 657-671.
https://doi.org/10.1016/j.ecss.2007.10.024
[18] Jin, B.S., Fu, C.Z., Zhong, J.S., Li, B. Chen, J.K. and Wu, J.H. (2007) Fish Utilization of a Salt Marsh Intertidal Creek in the Yangtze River Estuary, China. Estuarine,
Coastal and Shelf Science, 73, 844-852. (In Chinese)
https://doi.org/10.1016/j.ecss.2007.03.025
[19] Ni, Y. and Wu, H.L. (2006) Fishes in the Jiangsu Province. China Agriculture Press, Beijing. (In Chinese)
[20] Zhuang, P., Wang, Y.H., Li, S.F., Deng, S.M., Li, C.S. and Ni, Y. (2006) Fishery of the Yangtze Estuary. Shanghai Science and Technology Press, Shanghai. (In Chi-nese)
[21] Fisher, R.A., Corbet, A.S. and Williams, C.B. (1946) The Relation between the Number of Species and the Number of Individuals in a Random Sample of Animal Population. Journal of Animal Ecology, 12, 42-58.https://doi.org/10.2307/1411
[22] Hurlbert, S.H. (1971) The Nonconcept of Species Diversity: A Critique and Alterna-tive Parameters. Ecology, 52, 577-586.https://doi.org/10.2307/1934145
[23] Zhang, H., Ye, J.Y., Liang, X.L., Zhu, X.J., Jin, S.F., Chen, Y.G,, Zhang, J.R. and Dai, Y. (2017) Monthly Changes in the Benthic Macro-Invertebrate Community Struc-ture in the Habitats of Phragmi tesaustralis Marsh in the Dongtan Wetland of the Yangtze River Estuary. Chinese Journal of Applied Ecology, 28, 1360-1369. (In Chinese)
DOI: 10.4236/ojms.2019.91004 63 Open Journal of Marine Science
[25] França, S., Costa, M.J. and Cabral, H.N. (2009) Assessing Habitat Specific Fish As-semblages in Estuaries along the Portuguese Coast. Estuarine, Coastal and Shelf Science, 83, 1-12.https://doi.org/10.1016/j.ecss.2009.03.013
[26] Carles, A., Quim, P.R. and Emili, G.B. (2008) Use of a Flooded Salt Marsh Habitat by an Endangered Cyprinodontid Fish (Aphanius iberus). Hydrobiologia, 600, 177-185.https://doi.org/10.1007/s10750-007-9230-y
[27] Zhang, H. and Zhu, G.P. (2009) Spatiotemporal Changes of Fish Community in Yangtze Estuary Intertidal Zone. Chinese Journal of Applied Ecology, 20, 2519-2526. (In Chinese)
[28] Zhang, H., Yang, S.L., Zhang, S.M., Kang, W., Wu, Z.L., Quan, W.M. and Wan, C. (2016) Seasonal Variation of Species Composition and Abundance of Fish Com-munities in the Northeastern Waters of Dongtan Wetland, Changjiang Estuary.
Marine Fisheries, 38, 374-381.
[29] Zhang, H., He, W.S., Tong, C.F. and Lu, J.J. (2008) Seasonal and Semi-Lunar Changes in Fish Community Structure in Low Salinity Intertidal Area of Yangtze Estuary. Chinese Journal of Applied Ecology, 19, 1110-1116. (In Chinese)
[30] Laffaille, P., Feunteun, E. and Lefeuvre, J.C. (2000) Composition of Fish Communi-ties in a European Macrotidal Salt Marsh (the Mont Saint-Michel Bay, cFrance) Es-tuarine. Coastal and Shelf Science, 51, 429-438.