Passive Sampling of Ambient Nitrogen Dioxide Using Local
Tubes
Rejina Maskey Byanju1,2*, Mohan Bikram Gewali2, Krishna Manandhar2
1Central Department of Environmental Science, Tribhuvan University, Kathmandu, Nepal; 2Central Department of Chemistry,
Trib-huvan University, Kathmandu, Nepal.
Email: *[email protected], [email protected]
Received December 1st, 2011; revised January 1st, 2012; accepted February 2nd, 2012
ABSTRACT
Traditional active and automated sampling of nitrogen dioxide (NO2) monitoring techniques require expensive instru-mentation which is not easily adapted for large scale monitoring by resource limited countries. This paper presents the use of locally available relatively cheaper polyethylene tubes to be developed as passive diffusive sampler and use for monitoring of ambient nitrogen dioxide using Triethanolamine (TEA) as absorbent. After extraction with double dis- tilled water, modified Griese-Saltzmann method is used for analysis of nitrite adduct formed due to reaction of NO2 with TEA using spectrophotometer. The results are compared with Ferm-Badge type passive samplers from IVL-Swe- den and high volume sampling methods. The detection limits of the passive sampling methods were found to be suitable to be use in tested environment and precision of the method as expressed as Coefficient of variation are good enough for monitoring of NO2 in ambient air of Kathmandu. The method shows strong correlation with high volume sampler and no significant difference with Ferm-Badge—IVL samplers at p = 0.05.
Keywords: Nitrogen Dioxide; Passive Sampler; Diffusive Sampling
1. Introduction
Nitrogen dioxide (NO2) is one of the ubiquitous pollu- tants found in the ambient air which exhibit documented adverse effects on health and welfare [1]. While standard NO2 monitoring techniques require expensive instrumen- tation, diffusive samplers, also called passive samplers, are light weight, inexpensive and do not need mainte- nance, on-site power and pumping [1,2].
Therefore passive samplers which offer a simple, cost- effective means of measuring air pollutants have been performed for the monitoring of ambient NO2 level worldwide [3-5]. The simplest diffusion sampler is the tube-type sampler first introduced by Palmes et al. [2]
These earlier tubes use triethanolamine (TEA) as absorber. With the time several different types of passive samplers been developed using different absorbers. Noticeably, at present at least five reasonably well developed passive sampling methods for determination of NO2 is in use. They are Palmes tube; the Yanagisawa and Nishimura method, [6] the modified Amaya-Sugira method [7-10]; the Cadoff and Hodgeson method [11]; the Lewis and Mulik method [12], and the Ferm method [13].
Passive samplers are generally designed either in a tube- type configuration with one end open (so-called “Palmes
tubes”); or in a shorter badge-type configuration, where the open end is protected by a membrane filter or other wind screen. In either case, the closed end contains an absorber for the gaseous species to be monitored. Several different types of commercial diffusion tubes are there in market in recent time. These includes: Ivl-Sweden, Gradko, UK; Rediolle, Italy; Ogawa, Japan etc. All of these sam- plers were developed basically from above mentioned two types of diffusion tubes and available in the different cost rate according to manufacturer. For example, Gradko tubes cost $10 per sampler while Rediolle from Italy cost Euro 30 per sampler. Thus, these commercially available passive samplers are still costly for a developing country like Nepal. Hence it is in pertinent to have a sampler which is affordable and logistically feasible to be sam- pled and analyzed in our environment. In this line we describe here such an attempt to use locally available polyethylene tubes with triethanolamine coated filter pa- per to be used as NO2 sampler and ambient monitoring of the same.
Operating principle of Passive samplers
The basic principle on which diffusion tube samplers operate is that of molecular diffusion, with molecules of a gas diffusing from a region of high concentration (open end of the sampler) to a region of low concentration (ab-sorber end of the sampler). The movement of molecules
of gas (1) through gas (2) is governed by Fick’s law, which states that the flux is proportional to the concen-tration gradient:
J D12 dc/dz (1) where, J the flux of gas (1) through gas (2) across unit area in the z direction (g·m–2·s–1);
c the ambient ozone concentration (g·m–3); z the length of the diffusion path (m);
D12 the molecular diffusion coefficient of gas (1)in gas (2) (m2·s–1).
For a cylinder of cross-sectional area a (m2) and length L (m) then Q (g), the quantity of gas transferred along the tube in t seconds (taken as the quantity of gas ab-sorbed during t) is given by:
12 1 0
Q D C C at /L (2)
where, C0 and C1 and are the gas concentrations at either end of the tube.
In a diffusion tube, the concentration of gas (1) is maintained at zero by an efficient absorber at one end of the tube (i.e. C0 iszero) and the concentration C1 is the average concentration of the gas (1) at the open end of the tube over the period of exposure. Hence:
C Ql/D12 at (3) The diffusion coefficient for the gas to be monitored must be determined, or obtained from the literature. The area and length of the tube are determined by measure-ment.
The sampling rate (SR) of passive samplers can be calculated using the formula:
SR D12 a/L (4) Then they were expressed as ml of air sampled per second. This makes it possible to compare directly pling rates of passive samplers with those of active sam-plers [14,15].
2. Materials and Method
2.1. Description of the Study Area
Kathmandu Valley—the capital of Nepal is located be- tween 27˚37'30"N and 27˚45'0"N latitude and 85˚15'0"E and 85˚22'30"E longitude. It lies between the Himalayas in the North and the Mahabharata range in the South. The valley lies at an altitude of 1300 m·msl and is surrounded by a high mountain range (above 2000 m). The valley has a sub-tropical, temperate climate. The valley receives 80% of its annual rainfall during the summer monsoon
i.e. June through mid-September. The ambient air tem-
perature may increase up to 35˚C during hot summer days and may decrease up to −1˚C during cold winter months [16]. The relative humidity reaches more than 80% during the rainy season but decreases to less than
50% during the dry season. The major part of the winds blowing in the valley is southwesterly [17]. Wind speed lies in the range of 0.5 - 7.5 m/s.
In recent years, due to migration and urbanization ac-companied by increase in population, vehicles and indus-tries, air pollution became a known environmental prob-lem posing a threat to health and well being among the inhabitants especially in its urban centers. Kathmandu valley, is one of the major urban centers of the country, facing such a problem of air pollution [18,19]. The level of atmospheric pollution in the city has in close been compared to that of other industrialized city of the Asia such asCalcutta, Bombay, Delhi, Sanghai etc. [20]. Trans- port sector is one of the major contributors of air pollu- tion in Kathmandu. Due to its typical bowl shaped to- pography, restricting wind movement together with an- thropogenic activities, NO2 along with other major pol- lutants such asSO2, TSP, PM10, PM2.5, CO, CO2 are in increasing trend.
With the establishment of six Ambient Air Quality Monitoring stations at different locations of Kathmandu valley in 2002, under MOPE (then Ministry of Popula- tion and Environment now MOEST, Ministry of Envi- ronment) started to gather the air pollution data. Since then TSP, PM10, NO2, SO2, CO, Benzene has being monitoring. The National threshold limits for these pol-lutants also being set up. According to the latest moni-toring result TSP, PM10 and PM2.5 has been exceeded the NAAQS value except in monsoon season while NO2, SO2, CO, HCs are in higher for roadside stations than the NAAQS for the Kathmandu valley [21]. However, due to power failure and other constraints these monitoring sta- tions are continuously disturbed. Furthermore, the moni- toring data are not yet been precisely used in assessment and air quality management planning within the country.
2.2. Methods
2.2.1. Diffusion Sampler Preparation
Polyethylene tubes of 5 cm long with 1.2 cm cross sec-tion with one end open from local supplier were used for sampling. Filter paper (GF/A) cut into the circular equal to the inner cross section of the tube dipped into double distilled (dd) water for 24 hr followed by air drying was placed into the closed end of the tube. TEA water was fed in each diffusion tube as trapping solution on GF/A filter paper used as absorbent base.
2.2.2. Exposure of Diffusion Tubes
exposed at five sites in the first exposure and three addi- tional sites were used for second exposure. Figure 1 and Table 1 show the information about the sampling sites.
Total of 104 samplers were exposed in second cam-paign.
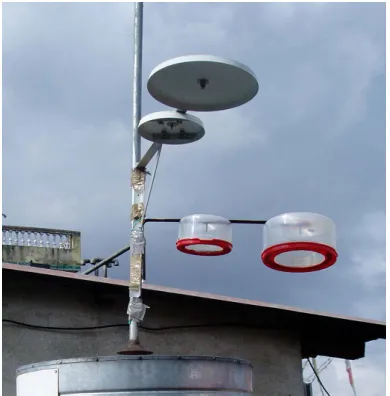
Recommendations from previous researches had been considered for the exposures such as, Installation of blanks, storage of samplers in a refrigerator [25]. The samplers were exposed in vertically inverted position with the open end downwards inside shields to protect them from wind, sunlight, rain, and draught [26-28]. Plastic boxes were fixed with net as shield for diffusion tube sampler holder for exposure (Figure 2).
Except site one, at the rest of the sites diffusive sam- plers from IVL, Sweden were co exposed. IVL, diffusive samplers for several gases have been developed and de- scribed in the literature [3,5,23]. The IVL samplers are of badge type, 10 mm long and 20 mm internal diameter. A membrane is mounted at the inlet to prevent them from wind-induced turbulent diffusion. The membrane is pro- tected from mechanical damage by a stainless steel mesh. The samplers are normally mounted under a metal disc (rain shield) attached to an aluminum arm. The measur- ing range for NO2 (bi-monthly sampling is about 0.05 to 50 μg·m–3. The NO
2 samplers have been compared to active sampling within a routine network have been de- scribed in literature [3].These samplers have been used for the measure of NO2 and other gases in Asia, Africa and South America as well [24]. The IVL samplers were mailed back to IVL, Sweden where they were analyzed using ion chromatography.
2.2.3. Sample Extraction and Analysis
To the diffusion tubes collected after exposure of pre- scribed time period weeks, NO2 was extracted adding 1 ml of double distilled (dd) water. The tube was left for 15 minutes for extraction of all the 2 present on the fil-
ter paper, and the tube was closed. Standard nitrite solu- tion and Extracted samples were analyzed for nitrite us- ing Modified Griess-Saltzman method spectrophotomet- rically at 540 nm [2,14,12,15].
NO
All the chemicals used were of analytic grade. At site one active sampling for NO2 was carried out
using High Volume sampler from Enviro tech, during the
exposure of developed diffusive tube. 2.3. Comparison between Absorbents
2.3.1. 20%, 30% and 50% v/v Aqueous TEA
Total of 60 samplers were exposed at five sites on first exposure for four weeks on October, 07 to November, 07. Second exposure (dry season) was carried out during February-March, 2008 with the improvement in sampler preparation based upon the result from first exposure analysis.
[image:3.595.108.489.461.715.2]Five sets of triplicates of three different absorbent con- centrations; 20% v/v TEA-H2O; 30% TEA-H2O and 50% TEA-H2O, using 20 µl diffusion tubes were prepared and were co-exposed randomly at different sites for two weeks and tested.
Table 1. Description of sampling sites.
Exposure Station sites Latitude (˚N) Longitude (˚E) Altitude (m) Remarks
1. Bijuli bazaar RS1 (Road side) 27.6795 85.3245 1304 High volume sampler sampling station
2. New Baneswor HS2 27.6885 85.3253 1311 Road side + high slope
3. New Baneswor RS1 27.6925 85.3407 1316 Intermediate site (Road side with less traffic)
4. Maitighar RS1 27.6934 85.3216 1304 High traffic
5. Indra chwok RS1 27.7029 85.3096 1303 Market center
6. Thamel, MOEST 27.7152 85.3113 1321 Urban Residential , Ministry’s monitoring station
7. Kalimati RS1 27.6996 85.2987 1443 High traffic road intersection 8. New Baneswor BK3 27.6920 85.3317 1310 Inside residential area Urban Background site
Note: RS = Road side monitoring sites; BK = Back ground monitoring sites; HS = High slope road side monitoring sites; MOEST = Continuous monitoring stations of Ministry of Environment.
Figure 2. Co exposure of developed test diffusion tubes and Ferm-IVL sampler.
2.3.2. Comparison between Absorbents Volumes
Five sets of triplicates of two different volumes of 10 µl, and 30 µl of 20%, 30% and 50% v/v aqueous TEA were tested for two weeks exposure.
2.4. Statistical Analysis
2.4.1. Method Validation
Precision was expressed as the coefficient of variation (CV), also referred to as relative precision by the US EPA, CV was calculated as the sample standard devia- tion divided by the sample mean times 100%.
Accuracy of passive sampler was evaluated by com- paring the measured results with the co-exposed Ferm- Badge sampler from IVL Sweden, which was analyzed by standard ion chromatographic analysis at IVL. The results are also compared with the data from the active monitoring by high volume sampler using TEA as trap- ping agent followed by same procedure, the Modified Griess-Saltzman spectrophotometric method [2,11-13,29].
The active monitoring was performed during the test sam-pler exposure periods.
2.4.2. Uncertainty Analysis
Detection limit and minimum detectable quantity
For this research, two kinds of detection limit (DL) were calculated. The first DL was for the analytical equipment, spectrophotometer and second DL was for the entire sampling method of NO2 for different periods of expo- sure of tubes. The DL for the spectrophotometer was calculated from a calibration curve with the help of Equa- tion (5) (Miller and Miller, 1984) [30]. The detection limit (Y) is the analyte concentration that gives a signal equal to the blank signal (YB) plus three standard devia- tions of the blank, SB.
Y = YB + 3SB (5) The detection limit for the passive sampling method was calculated by multiplying the standard deviation of blank values with one-tailed t-value (degrees of freedom at 99% confidence level). The equation is given below.
DL = SB × t(á,n–1) (6) where,
SB = standard deviation of blank values
t(á,n–1) = critical value of t-distribution with n – 1 de-grees of freedom and a Significance level of á (0.01 lev-els).
3. Results and Discussion
This work presents an affordable cheap method to passi- vely measure ambient NO2 and SO2 using locally avail-able polyethylene tubes. Passive measurement includes development of these tubes into diffusive tubes using triethanolamine (TEA) as absorbent. Calibration curve from nitrite (NO2) standards were prepared and used for
subsequent analysis of blanks and exposed tubes. Same standard curve was used for the calculation of detection limits as well.
[image:4.595.75.270.264.462.2]subtraction from that of the blanks at the corresponding sites was used in Equation (3) to determine NO2 concen-tration in µg/m3 in ambient air. Diffusion coefficients for NO2 in ambient air used is 1.54 × 10⁻⁵ m2·s–1 [15].
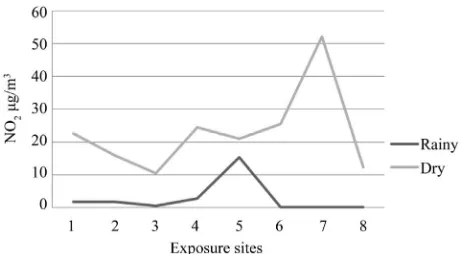
Figure 3 presents the exposure measurement of NO2 concentration for field exposure. The result of all expo-sures provides a reliable ambient NO2 passive sampler with good precision, quite capable of comparison to the other methods. Precision of NO2 measurement for two week exposure period was found to be 21.4% compared adequately with the US National Institute of Safety and Health (NIOSH) acceptance criterion (25%) for field performance of passive sampler applications in air [31]. In each station the concentration of NO2 were higher for second exposure period, as expected. The range of NO2 as measured was 0.8 to 15.3 µg/m3 for rainy season and 10.5 to 52.2 µg/m3 for dry season (
Figure 3).
The number of samples collected was lower than the number of exposed tubes installed and analyzed. Some of the field blanks and the exposed tubes gave negative ab- sorbance values. The filter papers dropped out from some of the tubes at site 1, 4 and 5. The dropped out are more for NaOH plus NaI absorbent tubes. These vandalisms were reduced in second exposure.
Blank absorbances for unexposed tubes were found to be equivalent to a mean nitrite mass of 0.03 µg/m3 for preparation using aqueous TEA solution. The blank val- ues present the status of preparation of diffusive sam- pling methods. Thus in this study the CV of blank tubes were found to be of 13.7% with standard error of the mean 0.0014 for NO2.
A repeated test for repeated measures of NO2 for two exposures implied significant difference for five sam- pling sites (Site 1 - 5) and also for 1st and second expo- sure periods. As mentioned earlier second exposures were carried out during month of February-March with the additional three more sites (Total of eight) sites 1 to 8. The result shows the highest concentration of NO2 at the site 7, Kalimati, which represents a road side with high traffic intensity. Site 8 is a residential urban background site showing lowest concentration of NO2. The result shows that vehicles could be the one of the major sources of NO2 in Kathmandu.
3.1. Absorbent Test
A study was conducted to compare between two absor- bents for NO2. No significant difference was found be- tween two kinds of absorbents used for NO2 (Table 2), still high percentage of drop out were observed for NaOH + NaI as an absorbent for ambient air NO2 sam- pling. The losses of NO2 were observed by using TEA for long-term sampling [3]. NO2 TEA adduct is prone to
photo degradation while exposing the tubes in sun.1 Fur- ther work is required to find out the best absorbent for
Figure 3. Field exposures result for ambient concentration of NO2.
Table 2. Results of NO2 (µg/m3) from exposure analysis
using TEA and NaOH plus NaI (July, 2007).
Sampling site Tube with TEA Tube with NaOH plus NaI
2 3.99 ± 0.62 4.15 ± 0.68
4 4.59 ± 0.98 4.15 ± 0.38
5 17.52 ± 17.00 15.08 ± 13.72
NB: No significance difference between absorbents at p < 0.05.
passive sampling of NO2 measurements.
Not only the type of absorbent but their volume and concentration also were the integral part of the passive sampling.
Five exposure sets were deployed to determine whe- ther the aliquot volume used on the diffusion tube also contributed to differences in NO2 uptake by the samplers (Comparison of aliquot volume). Pair t-tests showed no difference between compared sampler means, indicating that NO2 uptake was equivalent for samplers prepared using aliquot volumes in the range 10 - 30 µl. However for the samplers with aliquot volume 10 µl, there was higher rate of drop out (≈80%).
Further exposure sets compared for three different concentrations of TEA, 20%, 30% and 50% using 20 µl of aliquot volumes showed no significant different be- tween the TEA concentrations at the tested environment using ANOVA at p = 0.05 confidence level for the first exposure set for rainy season, while a significant differ- rence between the three different concentrations and highly significant different between the sites were ob- served for the dry season samples exposure (Figure 4).
gation on the efficiency of filter papers is required to find out the best filter paper for sampling conditions.
3.2. Comparison with Other Methods
3.2.1. Comparison with IVL-Passive Sampler Result
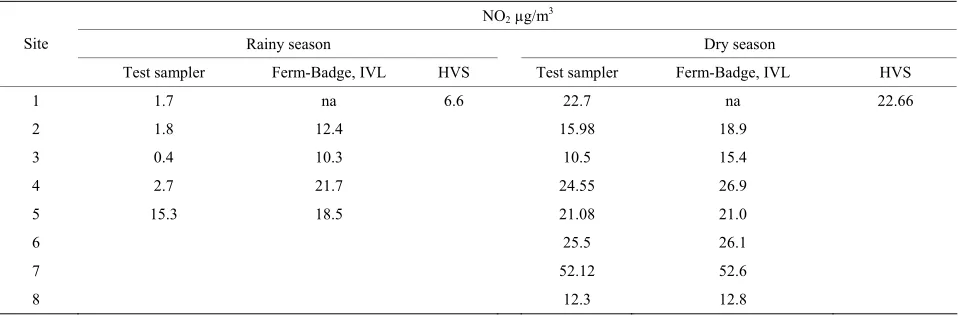
Result from Test sampler method, IVL-sampler and ac-tive-High volume sampler monitoring analysis for both seasons for NO2 concentration were presented in Table
[image:6.595.57.284.86.184.2]3. Figure 4. Comparison of absorbent TEA-water
concentra-tions. The result also confirmed that site seven was the most
polluted among the eight sites studied with NO2 and site eight representing background area the lowest. A linear regression of NO2 measured with the current test passive samplers on the Ferm-IVL passive sampler was reported in Table 4. Strong correlations were obtained for both
the seasons, between the current test sampler and Ferm- IVL sampler result (Figures 5 and 6). The result proved
reliable ambient NO2 samplers with good precision, quite capable of comparison to the Ferm-IVL sampler.
tion of the acidic NO2 gas as nitrite may be incomplete if complexation between nitrite ions and TEA is restricted by lack of hydroxyl ions in the solution, resulting lower accumulation of nitrite ion than for other lower concen-trated solutions. The hydration of TEA is necessary for conversion of NO2 to nitrite [32]. In the same study the mole ratio of NO2 to TEA for a polluted environment (50 ppb of NO2) suggests a presence of very large excess of TEA, 1:1000 for 2 weeks and 1:500 for 4 weeks expo- sure periods, which favors the current tested result of no significant difference between the 20%, 30% and 50% TEA v/v absorbents during rainy season and significant different for dry season at p = 0.05 and 0.01 level of con-fidence respectively. It is because the concentrations were higher during dry season.
Accuracy, defined as the percent deviation of NO2 measured by test passive samplers from the Ferm-IVL samplers, was identified as over all under estimation of 18% for one week exposure and 96% that for four week exposure for dry season, while it is 68% for first expo-sure-Rainy season. In simplest form result showed that test passive samplers under estimate the ambient NO2 than Ferm-IVL samplers. Several factors attributed to this deviation, notably the concentration and amount of absorbent medium, sampler size and the meteorological condition of monitoring period. During dry season, tem-perature inversion restricts the dispersion of the pollut-ants resulting elevated concentration in the Kathmandu valley. As a result the one week exposure analysis is suf-ficient and suitable for ambient NO2 monitoring during dry season. It is further revealed by the weekly variation result analyzed below (Figure 7). Saturations were ob-
served during first week in dry season for NO2. Hence Sampling medium and absorbent are also very impor-
[image:6.595.60.539.579.737.2]tant in tube preparation. The sampling medium, such as filter paper, which is used to soak the absorbent, has a very important role in passive sampling of gases. The se- lection of filter paper is an important part of passive sampling as it may be the source of contamination and may not be very efficient to use as the sampling medium. In this study, GF filter papers were used after washing with double distilled water. Previous researches had shown that washing filter papers with deionised water could greatly lower the contamination [27]. An investi-
Table 3. Result from Test sampler method, IVL-sampler and active-high volume sampler monitoring analysis for both sea-sons for NO2 concentration.
NO2 µg/m3
Rainy season Dry season
Site
Test sampler Ferm-Badge, IVL HVS Test sampler Ferm-Badge, IVL HVS
1 1.7 na 6.6 22.7 na 22.66
2 1.8 12.4 15.98 18.9
3 0.4 10.3 10.5 15.4
4 2.7 21.7 24.55 26.9
5 15.3 18.5 21.08 21.0
6 25.5 26.1
7 52.12 52.6
Table 4. Comparison of field measurements of test-method with IVL-sampler, to EPA acceptance criteria.
NO2 µg/m3
Rainy (4 weeks exposure) Dry (1 weeks exposure) Dry (4 weeks exposure) EPA Acceptance Criteria
Slope of Regression 0.510 0.941 0.136 1 ± 0.12
Intercept of Regression –2.630 +3.008 +13.72 –7 to 7
R2 1.66 0.985 0.104 -
Pearson Correlation Coefficient, r 0.408 0.993 0.323 0.946
Precision (rms CV) 20.7 2.015 14.97 15%
Significant two sample t-test
difference, p value# 0.04 0.05 –0.71*
[image:7.595.56.287.240.363.2]NB: #*Significant difference.
Figure 5. Comparison of NO2 concentration between test-
method with IVL-sampler for rainy season.
Figure 6. Comparison of NO2 concentration between test-
method with IVL-sampler for dry season.
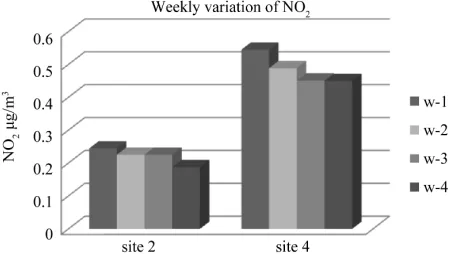
Figure 7. Weekly variation of ambient NO2 sampling per
tube for test diffusion tube sampler for March 2008.
Time weighted average made underestimation for four week exposure result. Better result during second expo- sure analysis (Dry season) in compare to first exposure result attributed to the improvement in the sampler pre- paration and modifications undertaken.
The fact that NO2 measured with the current test pas- sive samplers correlated extremely well with that mea- sured with the Ferm-IVL samplers further suggests that this bias is systematic. Such systemic bias may be attri- buted to the assumption made in calculating concentra- tion with the passive samplers, volume and with chemi- cal speciation capability of the absorbing medium. Al- ternatively, seasonal and/or site correction factors could be developed and applied to adjust passive sampler data [33]. Regression analysis reveals the valid comparison as the parameters, slope, intercept and Pearson correlation coefficient, r; are within the tolerance set by US EPA’s acceptance criterion for Environment monitoring (Table 4).
The method comparison further done by Pair t-test (TWO-tailed) to estimate the level of significance of any differences in NO2 measurements by the compared two methods. Sampler means are significantly different if the p value is ≤ 0.05 (95% confidence level), and very highly significantly different if p ≤ 0.001 (99.9% confidence level).
Results showed that for all the exposure analysis, First exposure (rainy) and Second exposure (dry) of NO2 mo- nitoring under tested period are not significantly different except for four week dry season exposure for NO2. It is significantly different at p ≤ 0.05 (95% confidence level).
3.2.2. Weekly Variation Analysis
[image:7.595.56.285.405.527.2] [image:7.595.60.286.577.704.2]and 4 up to fourth week period showed in Figure 7.
Two way analysis of variance (ANOVA) for weekly variation of NO2 showed that there were no significant different between the weeks at p ≤ 0.05 (95% confidence level). The concentration of NO2 was significantly dif- ferent between sites at p ≤ 0.05 (95% confidence level).
Hence from the ANOVA test and the Figure 7, it is
evident that though there was no significant loss of NO2 for four week exposure time, one week is sufficient and suitable for analysis of ambient NO2 for dry season.
3.2.3. Comparison with High Volume Sampler Measurement
Monitoring of NO2 using High volume sampler was car-ried out in site 1 during the period of first and second exposure of Test sampler shows good agreement between two methods for dry season monitoring than those from rainy season (Table 3). The underestimation during rainy
season exposure analysis by test method in compare to active high volume sampling method might be due to longer period of exposure of four weeks causing loss of pollutants or some unknown interferences. However, im- provement in second sampling result during dry season showed the validity of the test method for the ambient monitoring by developed diffusive samplers in Kath- mandu.
3.3. Detection Limits
The detection limit of the spectrophotometer obtained from the calibration curve with the help of Equation (5) was 0.09 μg/ml of 2 The standard deviation of
blank values was used to calculate the detection limit for the passive sampling method. The detection limit of NO2 for one week , two weeks, three weeks and four weeks exposure period were estimated to be 2.73 μg/m3 (n = 11), 1.77 μg/m3 (n = 11), 1.75 μg/m3 (n = 10) and 1.84 μg/m3 (n = 11) respectively for developed diffusive samplers.
NO
The detection limits of NO2 for the diffusion tubes were suitable for the study areas as the concentrations measured were not found to be below the detection limit.
3.4. Conclusions
The important achievement from this research lies in the possible use of simple polyethylene tubes from local market as diffusive passive sampler for ambient moni- toring of selected pollutants with suitable modification in existed methods. It is possible to use these simple kinds of tubes from local market and that can show the trends of NO2 concentrations and work well for passive sam- pling.
One week exposure period during high pollution state- dry season for NO2 is the suitable time period for the ambient sampling and monitoring under the tested/de-
veloped experimental condition for Kathmandu. The po- lyethylene tubes and GF/A filter paper with 20 µl of v/v 30% TEA/water as absorbent has been used and proven to be good enough for monitoring of NO2.
There was good correlation between measurements of NO2 by developeddiffusion tubes in comparison with Ferm-IVL passive samplers from IVL-Sweden. There was no significant different between two methods at p = 0.01. Though, Test passive samplers under estimate the ambient NO2 than Ferm-IVL samplers. Regression analy-sis reveals the valid comparison as the parameters, slope, intercept and Pearson correlation coefficient, and r are within the tolerance set by US EPA’s acceptance crite-rion for Environment monitoring. The comparison of NO2 diffusion tubes and active sampling implied a good agreement. Precision of the passive sampling method for measurement expressed as Coefficient of variation (CV) was found to be consistent with other previous studies. [4,34].
Apparently, there is a need for maintaining and ex- panding the existing monitoring stations both for moni- toring additional air pollutants and current monitoring pollutants, and such an expansion requires large invest- ments and additional operational expenses for a develop- ing country. An urgent action of adopting inexpensive, simple and reliable methods for wide-spread air quality monitoring, simultaneously, at multiple points over large areas is needed for Nepal. Thus, passive sampling is pro- ved to be one such methodology to fulfill this need in applications, as demonstrated by this study for Kath-mandu.
Future studies should incorporate towards developing such passive samplings in overcoming the systematic bias observed in the field exposure results due to sea- sonal and other possible reasons.
4. Acknowledgements
The study was supported by grant from National Institute of Science and Technology, Nepal, PhD scholar grant from, Tribhuvan University Nepal. The author acknow- ledges the other logistic and inspiring support from CEMAT, Water Lab, Nepal, Central Department of En- vironmental Science, TU, Nepal; Menris-ICIMOD, Ne- pal; Rapid Urban assessment project funded by UNEP RRCAP, Sida, Stockholm Environment institute (SEI), IVL, Sweden and Ministry of Environment Government of Nepal.
REFERENCES
No. 1, 1997, pp. 127-134.
doi:10.1016/S0003-2670(97)00075-5
[2] E. D. Palmes, A. F. Gunnison, J. DiMattio and C. Tomczyk, “Personal Sampler for Nitrogen Dioxide,” American In- dustrial Hygiene Association Journal, Vol. 37, No. 10,
1976, pp. 570-577. doi:10.1080/0002889768507522 [3] M. Ferm and P. Svanberg, “Cost-Efficient Techniques for
Urban and Background Measurements of SO2 and NO2,”
Atmospheric Environment, Vol. 32, No. 8, 1998, pp. 1377-
1381. doi:10.1016/S1352-2310(97)00170-2
[4] T. Bush, S. Smith, K. Stevenson and S. Moorcroft, “Vali-dation of Nitrogen Dioxide Diffusion Tube Methodology in the UK,” Atmospheric Environment, Vol. 35, No. 2,
2001, pp. 289-296. doi:10.1016/S1352-2310(00)00172-2 [5] M. Ferm, “Principles of Diffusive Monitoring,”
Measur-ing Air Pollutants by Diffusive SamplMeasur-ing and Other Low Cost Monitoring Technique Krakow Conference, Krakow,
15-17 September 2009.
http://www.rsc-aamg.org/Pages/Presentations/Krakow200 9.htm
[6] Y. Yanagisawa and H. Nishimura, “A Badge-Type Per-sonal Sampler for Measurement of PerPer-sonal Exposure to NO and NOx in Ambient Air,”Environment International,
Vol. 8, No. 1-6, 1982, pp. 235-242. doi:10.1016/0160-4120(82)90033-2
[7] K. Amaya and K. Sugiura, “A Simple, Inexpensive and Reliable Method of Measuring Nitrogen Dioxide Con- centration in Ambient Air,” Environment Protection En- gineering,Vol. 9, 1983, pp. 5-9.
[8] Diffusive Samplers for Nitrogen Dioxide from Gradko- environmental, UK. http:// www.gradko.org.uk
[9] D. Krochmal and L. Gorski, “Determination of Nitrogen Dioxide in Ambient Air by Use of a Passive Sampling Technique and Triethanolamine as Absorbent,” Environ- mental Science & Technology, Vol. 25, No. 3, 1991, pp.
531-535. doi:10.1021/es00015a023
[10] D. Krochmal and L. Gorski, “Modification of Amaya- Sugiura Passive Sampling Spectrophotometric Method of Nitrogen Dioxide Determination in Ambient Air,” Fre- senius’ Journal of Analytical Chemistry,Vol. 340, No. 4,
1991, pp. 220-222. doi:10.1007/BF00321772
[11] B. C. Cadoff and J. Hodgeson, “Passive Sampler for Am-bient Levels of Nitrogen Dioxide,” Analytical Chemistry,
Vol. 55, No. 13, 1983, pp. 2083-2085. doi:10.1021/ac00263a017
[12] J. D. Mulik, R. G. Lewis and W. A. McCleny, “Modifica-tion of a High-Efficiency Passive Sampler to Determine Nitrogen Dioxide or Formaldehyde in Air,” Analytical Chemistry, Vol. 61, No. 2, 1989, pp. 187-189.
doi:10.1021/ac00177a022
[13] M. Ferm, “A Sensitive Diffusion Sampler,” Report, Swe- dish Environmental Research Institute, Stockholm, 1991. [14] UNEP/WHO, GEMS/AIR Methodology Reviews Vol. 4:
Passive and Active Sampling Methodologies for Meas-urement of Air Quality, WHO/EOS/94.4.5.UNEP Nairobi, Genava, 1994.
[15] K. Shakey, “Passive sampling of Nitrogen Dioxide and Sulfur Dioxide in Ambient Air,” Masters’ Thesis,
Gradu-ate School, Chiang Mai University, Chiang Mai, 2004. [16] KVEO, “Kathmandu Valley Environment Outlook”,
In-ternational Centre for Integrated Mountain Development (ICIMOD), Ministry of Environment, Science and Tech-nology (MoEST) and United Nations Environment Pro-gramme (UNEP), 2007. www.icimod.org.
[17] B. Sapkota, “Air Pollution Transport from Kathmandu Valley,” Journal of the Institute of Engineering, Vol. 3,
No. 1, 2004, pp. 30-42.
[18] S. K. Joshi, “Violence against Women in Nepal—Health Care Workers’ Role,” Kathmandu University Medical Jour- nal, Vol. 1, No. 4, 2003, pp. 231-233.
[19] D. Pudasainee, B. Sapkota, A. Bhatnagar, S. H. Kim and Y. C. Seo, “Influence of Weekdays, Weekends and Band-has on Surface Ozone in Kathmandu Valley,” Atmos-pheric Research, Vol. 95, No. 2-3, 2010, pp. 150-156.
doi:10.1016/j.atmosres.2009.09.007
[20] B. Tuladhar, “Air Quality Management issues and Priori-ties for Nepal,” Technical Paper, National Stakeholder’s Meeting, Building Partnership for Clean Air Initiative in Nepal, CANN, Kathmandu, 2008.
[21] MOEST, “Ambient Air Quality of Kathmandu Valley,” Report, Ministry of Environment, Science and Technol-ogy, Kathmandu, 2006. www.most.gov.np
[22] MOEST, “Ambient Air Quality of Kathmandu Valley,” Report, Ministry of Environment, Science and Technol-ogy, Kathmandu, 2007. www.most.gov.np
[23] M. Ferm and H. Rodhe, “Measurements of Air Concen-trations of SO2, NO2 and NH3 at Rural and Remote Sites
in Asia,” Journal of Atmospheric Chemistry,Vol.27, No.
1, 1997, pp. 17-22. doi:10.1023/A:1005816621522 [24] G. R. Carmichel, M. Ferm, N. Thongboonchoo, J. H.
Woo, L. Y. Chan, K. Murano, P. H. Viet, C. Mossberg, R. Bala, J. Boonjawat, P. Upatum, M. Mohan, S. P. Adhi-kary, A. B. Shrestha, J. J. Pienaar, E. G. Brunke, T. Chen, T. Jie, D. Guoan, L. C. Peng, S. Dhiharto, H. Harhanto, A. M. Jose, W. Kimani, A. Kirouane, J. P. Lacaux, S. Rich-ard, O. Barturen, J. C. Cerda, A. Athayde, T. Tavares, J. S. Cotrina and E. Bilici, “Measurements of Sulfur Dioxide, Ozone and Ammonia Concentrations in Asia, Africa and South Africa Using Passive Samplers,” Atmospheric En-vironment, Vol. 37, No. 9-10, 2003, pp. 1293-1308. doi:10.1016/S1352-2310(02)01009-9
[25] Cornwall Air Quality Forum, Truro NO2 Diffusion Tube
Programme, 2000.
http://www.cornwall-airquality.org.uk/trurono2.asp [26] A. Kasper-Giebl and H. Puxbaum, “Deposition of Par-
ticulate Matter in Diffusion Tube Samplers for the De- termination of NO2 and SO2,” Atmospheric Environment,
Vol. 33, No. 8, 1999, pp. 1323-1326. doi:10.1016/S1352-2310(98)00298-2
[27] D. Krochmal and A. Kalina,” Technical Note: A Method of Nitrogen Dioxide and Sulphur Dioxide Determination in Ambient Air by Use of Passive Samplers and Ion Chromatography,” Atmospheric Environment, Vol. 31,
No. 20, 1999, pp. 3473-34579. doi:10.1016/S1352-2310(97)00154-4
with Diffusive Samplers: Theory and Practical Consid- erations,” Journal of Environmental Monitoring,Vol. 2, No. 1, 2000, pp. 1-9. doi:10.1039/a906404d
[29] C. Kirby, M. Fox and J. Waterhouse, “Reliability of Ni-trogen Dioxide Passive Diffusion Tubes for Ambient Measurement: In Situ Properties of the Triehanolamine
Absorbent,” Journal of Environmental Monitoring,Vol. 2,
No. 4, 2000, pp. 307-312. doi:10.1039/b003124k
[30] D. P. Miller, “Ion Chromatographic Analysis of Palmes Tubes for Nitrite,” Atmospheric Environment, Vol. 18, No. 4, 1984, pp. 891-892.
doi:10.1016/0004-6981(84)90281-6
[31] S. Seethapathy, T. Gorecki and X. Li, “Review Passive
Sampling in Environmental Analysis,” Journal of Chro- matography A, Vol. 1184, No. 1-2, 2008, pp. 234-253 [32] E. D. Palmes and E. R. Johnson, “Explanation of Pressure
Effects on a Nitrogen Dioxide (NO2) Sampler,” American
Industrial Hygiene Association Journal, Vol.48, No. 1,
1987, pp. 73-76.
[33] D. K. Ott, “Passive Sampling of Ambient Coarse Particu-late Matter, PM10-2.5”, Ph.D. Dissertation, Graduate College of the University of Iowa, , 2007.