Server Selection for Carbon Emission Control
Joseph Doyle
CTVR, Trinity CollegeDublin,Ireland
[email protected]
Donal O’Mahony
Department of Computer Science and Statistics, TrinityCollege Dublin, Ireland
[email protected]
Robert Shorten
Hamilton Institute, NUIM,Ireland
[email protected]
ABSTRACT
Cloud owners are allowing their users to specify the level of resources being used in the different geographical locations that make up the cloud. The carbon emissions caused by powering these resources can vary greatly between different geographical regions. The traffic for a given service can come from anywhere on the planet and the further the request has to travel the greater the negative effect on quality of service (QoS). It is desirable to route traffic to the resources which cause the lowest carbon emissions but this can affect the QoS. A framework that characterizes this trade-off between carbon emissions and QoS is established in this paper. An algorithm that attempts to minimize the total cost of the trade-off described is presented. A traffic generator is used to generate load for a server to establish functions which de-tail the carbon emissions and QoS of a service. We use these functions to simulate the performance of the algorithm in minimizing the total cost. Our results imply that carbon emissions can be reduced with little effect on the QoS under static traffic conditions and favourable energy supply condi-tions.
Categories and Subject Descriptors
C.2.3 [Network Operations]: Network management
General Terms
Algorithms, Economics, Performance
Keywords
Subgradient Method, Relative Price Function, Carbon Emis-sions
1.
INTRODUCTION
Cloud computing is a new paradigm for the delivery of internet services. A cloud based service provider (CBSP) provides the illusion of infinite resources and the ability to
Permission to make digital or hard copies of all or part of this work for personal or classroom use is granted without fee provided that copies are not made or distributed for profit or commercial advantage and that copies bear this notice and the full citation on the first page. To copy otherwise, to republish, to post on servers or to redistribute to lists, requires prior specific permission and/or a fee.
GreenNet’11,August 19, 2011, Toronto, Ontario, Canada. Copyright 2011 ACM 978-1-4503-0799-4/11/08 ...$10.00.
quickly alter the level of resources being used by the cloud user. The cloud user can, therefore, change the level of re-sources to react to changes in the demand for that service. A cloud may be comprised of several data centers (DCs) at different geographical locations. If a global distribution of servers is used with load balancing it has many potential benefits. Reduced latency and increased data transmission rates can be achieved due to the decrease in the length of the links between the client and server. Some CBSPs will select the location of the resources for the cloud user au-tomatically. Other CBSPs, however, allow the cloud user to select the level of resources operating at the different ge-ographical locations. For example, in the case of Amazon EC2, a user can choose servers located in Dublin, Singa-pore, Tokyo and in two locations in the United States. This presents a cloud user with a number of interesting options. He/she can select the number of servers he/she wishes to use in the various DCs that make up the cloud. He/she can then use Domain Name Service (DNS) to load balance the traffic among servers to attempt to achieve various goals. The cloud user may wish to route load to the closest DC in order to minimize the latency between client and server. This is cru-cial for some applications such as conference Voice-over-IP (VoIP) software and interactive online games. The financial cost of servers at different geographical locations is not al-ways equal [1] so the cloud user may want to route load to a single data center which has the cheapest servers available. Motivated by [15], we propose a framework which describes the trade-off between the various associated factors in order to characterize the optimal server distribution for the cloud user.
Recently the amount of carbon emitted by electricity gen-erators to power the different DCs has also become impor-tant. Greenpeace report the percentage of electricity utilized by various data centers which is generated by power plants that emit a relatively large amount of carbon [8]. For exam-ple, a power plant that uses coal as a fuel emits a relatively large amount of carbon. It is possible to calculate the car-bon emissions caused by a DC for a given time. In order to calculate this value we examine the fraction of total power being generated by a power plant using a particular fuel and the carbon emitted per kilowatt hour by this particular fuel. We sum the product of these for all the power plants of the electricity supplier in order to establish the carbon emissions caused by a DC for a given time. The carbon emitted per kilowatt hour by a power plant using a particular fuel is detailed in [5, 9].
with a service is important, but a reasonable quality of ser-vice (QoS) must also be maintained. Anecdotal evidence suggests that increasing the latency of a web service by half a second has been found to lead to a 20% drop in traffic and in revenue [10]. Routing service requests to the DC with the lowest carbon emissions can result in a negative effect on QoS. Hence, there is a trade-off between carbon emissions and QoS and we represent the trade-off as a cost function. A relative price function is used to represent the relative im-portance of the two factors. A similar approach is used in active queue management (AQM) [15]. This paper makes the following contributions:
• The development of a framework which describes the trade-off between the carbon emissions and the QoS of a service is proposed. A distributed algorithm to minimize the total cost in the trade-off described by the framework is presented.
• Experimental data is presented to establish functions describing the carbon emissions and QoS of the service.
• We evaluate the performance of the proposed algo-rithm in minimizing the total cost in the traoff de-scribed by the framework. The carbon emissions can be reduced with little effect on the QoS under static load conditions and favourable energy supply condi-tions.
In the next section we present related work. Section 3 for-mulates the problem as a cost function. Section 4 details the algorithm to minimize the cost function. Section 5 discusses the experimental data used to establish the cost function and the simulation setup used to evaluate the algorithm. Section 6 presents the results of the simulations. Section 7 discusses future work.
2.
RELATED WORK
In this section we discuss related work which considers electricity when assigning load. Qureshiet al. [13] present data on the fluctuation of energy prices and perform simu-lations on the economic gain that can be achieved using a
distance constrained electricity price optimizer. This essen-tially routes load from the client to the DC with the lowest electricity price in some radial geographical distance. An-other proposal by Stanojevi´cet al. shows a distributed algo-rithm to equalise the change in the cost of energy [16]. This is shown to be equivalent to minimizing the cost of energy while maintaining a level of QoS. Another proposal by Wen-dellet al. [17] proposes a general framework for the mapping of traffic between clients and servers. This framework allows for a variety of mapping policies to be implemented to allow the mechanism which controls the traffic to aim for different objectives.
Related ideas can also be found in AQM. In AQM algo-rithms the router responds to traffic to achieve certain goals. Often, there is a conflict between the utilization and average queuing delay which is dependent on router buffer size. The conflict between utilization and average queuing delay are represented as a benefit function with a relative price func-tion [15]. Algorithms which attempt to maximize the benefit function are also presented. In this paper we use a similar idea to characterize the optimal server distribution for the cloud user.
Our work requires the minimization of a convex function. The subgradient method is used to solve convex optimiza-tion problems. The method uses a subgradient which is the slope of a line which touches a point on the convex function and does not go above the function at any point. It uses this to converge in an iterative manner. The rate of conver-gence is dependent on the step size. Subgradient methods are well established techniques for solving convex optimiza-tion problems [12, 2]. The subgradient method is used in the algorithm to minimize the total cost in the traoff de-scribed by the framework.
3.
PROBLEM FORMULATION
We begin by examining the cost function for a scenario where a cloud user opts to use servers in a single DC. The cloud user can vary the number of serversn that are pro-viding a service. A cost function can then be established to represent the average job timeT(n), the carbon emissions
G(n), and the relationship between them. The average job time will decrease as the number of servers increases, but the amount of carbon emitted as a consequence will increase as the number of servers increase. The cloud user would like to minimize the average job time and carbon emissions or some combination thereof. The cost function can be defined as:
C(n) =T(n) +P(G(n)),
whereP(G(n)) is the relative price function between average job time and the carbon emissions. A relative price function is used to represent the fact that carbon emissions G(n) have the same importance as an average job time P(G(n)) to the cloud user. We assume that C(n) is a convex function of n so that convex optimization techniques can be used to minimize the cost function. This seems like a reasonable assumption as the average job time will decrease as the number of servers increases until a point is reached where the carbon emissions will cause the cost functionC(n) to increase.
We can incorporate multiple DCs in this framework. If
n={ni}is the vector of the number of servers at each DC
andN is the total number of DCs, the cost function can be redefined as:
C(n) =
N
X
i=1
Ti(ni) +P(Gi(ni))
.
The goal of the problem is to minimizeC(n) and it can be stated as an optimization problem as follow:
minimize C(n) =
N
X
i=1
Ti(ni) +P(Gi(ni))
subject to ni≥0 ∀i
4.
ALGORITHM
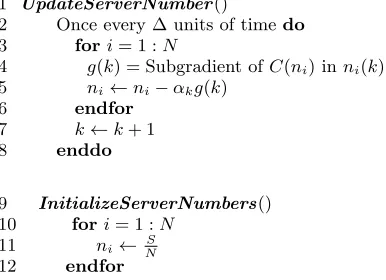
The subgradient method can be used to solve this problem and the pseudo-code for the algorithm is presented in Figure 1. The number of servers operating at each DC is initially set to be S
N. WhereSis the total number of starting servers.
1 UpdateServerNumber()
2 Once every ∆ units of timedo
3 fori= 1 :N
4 g(k) = Subgradient ofC(ni) inni(k)
5 ni←ni−αkg(k)
6 endfor
7 k←k+ 1
8 enddo
9 InitializeServerNumbers()
10 fori= 1 :N
11 ni←NS
[image:3.612.55.248.65.205.2]12 endfor
Figure 1: Pseudo-code for algorithm
DC will then be calculated and used to update the number of servers operating at the DC. The goal of this update is to gradually move toward the optimal point of the cost func-tion. αk is the step size. It determines the stability and
responsiveness properties of the algorithm. kis the iteration number and is used in the calculation of the step size. The use ofkis required to ensure convergence as a diminishing step size is usually required to reach the optimal point.
5.
EXPERIMENTAL SETUP
In this section we describe the experiments used to estab-lish realistic average job time Ti(ni) and carbon emission
Gi(ni) functions and the setup for the simulation of the
al-gorithm described in Section 4. In order to simulate the operation of the algorithm we needed to establish realistic average job time Ti(ni) and carbon emission Gi(ni)
func-tions. To do this we used thehttperf [11] traffic generator to generate load for an Apache web server. Our test load involved the fetching of a dynamic webpage which required 50ms of computation and the transfer of 300kB of data. This load was selected as it is equivalent to the average size of a webpage in experiments carried out by google [6] and it con-tains a computation component which consumes more power than data transfer only. The server we used was a Dell R300 with an Intel 64 bit Xeon processor and 2Gb of RAM. A number of webpage requests were directed to the server and the average job time was recorded. The number of webpage requests was gradually increased while recording the average job time. We then used these results to establish aTi(ni)
function for a given number of requests for a service. We assume that the sources of load are globally distributed. By this we mean that the clients of the service are distributed evenly across the globe. If a large portion of the load is di-rected to a single DC there will be a negative effect on the average job time. There are two reasons for this:
• The internal network topology of some DCs means that links become more oversubscribed in terms of band-width as overall traffic increases [7].
• The average job time is affected by the computation time, the length of the links between the client and the server [14] and the time spent in router buffers before being forwarded to the next link. If the load is globally distributed, the average distance between the client and server along the links will increase as more load is sent to a single DC.
0 20
40 60
80 1000
20 40
60 80
100 0
1000 2000 3000 4000 5000
C(n)
n1
n2 C(n)
500 1000 1500 2000 2500 3000 3500 4000 4500 5000
Figure 2: Overall cost function for different numbers of servers at the two DCs.
This negative effect was incorporated intoTi(ni) function by
increasing the average job time when a large portion of the load is assigned to a single DC.
The server was connected to an electricity usage monitor and its power consumption was recorded under the same load conditions used to establish the average job time function. This data was used to establish a carbon emission function for a specific number of requests for a service. Our results found that idle power is∼70% of the server’s peak power. This is consistent with the results which indicate that the idle power of servers is between 60% and 75% of the peak power [3, 4]. In order to establish a realistic carbon emission function we need to know the carbon emissions per kilowatt hour. This is dependent on the electricity supplier used by each DC.
In our simulations we construct a scenario where the traf-fic is being divided among two DCs. The first data center uses relatively clean energy with associated emissions of 100 grams of carbon per kilowatt hour 100g/kW h. The second DC uses relatively dirty energy with associated emissions of 500 grams of carbon per kilowatt hour 500g/kW h.
In selecting these values we attempted to pick contrasting but realistic carbon emission profiles. A DC using the clean-est energy possible would cause approximately 20 grams of carbon per kilowatt hour 20g/kW h[5, 9]. Such a figure is difficult to achieve currently as it would require energy from purely renewable sources. A DC using the dirtiest energy possible would produce approximately 900 grams of carbon per kilowatt hour 900g/kW h [5, 9]. Electricity suppliers, however, will rarely use coal and oil only, as hydro and gas power plants are the best to react to sudden changes in de-mand.
[image:3.612.315.571.65.244.2]20 25 30
35 40 45
50 55 6020
2530 3540
4550 5560 0
500 1000 1500 2000
C(n)
n1
n2 C(n)
400 600 800 1000 1200 1400 1600 1800
Figure 3: Close-up of optimal point of overall cost function for different numbers of servers at the two DCs.
processors, RAM and network cards. This means that the servers will complete a computation in the same amount of time and use the same power to complete it. As a result
T1(n1) =T2(n2).
In order to establish a reasonable value for the relative price function we must examine the cost function at one of the DCs. Under initial conditions the average job time at the first DC is 85ms T1(n1) = 85ms, and the carbon
emissions are 6.6g/min; namelyG1(n1) = 6.6g/min. This
yields a total cost ofC1(n1) =T1(n1) +G1(n1) = 85 + 6.6 =
91.6 if P(G(n)) = G(n). In this case a drop of 10ms in the average job time would justify an additional 9g/min of carbon emissions. We feel that this is not a reasonable trade-off between carbon emissions and QoS. The relative price function was then scaled to P(G(n)) = 10G(n) to provide a more reasonable trade-off between carbon emissions and QoS.
The requests are distributed evenly among all the servers and a server runs at peak power when it is receiving 1200 requests a minute or more. This means that 80 servers run-ning at peak power are able to service the static traffic con-ditions of 96,000 requests every minute. We set the initial number of servers to 80 (S = 80). The algorithm updates every minute (∆ = 1min). This value was selected to al-low enough time for the servers to switch on or off before another update occurs. Using the established functions we can plot the overall cost functions for different numbers of servers at the two DCs using the relative price function for the static traffic conditions. Figure 2 depicts the number of servers operating at the first DC, n1, on the x axis, the
number of servers operating at the second DC,n2, on the y
axis and the corresponding costC(n) on the z axis . Figure 3 is a close-up of Figure 2 and from this we can see that the optimal point is whenn1= 50 andn2= 30 orn= (50,30).
6.
RESULTS
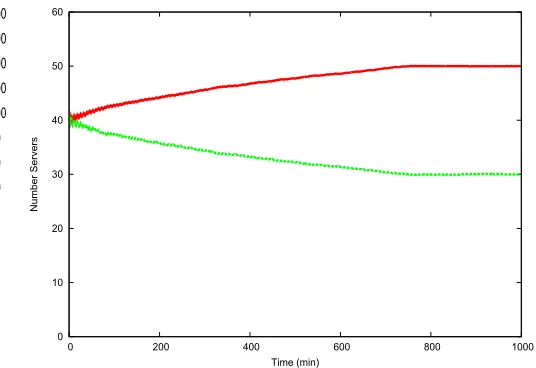
The goal of the simulations is to show that the algorithm converges to the optimal point of the cost function. Figure 4 depicts time on the x axis and the number of servers op-erating at the DC on the y axis as the algorithm operates.
0 10 20 30 40 50 60
0 200 400 600 800 1000
Number Servers
[image:4.612.303.571.59.243.2] [image:4.612.66.444.61.243.2]Time (min)
Figure 4: Number of servers at the DCs with ak =
1 √
k||g(k)||2.
Each line represents the number of servers operating at a DC. The number of servers in each DC moves steadily from the initial configuration ofn= (40,40) to the optimal point ofn = (50,30). This results in the carbon emissions drop-ping from 39.6g/min to 33g/min. This represents a drop of 16% in carbon emissions with little effect to the QoS.
The rate of convergence to the optimal point is quite slow. The optimal point is reached after 750 minutes. One reason for this is that the step size was chosen to ensure convergence to the optimal point and prevent large movements in the number of servers operating. In this case the step size was:
ak=
1
√
k||g(k)||2
.
The absolute value of the subgradient ||g(k)||21 is used to
provide a constant step length. We can use a step size that contains an estimate of the optimal cost C(n∗) to improve the rate of convergence. The step size we used to improve the rate of convergence was:
ak=−
0.1(C(n∗)−C(n))
||g(k)||2+ 1
.
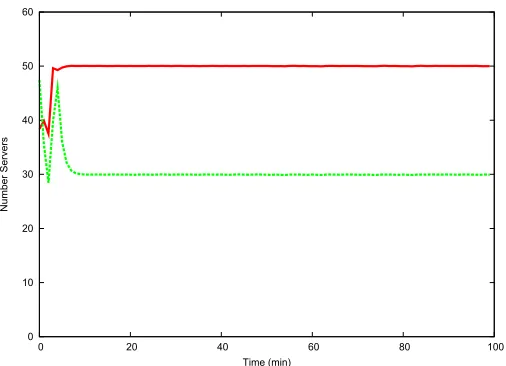
Figure 5 depicts time on the x axis and the number of servers operating at the DC on the y axis as the algorithm operates. Each line represents the number of servers operat-ing at a DC. Usoperat-ing the later step size the number of servers operating at each DC converges from the initial configuration to the optimal point more quickly. There are large jumps in the number of servers operating but the optimal point is reached after 10 minutes. This rate of convergence using this step size is more than 70 times greater than the other step size used. This allows the algorithm to perform well in the dynamic environment of the cloud.
7.
FUTURE WORK
This clearly demonstrates that achieving a trade-off be-tween carbon emissions and QoS is a good thing. We’ve
1
The value of||g(k)||2 is calculated as||g(k)||2= q
0 10 20 30 40 50 60
0 20 40 60 80 100
Numbe
r S
e
rvers
[image:5.612.54.307.59.242.2]Time (min)
Figure 5: Number of servers at the DCs with ak =
−0.1(||Cg((nk∗)||)−C(n)) 2+1 .
also demonstrated that adaptive algorithms can be used to find the optimal point in real time. Much work, however, remains to be done. This work will take two directions. One is the algorithm. There is rich literature from distributed optimization, adaptive control, neural networks and conven-tional optimization, which can be applied to this problem. All of which can be explored.
The second direction relates to relaxing assumptions. While the results in this paper have shown that carbon emissions can be reduced while maintaining QoS under static load con-ditions, future work is required to examine the effects of re-laxing some of our assumptions. Traffic conditions are rarely static. A more realistic traffic pattern grows slowly, peaks and then recedes slowly during a 24 hour period. The level and duration of the peak will also vary from day to day. Such an example using real data is given in [13]. In ad-dition, the carbon emitted per kilowatt hour will also vary with time. The reason for this is that an electricity supplier will alter the carbon emitted per kilowatt hour by switching power plants on and off to react to demand. This will affect the carbon emissions of the electricity supplier. The carbon emissions of the electricity supplier will also be affected by the amount of power that can be generated by solar and wind sources which will depend on weather conditions. As a result the carbon emitted per kilowatt hour will change with time. The optimal point will be constantly moving as the traffic conditions and carbon emissions per kilowatt hour will vary. It is possible to track the changes in the cost func-tion once the optimal point has been reached and improve the reaction speed to changes in the cost function.
Additionally, other factors can be considered in the con-struction of the cost function. The usage cost of the servers differs among the different geographical locations. An ad-ditional relative price function can be used so that all the factors can be considered when selecting the distribution of servers providing a service. This increases the complexity of the cost function but allows the cloud user to maximize the economic benefit of the algorithm assuming the algorithm remains convex. It is also possible to consider this problem from the perspective of the CBSP who hides the location of the servers from the cloud users. In this case the demand
must be divided up among the DCs. The CBSP will be at-tempting to maximize the amount of revenue it receives for the use of its machines and the QoS for the service users while attempting to minimize the carbon emissions and cost of electricity.
Acknowledgments
The authors would like to thank Dimitris Kalamatianos for his discussions about conjugate gradient algorithms. This work is partially funded by the Irish Higher Education Au-thority under the HEA PRTLI Network Mathematics Grant and by SFI grant 07/IN.1/I901.
8.
REFERENCES
[1] Amazon. Elastic Compute Cloud. http://aws.amazon.com/ec2.
[2] D. P. Bertsekas.Nonlinear Programming. Athena Scientific, 2004.
[3] G. Chen, W. He, J. Liu, S. Nath, L. Rigas, L. Xiao, and F. Zhao. Energy-aware server provisioning and load dispatching for connection-intensive internet services. InProceedings of NSDI, pages 337–350, San Francisco, 16-18 April 2008.
[4] X. Fan, W.-D. Weber, and L. A. Barroso. Power provisioning for a warehouse-sized computer. InACM symposium on Computer Architecture, pages 13–23, San Diego, 09-11 June 2007.
[5] I. B. Fridleifsson, R. Bertani, E. Huenges, J. W. Lund, A. Ragnarsson, and L. Rybach. The possible role and contribution of geothermal energy to the mitigation of climate change.O. Hohmeyer and T. Trittin (Eds.) IPCC Scoping Meeting on Renewable Energy Sources. Proceedings, pages 59–80, 2008.
[6] Google. Web metrics: Size and number of resources, Retreived Febuary 2011.
http://code.google.com/speed/articles/web-metrics.html.
[7] A. Greenberg, J. R. Hamilton, N. Jain, S. Kandula, C. Kim, P. Lahiri, D. A. Maltz, P. Patel, and S. Sengupta. VL2: a scalable and flexible data center network. InProceedings of ACM SIGCOMM, pages 51–62, Barcelona, 17-21 August 2009.
[8] Greenpeace. Make IT green cloud computing and its contribution to climate change, Retrieved Febuary 2011.
http://www.greenpeace.org/international/Global /international/planet-2/report/2010/3/make-it-green-cloud-computing.pdf.
[9] M. Lenzen. Life cycle energy and greenhouse gas emissions of nuclear energy: A review.Energy Conversion and Management, 49(8):2178–2199, August 2008.
[10] G. Linden. Marissa Mayer at web 2.0. online at:. http://glinden.blogspot.com/2006/11/
marissa-mayer-atweb-20.html.
[11] D. Mosberger and T. Jin. httperf-a tool for measuring web server performance.Performance Evaluation Review, 26:31–37, 1998.
[13] A. Qureshi, J. Guttag, R. Weber, B. Maggs, and H. Balakrishnan. Cutting the electric bill for internet-scale systems. InProceedings of ACM SIGCOMM, pages 123–134, Barcelona, 17-21 August 2009.
[14] R. Srikant.The Mathematics of Internet Congestion Control. Birkh¨auser, Boston, 2004.
[15] R. Stanojevi´c and R. Shorten. How expensive is link utilization? InProceedings of NET-COOP, pages 54–64, Avignon, 5-7 June 2007.
[16] R. Stanojevi´c and R. Shorten. Distributed dynamic speed scaling. InProceedings of IEEE INFOCOM, pages 1–5, San Diego, 14-19 March 2010.