Abstract—This research proposes an approach for optimizing multiple responses in the Taguchi method using regression models and grey relational analysis. In this approach, each response is transformed into signal-to-noise (S/N) ratio. The S/N ratios are then utilized to model each response with process factors and complete the responses for all factor level combinations. The grey relational analysis is then used to combine the quality response at each experiment into a single grey grade. Typically, the larger grey grade indicates better performance. Thus, the factor level with the largest level grade is selected as the optimal level for that factor. Three case studies in manufacturing applications on the Taguchi method are utilized for illustration of the proposed approach. It is concluded that the proposed approach is efficient for finding global optimal factor levels. Moreover, this approach can be used with incomplete data. Finally, the regression models can be used to determine the process factors that significantly affect quality response.
Index Terms—Multiple quality responses, Taguchi method, Grey relational analysis, Regression models
I. INTRODUCTION
Taguchi [1] method has significantly improved quality and yield in a product/process design. This method focuses on optimizing a single quality response of main interest [3-4]. In today’s high-tech processes, however, products have more than one quality response of main interest. The Taguchi method primarily uses engineering judgment to decide optimal factor levels for multi-responses, which increases uncertainty during the decision-making process. Over the past few years, the optimization of multiple responses has received an increasing research attention [5-6]. Nevertheless, most of research efforts
consider only the few experiments in Taguchi’s orthogonal array (OA) to decide optimal factor levels. Moreover, they failed to formulate the relationship
Manuscript received March 18, 2010. (Write the date on which you submitted your paper for review.) This work was supported by the University of Jordan, Amman.
A. Al-Refaie is with the University of Jordan; e-mail: abbas.alrefai@ ju.edu.jo).
L. Al-Durgham is with the University of Jordan.
N. Bata is a graduate student in the Dept. of Industrial Engineering,
between process factors (independent factors) with the quality response (dependent factor).
An efficient mathematical technique for underplaying the relationship between the quality response and process factors is the multiple regression models [7]. Grey relational analysis has been reported efficient in transforming multiple quality responses into a single grade. Several researches [8-9] have used the grey grade for deciding the optimal factor levels. In this context, this paper proposes an approach for optimizing multiple quality responses in the Taguchi method using regression models and grey relational analysis; where the former will be used to complete the response values for all factor level combinations, whereas the latter will be used to determine optimal factor levels. This research is organized into the following sequence. Section two outlines the proposed approach steps. Section three provides illustrative case studies. Finally, the conclusions are made in section four.
II. PROPOSED APPROACH
Taguchi method conducts n experiments in OA to investigate f factors concurrently. Suppose q responses are of main interest. The quality response is mainly divided into three main types; the larger-the-better (LTB), the smaller-the-better (STB), and the nominal-the-best (NTB) type responses. The proposed procedure for solving the multiple response problem is described in the following steps:
Step1: for each experiment in the OA, calculate the value S/N ratio,
ij, at experiment i for each response jusing an appropriate equation from the following formulas:
2 10
2 2
10
2 10
1
1
1
10 log ( ( ) for STB
10 log ( / ) for NTB,
1
10 log ( (1 / ) for LTB
i
K ir
ij i
K
ir
r
r
y K
s y i
y K
(1)
where
y
i and si are the estimated average and standarddeviation of yir replicates at the ith experiment. The K
denotes the number of replicates.
Optimal Parameter Design by Regression
Technique and Grey Relational Analysis
Step 2: Formulate the multi linear regression for response j using the calculated
ijin step 1. Then,obtain the
ijvalues for all factor level combinations. That is,j
= f (x1, x2, …, xf) (2)Step 3: Let zij
(
0
z
ij
1
)
represents the normalizedij for jth QCH at experiment i. Calculate the zij values
for each response using Eq. (3).
min
, ,max min
ij ij
ij
ij ij
z i j
(3)
The max
ij is the maximum value of
ij .The
min
ij is the minimum value of
ij . Then calculate
ijas follows:min max max
, ij
ij
i j
(4)
where
is the distinguishing coefficient ranges between zero and one; usually equals 0.5. Also, theij
is the difference of the absolute value between the ideal setting,
oj, and
ij. The
min and
max are the smallest and largest values of all the
ij from allresponses.
Step 4: Let
idenoted the grey relational grade for theith experiment from all q responses. Calculate
i using Eq. (5).
1
1
q
i i
j
i q
(5)Step 5: Let
lf denotes the average of
ivalues at levell of factor f. Calculate the
lf values for all factor levels. For each factor f decide the optimal level as the level that maximizes the
lf for this factor.Step 6: Compare the obtained results using the proposed approach with those obtained by other approaches in previous literature.
III. ILLUSTRATION
Three case studied, previously studied in literature, are adopted for illustrations.
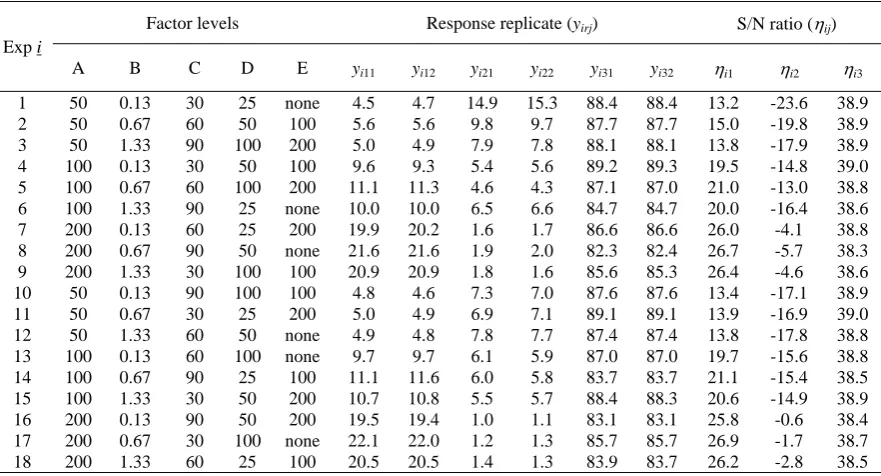
A. Optimization of the sputtering process parameter
Chen et. al [10] optimized the sputtering process parameters of GZO films using the grey–Taguchi method. The factors studied were (A) R.F. power, (B) sputtering pressure, (C) deposition time, (D) substrate temperature, and (E) post-annealing temperature. Three responses were of main interest including deposition rate (y1, LTB), electrical resistively (y2,
STB), and structural, morphological and optical transmittance (y3, LTB). The L18 array shown in
Table 1 was utilized in experimental work.
Step1: The
ij values were calculated for each response and the results are also displayed in Table1. Step 2: The multiple linear regression equations are obtained for the three responses. They are formulated as:1
= 10.378 + 0.079916A + 0.3899B + 0.00073C + 0.00127D + 0.000756E, R-Sq (adj) = 92.6%2
= - 27.641 + 0.105861A + 0.1834B + 0.00952C + 0.01925D + 0.010952E, R-Sq (adj) = 93.0%3
= 39.2060 - 0.0023569A - 0.05405B - 0.0046972C + 0.0010519D + 0.0005642E, R-Sq (adj) = 84.6%Step 3-5: The regression equations in step 2 are utilized to estimate the
ij for the5
3
full factorial design, which as factor level combinations. The zij andi
values are calculated for all combinations. Finally, the
lfvalues are calculated then displayed in Table 2.Step 6: From Table 2, the combination of optimal factor levels is identified as A3B1C1D3E3. The response
Table 1. The experimental results for case 1.
Table 2. Optimal factor levels for case study 1. Table 3. Optimal response values for case study 1. Exp i
Factor levels Response replicate (yirj) S/N ratio (ij)
A B C D E yi11 yi12 yi21 yi22 yi31 yi32 i1 i2 i3
1 50 0.13 30 25 none 4.5 4.7 14.9 15.3 88.4 88.4 13.2 -23.6 38.9 2 50 0.67 60 50 100 5.6 5.6 9.8 9.7 87.7 87.7 15.0 -19.8 38.9 3 50 1.33 90 100 200 5.0 4.9 7.9 7.8 88.1 88.1 13.8 -17.9 38.9 4 100 0.13 30 50 100 9.6 9.3 5.4 5.6 89.2 89.3 19.5 -14.8 39.0 5 100 0.67 60 100 200 11.1 11.3 4.6 4.3 87.1 87.0 21.0 -13.0 38.8 6 100 1.33 90 25 none 10.0 10.0 6.5 6.6 84.7 84.7 20.0 -16.4 38.6 7 200 0.13 60 25 200 19.9 20.2 1.6 1.7 86.6 86.6 26.0 -4.1 38.8 8 200 0.67 90 50 none 21.6 21.6 1.9 2.0 82.3 82.4 26.7 -5.7 38.3 9 200 1.33 30 100 100 20.9 20.9 1.8 1.6 85.6 85.3 26.4 -4.6 38.6 10 50 0.13 90 100 100 4.8 4.6 7.3 7.0 87.6 87.6 13.4 -17.1 38.9 11 50 0.67 30 25 200 5.0 4.9 6.9 7.1 89.1 89.1 13.9 -16.9 39.0 12 50 1.33 60 50 none 4.9 4.8 7.8 7.7 87.4 87.4 13.8 -17.8 38.8 13 100 0.13 60 100 none 9.7 9.7 6.1 5.9 87.0 87.0 19.7 -15.6 38.8 14 100 0.67 90 25 100 11.1 11.6 6.0 5.8 83.7 83.7 21.1 -15.4 38.5 15 100 1.33 30 50 200 10.7 10.8 5.5 5.7 88.4 88.3 20.6 -14.9 38.9 16 200 0.13 90 50 200 19.5 19.4 1.0 1.1 83.1 83.1 25.8 -0.6 38.4 17 200 0.67 30 100 none 22.1 22.0 1.2 1.3 85.7 85.7 26.9 -1.7 38.7 18 200 1.33 60 25 100 20.5 20.5 1.4 1.3 83.9 83.7 26.2 -2.8 38.5
Response
Initial condition A2B2C1D3E1
Grey analysis [10] A3B2C1D3E3
Proposed approach A3B1C1D3E3
y1 (LTB) 21.8055 22.1884 21.6571
y2 (STB) 1.6098 1.2510 1.2653
y3 (LTB) 85.7302 86.8512 87.1436
Factor Level
B. Optimization of turning operations
Lin [11] employed the Taguchi Method and grey relational analysis to optimize turning operation with multiple performance characteristics, including: tool life (y1, LTB), cutting force (y2, STB), and surface roughness
(y3, STB). Three turning controllable factors: (A) cutting
speed, (B) feed rate, and (C) depth of cut. The L9
orthogonal array is shown in Table 4. The ij values are
calculated for the three responses at all the nine experiments. The results are also displayed in Table 4. Then, the regression equations are estimated are found
1 = 80.221 - 0.08113A - 28.672B + 2.696C,
R-Sq(adj) = 86.7%
2 = - 43.650 + 0.009842A - 26.622B - 7.3871C,
R-Sq(adj) = 95.5%
3 = 6.397 - 0.00953A - 65.64B - 1.896C,
R-Sq(adj) = 73.8%
The
ij values are estimated for all3
3
(=27) factor level combinations. The zij and
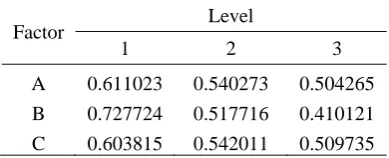
i values are then obtained forall combinations. Finally, the
lf values are estimated then tabulated in Table 5, where the combination of optimal factor levels is A1B1C1. Table 6 compares theresponse values at A1B1C1 with those obtained at initial
conditions and using grey analysis [11]. From this table, it is noted that the proposed approach and the grey relational analysis provide the same results.
C. Optimization of Inconel on machining of CNC WEDM process
Ramakrishnan et al. [12] modeled and multiple response optimization of Inconel 718 on machining of CNC WEDM process. Four process factors were investigated, including: (A) pulse in time, (B) delay time, (C) wire feed speed, and (D) ignition current, on two responses: (y1) material removal rate and (y2) surface
[image:4.595.323.518.105.184.2]roughness of wire electro-discharge machining (WEDM) process.
Table 5. Optimal factor levels for case study 2.
Factor Level
[image:4.595.310.537.226.309.2]1 2 3 A 0.611023 0.540273 0.504265 B 0.727724 0.517716 0.410121 C 0.603815 0.542011 0.509735
Table 6. Optimal response values for case study 2.
Table 7 displays the experimental results. Utilizing the i1
andi2 values in Table 7, the regression models for the
two responses are formulated as:
1 = 30.7153 + 6.1200A - 0.18435B - 0.07380C +
0.06063D, R-Sq(adj) = 96.1%
2 = - 8.57-2.15A + 0.254B - 0.0739C - 0.0878D,
R-Sq(adj) = 99.2%
The
ij, zij and
ivalues are estimated for all4
3
factor level combinations. Finally, the
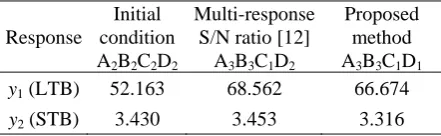
lfvalues are estimated then displayed in Table 8, where the combination of optimal factor levels is A3B3C1D1. Table 9 compares theresponse values at A3B3C1D1 with those obtained at initial
[image:4.595.119.478.606.750.2]conditions and using multi-response S/N ratio approach [12]. From this table, it is noted that the proposed approach provides almost similar results with the multiple response S/N ratio approach.
Table 4. The experimental results for case study 2. Response
Initial condition
A2B2C2
Grey analysis [11] A1B1C1
Proposed method A1B1C1
y1 (LTB) 1048.926 2689.147 2689.147
y2 (STB) 564.507 278.079 278.079
y3 (STB) 3.475 1.159 1.159
Exp. i
Factor Response (yij) S/N ratio
A B C yi1 yi2 yi3 i1 i2 i3
Table 7. Orthogonal array and the experimental results Exp. i A B C D y1 y2 i1 i2
1 0.6 4 8 8 46 3.2 46 3.2
2 0.6 6 12 12 48 3.3 48 3.3 3 0.6 8 15 16 42 3.3 42 3.3 4 0.8 4 12 16 56 3.8 56 3.8
5 0.8 6 15 8 50 3.4 50 3.4
6 0.8 8 8 12 52 3.2 52 3.2
7 1.2 4 15 12 70 4.2 70 4.2
8 1.2 6 8 16 74 3.8 74 3.8
9 1.2 8 12 8 64 3.4 64 3.4
Table 8. Optimal factor levels for case study 3
.
Table 9. Optimal response values for case study 3.
IV. CONCLUSIONS
This research proposed an approach for optimizing multiple quality responses using the regression models and grey relational analysis. Three case studies were provided for illustration, in all of which the proposed approach was found efficient. As a result, this approach can be effectively utilized for optimizing multiple quality responses in a wide range of applications on the Taguchi method. This approach also is found efficient for determining the global optimal combination of factor levels. Future research will apply this approach for determining optimal factor levels with fuzzy outputs.
REFERENCES
[1] G. Taguchi, Taguchi Methods. Research and Development. Dearborn, MI, American Suppliers Institute Press, 1991, Vol. 1. [2] A.R. Khoei, I. Masters, D.T. Gethin, “Design optimization of Aluminium recycling processes using Taguchi technique,”
Journal of Materials Processing Technology, 2002, 127, 96-106.
[3] M-H C. Li, A. Al-Refaie, and C.Y. Yang, “DMAIC Approach to Improve the Capability of SMT Solder Printing Process,”
IEEE Transactions on Electronics Packaging Manufacturing, 2008, 31(2), 126-133.
[4] A. Al-Refaie, “Optimizing SMT performance using comparisons of Efficiency between different systems technique in DEA,” IEEE Transactions on Electronics Packaging Manufacturing, 2009, 32(4), 256 – 264.
[5] H.C. Liao, Y.K. Chen, “Solving multi-response problem in the Taguchi method by DEA based ranking method. International,”
Journal of Quality & Reliability Management, 2002, 19 (7), 825-837.
[6] A. Al-Refaie, T. H. Wu, and M.H.C. Li, “DEA approaches for solving the multi-response problem in Taguchi method,”
Artificial Intelligence for Engineering Design, Analysis and Manufacturing, 2009, 23, 159-173.
[7] D.C. Montgomery, Design and Analysis of Experiments. John Wiley, 2009.
[8] A. Al-Refaie, “Grey-DEA approach for solving the multi-response problem in Taguchi Method,” Proceedings of the Institution of Mechanical Engineering-Part B. Journal of Engineering Manufacture, 2010, 224(B1), 147-158.
[9] A. Al-Refaie, M.H.C. Li, and K.C. Tai, “Optimizing SUS 304 wire drawing process by grey analysis utilizing Taguchi method,” Journal of University of Science and Technology Beijing, 2008, 15(6), 714-722.
[10] C.C. Chen, C.C. Tsao, Y.C. Lin, and C.Y. Hsu, “Optimization of the sputtering process parameters of GZO films using the Grey-Taguchi method,” Ceramics International, 2009, article in press.
[11] C.L. Lin, “Use of the Taguchi method and grey relational analysis to optimize turning operations with multiple performance characteristics,” Materials and Manufacturing Processes, 2004, 19(2), 209-220.
[12] R. Ramakrishnan, and L. Karunamoorthy, “Modeling and multiple-response optimization of Inconel 718 on machining of CNC WEDM process,” Journal of Material s Processing Technology, 207, 343-349.
Factor Level
1 2 3 A 0.503286 0.497314 0.598393 B 0.517335 0.526903 0.557841 C 0.573775 0.527449 0.497768 D 0.549350 0.529367 0.520275
Response
Initial condition A2B2C2D2
Multi-response S/N ratio [12]
A3B3C1D2
Proposed method A3B3C1D1
y1 (LTB) 52.163 68.562 66.674
[image:5.595.59.280.432.500.2]