111
Summarizing Relationships for Interactive Concept Map Browsers
Abram Handler,? Prem Ganeshkumar,†Brendan O’Connor?and Mohamed AlTantawy† Agolo†
New York, NY
College of Information and Computer Sciences? University of Massachusetts, Amherst
Abstract
Concept maps are visual summaries, struc-tured as directed graphs: important concepts from a dataset are displayed as vertexes, and edges between vertexes show natural language descriptions of the relationships between the concepts on the map. Thus far, prelimi-nary attempts at automatically creating con-cept maps have focused on building static summaries. However, in interactive settings, users will need to dynamically investigate par-ticular relationships between pairs of concepts. For instance, a historian using a concept map browser might decide to investigate the re-lationship between two politicians in a news archive. We present a model which responds to such queries by returning one or more short, importance-ranked, natural language de-scriptions of the relationship between two re-quested concepts, for display in a visual inter-face. Our model is trained on a new public dataset, collected for this task.
Code and data are available at:
https://github.com/slanglab/ concept_maps_newsum19
1 Introduction
Concept maps are visual summaries, structured as directed graphs (Figure 1). Important con-cepts from a corpus are shown as vertexes. Nat-ural language descriptions of the relationships be-tween concepts are shown as textual labels, along the edges on the map. Initial attempts to gener-ate English-language concept maps within natural language processing (Falke and Gurevych,2017) have focused on creating static diagrams which summarize collections of documents.
However, in interactive settings, users will want to query relationships with a concept map inter-face, rather than simply read over fixed output from a summarization system. For instance, in the concept map browser shown in Figure 1, a user
Slobodan Milosevic
United States
Richard Holbrooke
negotiated cease-fire with pressured
Kosovo Province revoked autonomy of Slobodan Milosevicrelated to:
- NATO
- Bill Clinton
[image:1.595.325.507.227.301.2]- Kosovo Province
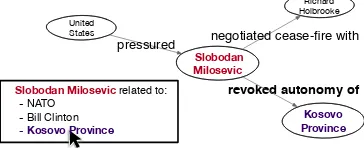
Figure 1: An example concept map browser. The sys-tem indicates that (t1)=“Slobodan Milosevic” is
re-lated to (t2)=“Kosovo Province.” The user clicks to
investigate the relationship, and the system must gen-erate a summary explaining how Milosevic is related to Kosovo.
has queried for the relationship between Milose-vic and Kosovo. An interactive system should include both concepts in a visual network, along with a labeled edge that summarizes their relation-ship (e.g. “Slobodan Milosevic revoked autonomy of Kosovo Province”).
This study is concerned with how to add such labeled summary edges to a map. Given a pair of input query concepts, denoted (t1) and (t2), we attempt to select the best extractive, natural lan-guagesummary statementwhich summarizes their relationship. Because there is no existing supervi-sion to guide such a selection, we collect a new dataset of annotated summary statements, which we use to supervise a new model for this task.
Our study thus presents a full system for sum-marizing the relationship between an arbitrary pair of query concepts, extending prior work on rela-tional summarization and concept maps (Falke and Gurevych,2017;Handler and O’Connor,2018).
2 Related work: relationship extraction
corpus that start with (t1) and end with(t2) and then (2) chooses the best summary statement from among these wellformed candidates. Handler and O’Connor(2018) show that extracting wellformed spans can find many more readable candidates than traditional relation extraction techniques. But they do not offer a method for the second step of picking a summary statement, which is the focus of this study.
We approach this new task of choosing the best summary statement from available candidates by collecting new supervision, tailored to the particu-lar problem of summarizing relationships on con-cept maps. This form of supervision has a differ-ent focus from the existing Falke and Gurevych (2017) concept map dataset. Where Falke and Gurevych (2017) seek to create the best overall concept map for a giventopic, this work seeks to find the best summary relationship for a given re-lationship. Therefore, unlikeFalke and Gurevych (2017), our dataset includes labels for the most readable and informative statement describing the relationship between a(t1)−(t2)query pair.
3 Overall technical approach
LikeHandler and O’Connor(2018), we approach the problem of finding a short relationship sum-mary statementwith a two-stage approach.
Stage 1: We identify candidate summary state-ments using Handler and O’Connor (2018)’s method, which returns the probability that a span of tokens beginning with (t1) and ending with (t2) reads as a fluid and coherent sentence when extracted from naturally-occurring text.1
(For brevity, we refer the reader to prior work for details, including discussion of why span extrac-tion is preferred to relaextrac-tion extracextrac-tion techniques). Table1provides examples of spans that do and do not make sense when extracted in this manner. We define all spans between(t1)and(t2)with a prob-ability of well-formedness greater than .5 to be the
candidate setfor the pair(t1) –(t2). A sample candidate set is shown in Table2.
Stage 2: In stage two, we choose the best sum-mary statement from the candidate set. We col-lect new annotation to supervise this decision. Our annotation procedure assigns a scoreα(s) ∈ {−3,−2, ...+3} to each s in a candidate set,
1We also allow statements which begin with(t2)and end
with(t1); the order of query concepts is important in inter-faces which display concept maps, but beyond the scope of this work. We limit statements to a max. of 75 characters.
Milosevic withdrew from Kosovo in 1999. Clinton spoke with Milosevic about Kosovo.
Table 1: Some spans (top) are plausible summary state-ments, because they make sense when removed from context sentences. Others spans (bottom) are not plau-sible summary statements because they don’t make sense when extracted from sentences. We use an ap-proach fromHandler and O’Connor(2018) to identify such spans.
which is intended to reflect how well s summa-rizes a particular relationship. We use this super-vision to train a model to predictα(s). We propose that the statement with the highest predictedα(s) score should be displayed on a concept map.
4 Candidate extraction
We approach the problem of summarizing rela-tionships for concept maps by collecting a new dataset of annotated summary statements, drawn from news stories focusing on the Balkan Penin-sula in the 1990s. Political scientists use rich news archives from this complex period to better under-stand conflict (Schrodt et al.,2001).
We create our dataset from New York Times
articles (Sandhaus, 2008) published from 1990– 1999, which mention at least one country from the Balkans. Following prior work on relational summarization, for each country, we use the pack-age phrasemachine(Handler et al., 2016) to identify the 100 highest-frequency noun phrases within articles which mention that country.2 The phrasemachinepackage uses a regular expres-sion over part of speech tags to efficiently ex-tract noun phrases, a useful syntactic category which includes both named entity spans (e.g. Boris Yeltsin) as well as other concepts (e.g. peace treaty). From all non-empty pairs of highest-frequency concepts, we sample a total of 689 pairs with more than two extracted candidates. In to-tal there are 5,214 candidate statements across 689 sampled sets.3 On average there are 7.56
state-2https://github.com/slanglab/ phrasemachine
3
Additional notes. The countries are: Kosovo,
Alba-nia, Serbia, Croatia, Montenegro, MacedoAlba-nia, Bulgaria, Ro-mania, Moldova and Bosnia. (We exclude the former Yu-goslavia; its landmass included other countries on our
cor-pus). phrasemachine sometimes returns overlapping
be-A1 A2 A3
s1General Grachev’s favor is his loyalty toMr. Yeltsin - W
-s2Mr. Yeltsinopenly accusedGeneral Grachev - -
-s3General Grachev, Defense Minister by dint of his loyalty toMr. Yeltsin W - W
s4General Grachev’s plea today will do nothing to helpMr. Yeltsin - -
-s5Mr. Yeltsinmight also appear weak if he had to replaceGeneral Grachev B B B
Table 2: A candidate set for(t1)= “Mr. Yeltsin” and(t2)= “General Grachev,” along with decisions from three
annotators (A1, A2 and A3) selecting the best (B) and worse (W) summary statement in the set. All annotators agree thats5is the best, soα(s5)=3. (During annotation, the order of all sets was randomized).
ments per set(σ= 10.6).
5 Candidate annotation
5.1 Method
Some candidate sets in our dataset are easy for a person to judge and rank. For instance, it is possi-ble to quickly read over the small set shown in Ta-ble2and identify statements which are clearly bet-ter and clearly worse synopses of the relationship between “General Grachev” and “Mr. Yeltsin”.
However, other candidate sets in our dataset are too large and too complex to read and analyze quickly. (The largest candidate set in our dataset contains 143 statements in total). We accommo-date both large and small sets with a “low-context” (Falke and Gurevych,2017) annotation technique. We split candidate sets into one or more subsets, and ask annotators to rank the best and worst sum-mary statements in each subset. Then we aggre-gate these local judgements about the best and worst candidates within each subset to create a global score. This global score, α(s), attempts to capture the overall quality of a given summary statements.
This method of soliciting local judgements about subsets and then aggregating into an over-all score is known as Best-Worst Scaling ( Lou-viere,1991). Best-Worst Scaling has been shown to make more efficient use of human judgements for a natural language task than traditional tech-niques (Kiritchenko and Mohammad,2017).
5.2 Details of Best–Worst annotation
We present all candidate sets to three different non-native English speakers, hired via a profes-sional annotation firm. All annotators completed graduate work in either linguistics or the humani-ties, and were based in the Middle East. For each
tween sets. We exclude pairs which are very obviously un-related to the Balkans (e.g.ChinatownandLittle Italy). Our annotation budget determined the number of annotated sets.
annotator, we divide each candidate set intoJ ran-dom tuples (a tuple consists of up to eight candi-date statements), and ask the annotator to choose the best and worst from each tuple. Annotators are instructed that the best statement should be the one that both sounds the most natural and that most helps them understand the history and pol-itics of the Balkan region. They are instructed that the most unnatural sounding and least infor-mative statement should be chosen as worst. In total, each candidate statement is shown to each annotator exactly once.4 After annotators have judged each individual set, we aggregate with Orme(2009)’s counting formula: we set the score
α(s)∈ {−3,−2, . . . ,+3}of each summary state-mentsto be the number of timesswas chosen as the best, minus the number of times it was chosen as the worst.
Following prior work (Kiritchenko and Moham-mad, 2017), we evaluate inter-annotator agree-ment via split-half reliability. For each candidate set, we randomly split annotators into two groups, and compute the score for eachsusing each group of annotators. Then we compute the Spearman correlation (ρ) between the two sets of scores, yielding an average ofρ= 0.495across 1000 ran-dom splits.
6 Modeling
The previous section describes a procedure for as-signing a score,α(s)for eachsin our dataset. We use these scores to train a model,p(α(s)|s). Dur-ing modelDur-ing, we divide the dataset into trainDur-ing and test sets at the entity level, ensuring that there
4
are no relationships between concepts in the train-ing and test set. Ensurtrain-ing that there are no rela-tionships shared across sets is important because a model might use knowledge about relationships gleaned from training data (e.g. Milosevic led Ser-bia) to make inferences about relationships in the test data (e.g. Milosevic led the Serbian Socialist party). 627 candidates are used for training; the remaining 62 are for testing.5
We model p(α(s)|s) using ordinal regres-sion, implemented with the MORD package (Pedregosa-Izquierdo, 2015). We use unigram features, morphological features, part-of-speech-tag features and binary features (e.g. s includes punctuation mark) to represent the candidate state-ment. Handler and O’Connor (2018)’s method (§4) returns a probability that a summary state-ment is grammatically wellformed. We include this probability as a feature in our model. We also include the token length of a summary state-ment as a feature. We tune MORD’s regulariza-tion penalty parameter to maximize 5-fold, cross-validated Spearman’sρusing the training set.6
6.1 Evaluation and analysis
We use the test set to measure the extent to which our model’s predictions correlate with gold scores, achieving a Spearman’s ρ = 0.443between our model’s predictions and the gold scores. This is close to theρ= 0.495computed to measure inter-annotator agreement (§5.2).
We instructed annotators to select summary statements that were both informative and gram-matically wellformed. We use the probability of grammatical well-formedness from the candi-date detection method (§4) as a feature in our model. This measure appears to partially reflect annotator judgements: there is a Spearman’sρ = 0.154between the two metrics across the dataset. Research into human perceptions of grammati-cal well-formedness (Sprouse and Sch¨utze,2014; Warstadt et al., 2018) could be applied to make
5
To implement the train–test split, we form an initial pro-visional division of concepts into two sets. For all relation-ships between concepts that cross the two sets, we move the entity from the test set to the training set. All scored summary statements between concepts in the training set are used for training; the remainder are for test. We manually tune the size of the initial split so that 10% of concepts are in the final test set.
6We examine10ifori=−3,−2..2,3and use101.
Ad-ditionally, the MORD API implements several variants of or-dinal regression. We use the LogisticSE variant because it achieves the highest cross-validatedρon the training set.
better predictions in the future.
Model Spearman’sρ
p(α(s)|s)(Ordinal regression) 0.443
Logistic regression 0.304 Inter-annotator agreement 0.495
Table 3: Spearman’sρfor our ordinal regression model
p(α(s)|s), compared both to the inter-annotator agree-ment and a simpler logistic regression model.
Predicting annotator perceptions of informa-tiveness is more challenging. For instance, anno-tators preferred “Mr. Milosevic has been formally charged with war crimes” (α(s) = 3) to “Presi-dent Slobodan Milosevic may be indicted for war crimes”(α(s) = 1). The former expresses a com-pleted action which arguably entails the latter, hy-pothetical action. How to best model (Bowman et al., 2015), formalize (MacCartney and Man-ning, 2009) and even study (Gururangan et al., 2018) such complex semantic relationships is an unsolved problem in NLP.
We use the number of tokens in a summary statement (subtracting out the length of query con-cepts) as a feature. We observe a Spearman’s
ρ = .337betweenα(s) and the token length of
s. We hypothesize that this feature might serve as a very coarse proxy for informativeness: although not instructed to do so, annotators might choose longer statements ahead of shorter statements be-cause they express more about the Balkans.
7 Conclusion
We extend prior work focused on finding candi-date summary statements (Handler and O’Connor, 2018) and constructing concept maps for an over-all topic (Falke and Gurevych,2017), by present-ing a complete system for summarizpresent-ing the rela-tionship between an arbitrary pair of query con-cepts. Our method learns a model for select-ing statements that best summarize relationships, which is supervised with a new, annotated re-source for the task. We find that shallow cues like statement length and grammatical wellformedness are helpful for identifying good summary state-ments, but also that representing deeper semantic relationships (e.g. entailment) remains an ongo-ing challenge for automatically buildongo-ing concept maps.
sum-marization (Hermann et al., 2015; Grusky et al., 2018). We gather human judgements of salience and well-formedness (in our case, judgements are expressed via Best-Worst Scaling), and then train a model to best replicate such judgements. Be-cause such supervision is costly and difficult to collect, carries risks of annotation artifacts ( Gu-rurangan et al., 2018) and might transfer poorly to new domains, in the future, we plan to explore if other forms of based supervision and task-based evaluation (Jing et al.,1998) may be better suited to the specialized task of automatic concept map summarization. For instance, instead of ask-ing a human to identify better and worse summary statements, we might examine how well a user (or model) presented with summary statement s can answer if other summary statementss0 are true or false. If someshelps identify many other trues0, thensis (potentially) a good summary. We look forward to examining this idea in future work, fol-lowing recent studies of question-based evaluation for the summarization task (Eyal et al.,2019).
8 Acknowledgement
Thanks to Haw-Shiuan Chang, Tu Vu and Kalpesh Krishna for helpful comments on earlier drafts of this work. Thanks to the anonymous review-ers for their helpful suggestions, in particular for pointing out possible connections between rela-tionship summarization and joint extraction of re-lations and entities.
References
Samuel R. Bowman, Gabor Angeli, Christopher Potts, and Christopher D. Manning. 2015. A large anno-tated corpus for learning natural language inference.
InEMNLP.
Matan Eyal, Tal Baumel, and Michael Elhadad. 2019. Question answering as an automatic evaluation met-ric for news article summarization. InNAACL.
Tobias Falke and Iryna Gurevych. 2017. Bringing structure into summaries: Crowdsourcing a bench-mark corpus of concept maps. InEMNLP.
Max Grusky, Mor Naaman, and Yoav Artzi. 2018. Newsroom: A dataset of 1.3 million summaries with diverse extractive strategies. InNAACL.
Suchin Gururangan, Swabha Swayamdipta, Omer Levy, Roy Schwartz, Samuel Bowman, and Noah A. Smith. 2018. Annotation artifacts in natural lan-guage inference data. InNAACL.
Abram Handler, Matthew Denny, Hanna Wallach, and Brendan O’Connor. 2016. Bag of what? simple noun phrase extraction for text analysis. In Proceed-ings of the First Workshop on NLP and Computa-tional Social Science.
Abram Handler and Brendan O’Connor. 2018. Re-lational summarization for corpus analysis. In NAACL.
Karl Moritz Hermann, Tom´as Kocisk´y, Edward Grefenstette, Lasse Espeholt, Will Kay, Mustafa Su-leyman, and Phil Blunsom. 2015. Teaching ma-chines to read and comprehend. InNIPS.
Hongyan Jing, Regina Barzilay, Kathleen McKeown, and Michael Elhadad. 1998. Summarization evalu-ation methods : Experiments and analysis. InAAAI Spring Symposium.
Svetlana Kiritchenko and Saif Mohammad. 2017. Best-worst scaling more reliable than rating scales: A case study on sentiment intensity annotation. In ACL.
J.J. Louviere. 1991. Best-worst scaling: A model for the largest difference judgments. Technical report, University of Alberta.
Bill MacCartney and Christopher D Manning. 2009. An extended model of natural logic. InProceedings of the eighth international conference on computa-tional semantics.
Bryan Orme. 2009. Maxdiff analysis: Simple count-ing, individual-level logit, and hb. Technical report, Sawtooth Software.
Fabian Pedregosa-Izquierdo. 2015. Feature extraction and supervised learning on fMRI : from practice to theory. Theses, Universit´e Pierre et Marie Curie -Paris VI.
Evan Sandhaus. 2008. The New York Times An-notated Corpus. Linguistic Data Consortium, LDC2008T19.
Philip A Schrodt, Deborah J Gerner, Rajaa Abu-Jabr, Oemeur Yilmaz, and Erin M Simpson. 2001. Ana-lyzing the dynamics of international mediation pro-cesses in the middle east and balkans. In Annual Meeting of the American Political Science Associa-tion.
John Sprouse and Carson Sch¨utze. 2014. Research Methods in Linguistics, chapter Judgment Data. Cambridge University Press, Cambridge, UK.