Automatic Visual Inspection of Bump in
Flip Chip using Edge Detection with
Genetic Algorithm
M. Fak-aim, A. Seanton, and S. Kaitwanidvilai
Abstract—This paper presents the development of an
automatic visual inspection machines for inspecting the soldering points (called as “Bump”) in a “Flip- Chip” component which is an important part of a hard disk drive (HDD). Image feature extraction is used to measure the interesting features such as bump area, bump ratio, and etc. from the X-ray input image. Accuracy of the proposed measuring system is verified by comparing with the measured value from the destructive inspection. Genetic Algorithm are used to detect the edge of bump. Experimental results show that our proposed developed inspection machine is effectively used for bump inspection.
Index Terms— Image processing, Visual inspection,
Genetic algorithm, Edge detection
I. Introduction
Thailand is one of the largest exporter countries hard disk products with an export value of more than 400 million baht by the year. In our country, HDD industry has a relatively short but fascinating history. In the past decades, the HDD storage capacity is increased from only 5 MB of data to be more than 100 GB. This enormous growth was made possible by developments in diverse fields of knowledge including materials, mechatronics, tribology, signal processing and electronics. HDD is composed of many components such as flip-chip, HDD arm, spindle motor, and etc. The quality of HDD components influences the overall hard disk drive quality. To ensure the quality of such components, many inspections and testing are performed. Visual inspection is one of the most important inspections in quality assurance of HDD industry. It ensures that all components are standard size and results in good quality for hard disk settings. Normally, this inspection is carried out by a skilled inspector; however, there are some drawbacks with the human inspector such as human error, time consuming,
Manuscript received January 20, 2008; review February 14, 2008. This work was supported in part by the HDD Cluster, NECTEC and , the working test is provide by Belton Industrial (Thailand) ltd.
M. Fak-aim is with the Faculty of Engineering, Naresuan University, Muang,Phitsanulok,65000,Thailand (e-mail: [email protected]). A. Seanton is with the Faculty of Engineering, Naresuan University, Muang,Phitsanulok,65000,Thailand(e-mail: [email protected]). S. Kaitwanidvilai is with the Faculty of Engineering, King Mongkut's Institute of Technology Ladkrabang, Bangkok 10520,Thailand(e-mail:[email protected]).
and etc. In the past decades, many immense developments in automatic visual inspection machines have been done and the results of those are used extensively in today's industrial process inspection. To inspect the physical shape of the component in HDD, mostly, a high resolution camera is used as a video capture device and the inspection is carried out by human. In some cases, X-ray camera is used instead of CCD camera for inspecting the component. The effectiveness of such inspection is mainly depended on the skill of inspector. Unfortunately, there are many problems caused by human inspection such as the unskilled inspectors, human errors, time consuming, and etc. To overcome these problems, this research aims to study and provide solutions to the primary problems in visual inspection. In this paper, we developed an automatic visual inspection machine for inspecting bumps in a Flip-Chip component. The developed machine enhances the visual inspection system and solves the significant problems caused by human inspection. The accuracy of the proposed technique is investigated in comparison with the measured value from the destructive inspection. As shown in experimental results, the proposed machine has good accuracy for inspecting bumps in Flip-Chip. The remainder of this paper is organized as follows. Automatic visual inspection and proposed image processing is described in section 2. The experimental results are shown in section 3. And, finally, in section 4 the paper is summarized with some final remarks.
II. Automatic Visual Inspection Machine
A. Developed Visual Inspection Machine
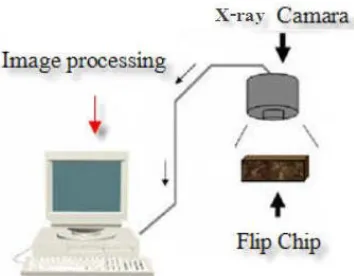
Fig.1. Developed Visual Inspection Machine.
[image:2.595.332.506.229.308.2]An example of X-ray image used as a raw image of our propose algorithm is shown in Fig. 2. In our developed algorithm, positions and specified properties of all bumps are automatically detected.
Fig. 2. An example of X-ray image.
Fig. 3. Block diagram of the proposed algorithm.
A raw image from the X-ray camera is RGB image. In our proposed algorithm, Initially the RGB image is converted to a gray image. Next, Image edge determination method combined with GA, gray image converted to binary image, the image feature extraction technique is adopted to determine the interesting
properties of the bumps such as bump's minor axis length, bump area, bump ratio, and etc.
B. Edge detection [6]-[8] Sobel edge detection
The Sobel edge detection masks look for edges in both the horizontal and vertical directions and then combine this information into a single metric are given in [2]. In other words, The Sobel detector uses the gradient operators along the x and y direction to compute the gradient magnitude are given in [5]. Horizontal and vertical masks are as follow:
Fig. 4. Show masks edge detection using the sobel.
These Masks are designed to respond maximally to edges running vertically and horizontally relative to the pixel grid, one Mask for each of the two perpendicular orientations. The Mask can be applied separately to the input image, to produce separate measurements of the gradient component in each orientation (known as Mx
and My). These can then be combined together to find the
absolute magnitude of the gradient at each point and the orientation of that gradient are given in [11],[12]. Fig.5. shows the neighborhood pixel to describe the Sobel Operator concept.
Z1 Z2 Z3 Z4 Z5 Z6 Z7 Z8 Z9 Fig.5. Show mask edge detection
These masks separately convolved with the image and produce two numbers at each pixel location,
fx and fy. We use this numbers to calculate the edge
magnitude and direction. It is shown in (1) and (2).
( )
2 2y x f f f
magn∇ = + (1)
where magn( )∇f is the magnitude of the vector which is much faster to compute.
( )
⎟⎟⎠ ⎞ ⎜⎜ ⎝ ⎛ =
∇ −
fx fy f
dir tan 1 (2)
where dir( )∇f is the direction of the gradient vector fx is edge gradient of x direction.
[image:2.595.76.285.382.641.2]C. Feature Extraction
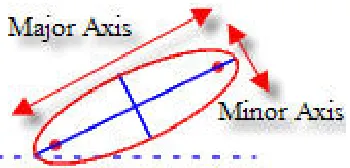
Features are used to represent the shape or character of an interesting pattern in the object recognition. In this paper, the image features such as area, eccentricity, angles are used to identify the completeness of bump in Flip-Chip. For example, area is used as the one of specifications of bump. Eccentricity is the ratio of the distance between the foci of the ellipse and its major axis length. Fig. 6 shows the example of the eccentricity ratio. As seen in this figure, the processing will count the pixel for determining the area and also the major and minor axis length (pixel connected in the direction of major and minor axis). The ratio of these two axis lengths is the “Eccentricity”. For the area value, the image processing will only count the pixel connected in the same object. The details of feature extraction are given in [9]. In this paper, 4 features; eccentricity, no of cavity in bump, and area of cavity are used to find the completeness of bumps.
[image:3.595.313.535.246.442.2]
Fig. 6. Example of feature, major and minor axis.
D. Genetic Operators
This section briefly reviews GA which has the central concept of chromosomes and the genetic operations of crossover, mutation and reproduction. Usually, individuals or chromosomes in GA are the unknown parameters that attempt to be evaluated for the optimal value. Genetic algorithms are well known as a biologically inspired class of algorithms applicable to any nonlinear optimization problem. This algorithm applies the concept of chromosomes and the operations of crossover, mutation, and reproduction. A chromosome is an individual sample in a population. Each individual is assigned a fitness based on evaluation and objective functions. At each step, called generation, fitness values of all individuals in a population are calculated. Individual with maximum fitness value is retained as a solution in the current generation and passed to the next generation. Individual samples in the genetic population are coded in binary. For real numbers, decoding binary to floating-point number is used [2].
In this paper, total current edge detection is used in the objective function of GA. The optimization problem is to find the optimal filter or a mask size of 3x3 ,z1…..z9 in order that the total current error of measurement is minimized and the given desired edge detection image is also achieved. In this paper, following parameters are defined before applying genetic algorithm.
Fig. 7 shows the concept of GA operators. To form a new population of the next generation, crossover, mutation, and reproduction are used. Crossover randomly selects a site along the length of two chromosomes, and then splits the two chromosomes at the crossover site. New chromosomes are then formed by matching the head of one chromosome with the tail of the other. Mutation forms a new chromosome by randomly changing a single bit in the chromosome. Reproduction forms a new chromosome by copying the old chromosome. Chromosome selection in genetic algorithms depends on the fitness value. High fitness means a high chance of being selected. Mutation, reproduction or crossover depends on the pre-specified operation’s probability.
Fig. 7. Genetic algorithm operator.
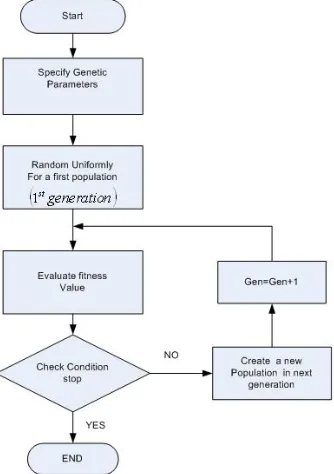
Fig. 8 shows the flow of the proposed technique. The stopping condition, in this paper, is specified by a maximum generation. The algorithm is summarized as follows ;
Step 1 Specify the genetic parameters such as genetic operator’s probability, size, maximum generation, Mask matrix 3*3
Step 2 Create a population in the first generation by uniform random. For the first generation, Gen = 1
Step 3 Evaluate the fitness value of each chromosome using (3). Select the chromosome with maximum fitness value as a solution in the current generation.
Step 4 While the current generation is less than the maximum generation, create new population using genetic operators, If the current generation is the maximum generation, stop,
Step 5 Increases the generation by 1. Go to step 3. The chromosome which has the maximum fitness value is kept as the optimal solution.
Equation fitness
(
)
∑
= − +
= k
n abscross tionn majorlengthn
fitness
1 _sec 0.001
[image:3.595.94.269.311.395.2]Where cross-section = true measurement cross section
bump (µm), major length = measurement of proposed
[image:4.595.310.536.70.300.2]technique (µm), k = number of image
Fig. 8. Flowchart of genetic algorithm
III. Experimental results
[image:4.595.98.265.120.357.2]To verify the effectiveness of the proposed algorithms, some experiments were performed. Accuracy of the measurement is verified by using the measured data from the bump's cutting machine. Fig. 9 shows the measured values of width of bumps measured by destructive inspection. In this inspection, bump is cut and then measures the interesting values such as heights, width, and etc. However, this inspection is not suited for the bump inspection because the component under test will be destroyed in the inspection process. In this paper, we only use this data for verifying the accuracy of the proposed algorithm. As shown in Fig. 9, we can convert the measured values into pixel values or vice versa by using the value of camera's resolution. In this paper, the calculated resolution of the X-ray camera is 0.000125 inch/pixel. Six images are used for validation.
Fig. 9. the measured values of width of bumps by destruction inspection.
We select parameters of GA, their ranges, and genetic algorithms parameters as follows:
Mask(Mx)
z1,z7
∈
[0.2,0.7], z2,z5,z8∈
[0], z3,z9∈
[-0.2,-0.7], z4∈
[0.5,0.99], z6∈
[-0.5,-0.99]Mask(My)
z1,z3
∈
[0.3,0.7], z2∈
[0.5,0.99], z4, z5,z6∈
[0], z7,z9∈
[-0.3,-0.7], z8∈
[-0.5,-0.99]Population size = 30, crossover probability = 0.6, mutation probability = 0.05, maximum generation = 20, and reproduction probability = 0.35 generations are run by genetic algorithm.
Result in fitness determination in edge detection showed trend of graph to the 18th generation which were
an optimum fitness.
[image:4.595.308.531.554.721.2]Running of GA showed an optimized fitness as in such image Fig 10. fitness = 1.9590
Mask Mx = 0.6215, 0.9474 My = 0.6585,
0.5538, Then mask was continued for edge detection.
0.6215 0 -0.6215 0.9474 0 -0.9474 0.6215 0 -0.6215
Mx
0.6585 0.5538 0.6585 0 0 0 -0.6585 -0.5538 -0.6585
My
[image:5.595.315.529.104.269.2]Fig. 11. mask from GA method
Table I
Results of measurement using GA Cross
section (µm)
Proposed (µm)
A 205.23 182.88 D 193.29 192.53 F 204.72 167.89
[image:5.595.100.247.120.380.2]Table II shows the bump’s determination using parameter substitution in mask of 3 x 3 for image edge determination.
Table II
Results of measurement using parameter substitution in mask for image edge determination.
Cross section (µm)
Proposed (µm)
B 212.59 167.38 C 204.47 174.75 E 220.72 196.85 G 176.42 161.34 H 181.57 169.59
Cross-section image of a real bump is shown in the table and a measured result shown in Fig 13. The image edge determination method combined with GA gave a closer value of length than the original method which used a feature technique to determine bump length by comparing pixel ratio and then transformed to micrometer unit as shown in Table III
Table III
Results of measurement methodusing the GA, Canny and Sobel methods
Cross section (µm)
Proposed (µm)
Canny (µm)
Sobel (µm)
A 205.23 182.88 161.79 160.27 B 212.59 167.38 132.84 132.58 C 204.47 174.75 155.70 155.19 D 193.29 192.53 181.86 173.73 E 220.72 196.85 190.75 186.18 F 204.72 167.89 151.63 142.49 G 176.42 161.34 142.91 138.39 H 181.57 169.59 151.12 140.76
Table IV
results show corrective percentage % corrective % Error
[image:5.595.96.252.479.603.2]GA Canny Sobel GA Canny Sobel A 89.10 78.83 78.09 10.89 21.16 21.90 B 78.73 62.48 62.36 21.26 37.51 37.63 C 85.46 76.14 75.90 14.53 23.85 24.09 D 99.60 94.08 89.88 0.39 5.91 10.11 E 89.18 86.42 84.34 12.31 13.57 15.65 F 82.01 74.06 69.60 17.99 25.93 30.39 G 91.45 81.00 78.44 8.55 19 21.56 H 93.4 83.22 77.52 6.56 16.78 22.48
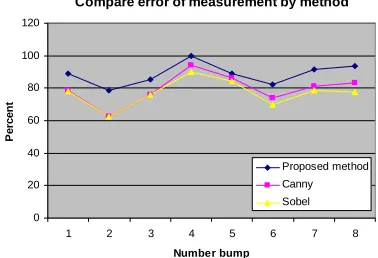
Fig 12 and Table IV results showed a higher corrective percentage in size determination when compared to Sobel and Canny method.
Compare error of measurement by method
0 20 40 60 80 100 120
1 2 3 4 5 6 7 8
Number bump
P
er
cen
t
Proposed method Canny Sobel
Fig. 12. Measured values and %error of bump’s major axis length.
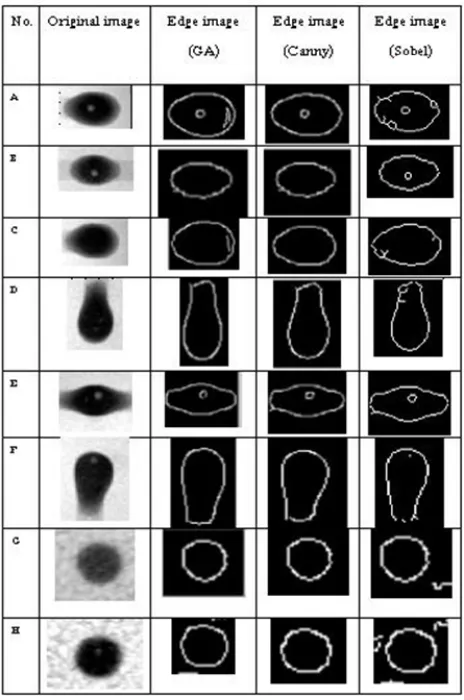
Fig 13 shows results of image edge detection using various methods. The Image edge of the presented method, when characterized in vertical scale showed less errors and more complete image edge than the Sobel method and comparative to the Canny method.
[image:5.595.325.514.518.647.2]Fig. 13. Showed results of edge determination of each method.
Fig. 13 shows raw image and results of edge determination of each method. evaluated by the proposed image processing. In our experiment, we select eight bumps in this figure to implement on the proposed inspection. Accuracy of the width of bump measured by the proposed technique is first investigated. The measured values of the width of each bump using destructive inspection are used as the real values for comparisons. Table V shows examples of inspection and accuracy of measured value in the proposed technique. As shown in this table, the maximum error is about 21% which is acceptable for this application.
IV. Conclusion
In this paper, an expert system for inspecting the completeness of bump is proposed. The accuracy of the proposed measurement system is proven by comparing with the measured values from the destructive inspection. Although the accuracy of destructive inspection is high; however, this inspection is unsuitable in practice. The main drawbacks of such inspection are that the object under test will be destroyed and the process is time consuming. Thus, nondestructive inspection by our developed machine significantly improves the inspection process. In our proposed technique, Genetic Algorithms is used to detect the edge of bumps based on the accumulated experience of inspector. Many experiments
were performed and the results show that our proposed algorithm can increase efficiently apply to the bump inspection process.
Acknowledgements
This research work is financially supported by the HDD Cluster, NECTEC and , the working test is provide by Belton Industrial (Thailand) ltd.
References
[1] J. Canny, “A Computational Approach to Edge Detection,” IEEE Trans. Pattern Analysis and Machine Intelligence, vol. 8, pp. 679-698, 1986.
[2] Yoshimura, M. and Oe, S., “Edge detection of texture image using genetic algorithms” SICE '97. Proceedings of the 36th SICE Annual Conference. International Session Papers,29-31 July 1997 Page(s):1261 – 1266
[3] Lo Bosco, G. “A genetic algorithm for image segmentation”, Image Analysis and Processing, 2001.Proceedings. 11th International Conference on,26-28 Sept.2001 Page(s):262 - 266 [4] Wang Luo, “Comparison for Edge Detection of Colony
Images” IJCSNS International Journal of Computer Science and Network Security, VOL.6 No.9A, September 2006,pp.211-215
[5] C M Ng', W. N Leung, F Chun, “Edge Detection using Evolutionary Algorithms”
[6] Rafael C.Gonzalez, Richard E. Woods“Digital Image Processing”
[7] Alasdair McAndrew, “Introduction to Digital Image Processing with Matlab”
[8] http://pami.uwaterloo.ca/tizhoosh/set.htm [9] www.mathworks.com/products/image/ [10] http://homepages.inf.ed.ac.uk/rbf/HIPR2/
[11] J.Climent, A.Grau, J.Aranda, A.B.Martinez. “A high precision operator to determine edge orientation” UKACC International Conference on CONTROL '98, 1-4 September 1998