ISSN: 1816-949X
© Medwell Journals, 2019
The Use of Methane Utilizing Bacteria in Reducing Global Warming
1
Nassir Abdul Hussein Al-Hindawi and
2Lewis R. Brown
1
Department of Microbiological Sciences, Al-Nisoor University College, Baghdad, Iraq
2
Department of Biological Sciences, Mississippi State University, Starkville, Mississippi, USA
Abstract: The global warming is attributed to greenhouse gases including methane gas, produced naturally and by human activities. Such gases trap heat, causing Earth fever. It is witnessed by continuous increases of such gases in the atmosphere by glacier retreating, collapsing ice shelves, melting of ice and snow, increasing precipitation, rising of seal level and changes in flora and fauna habitats. Methane is known to affect the ozone layer 20-30 times the effect of carbon dioxide and is increasing. Presently, Earth’s atmosphere contains 5 ppm methane and increasing. Sources of methane, like soil over subterranean hydrocarbons all over the world, rice fields, swamps and the like could be limited by growing a special methane oxidizer, methanomonas methanoxidans such surfaces. In our research, we have found that this bacterium will consume over 8.5 L of methane per square meter per day and continued steadily for the 4 month period studied. Consumption of methane was nearly the same using the potting soil and soil-sand mixture, whether natural or sterilized. When bacterial flora persisting in potting soil with the Methanomonas sp were isolated and added (107 cells/g soil) there was no effect of consumption of methane by the Methanonomanas sp. Natural elements in soil remained adequate before and after growth period of 4 months. Viability and consumption of methane at different temperatures is still under study. We would like to extend the project by studying the effect of seasonal fluctuations in temperature on viability and methane consumption at different season.
Key words: Bacteria, methane, reduction, utilization, global warming, seasonal fluctuations INTRODUCTION
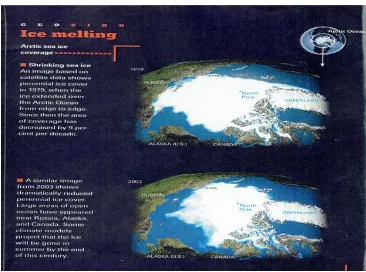
Scientists at the national panel on climate, predicting that average global temperature could increase between 1.4 and 5.8 °C by the year of 2100, that include rising in sea level due to the melting of polar ice caps with severe weather events. There is an early collapse of the Arctic sea ice (Borgeson et al., 2015) the rising temperature and its effect are indicated in Fig. 1 and 2 (Bender and Conrad, 1992).
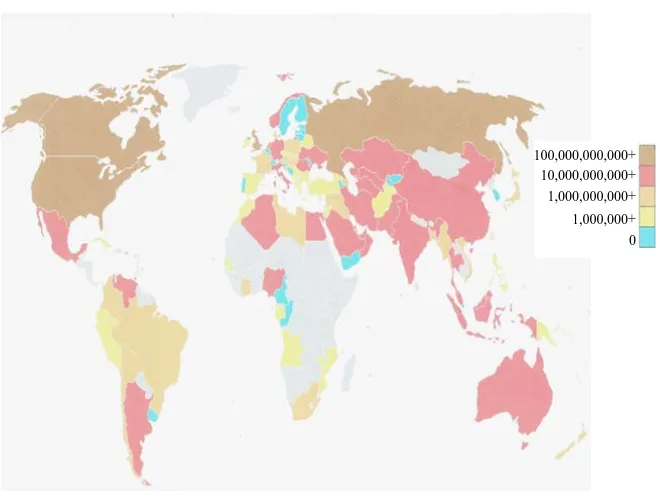
The International Panel on Climate Change (IPCC) emphasized, since, 2001 that the global temperature is shooting up faster than other times in the past 1000 years. Carbon dioxide continues to rise and temperature increases 3 °F. by the end of the century, driving earth worldwide fever. Snow and ice reflect a lot of solar energy and as heat melt snow and ice, less sunlight is reflected into space (Lyon, Fenstormaker and Schenger, W.H.) satellite (Fig. 3-5) show the drifting ice into the sea. The global presence of methane is pictured in the map (Bender and Conrad, 1992).
Many cities at the shores will be under water. The 10 million people have to move to higher grounds (Bull et al., 2000). There will be tremendous changes in biosphere, mosquitoes carrying viruses, birds, plants and animals retreat to move to higher latitudes (Chanton and Liptay, 2000).
The National Geographic Magazine published by Jin et al. (1999) an study stating “The Big Thaw”, it is no surprise that a warming climate is melting the world’s glaciers and polar ice but no one expected it to happen this fast, (Michel Welsh).
The trapping gases (CO2-CH4 and nitrogenous substances) are increasing in the atmosphere, causing climbing mercury (Borgeson et al., 2015). Abundant liquid water now discovered underneath the world ice sheaths. Satellite images pictured the sheets with deep crack and fragmented ice and collapsing ice shelves. The surface of ice sheet is dropping 5 ft every year. It is estimated 23 m2 of water runs off each year from Alaska. The great ice sheets may slide into the sea and raise sea level. If the west Antarctica ice sheets were to disappear, sea level would rise up to 35 inches. The East Antarctica sheet could rise sea level globally by 170 ft, thus, the addition of 213 ft to level of world’s oceans (Stem, P.C) (Gulledge and Schimel, 1998; Digestive Ferments Company Difco Labora, 2018).
Most of the planet, precipitation is increasing, mountain streams are running dry, Spring is arriving earlier, Autumn is coming later, Winter is becoming shorter, ice is melting on land and sea, snowflakes are declining, habitat are changing. Amphibians are disappearing. Cloud forests are drying (Michael Welsh). The effects are attributed to carbon dioxide, methane,
J. Eng. Applied Sci., 14 (Special Issue 6): 9482-9490, 2019
Fig. 1: Temperature rising temperature
Fig. 2: Temperature rising and ice melting
nitrous oxide (Laughing Gas), chlorine compounds and Freon which react with ozone layer in the atmosphere. The main sources of methane are listed in Table 1 (Chanton and Liptay, 2000).
[image:2.612.123.489.370.642.2]J. Eng. Applied Sci., 14 (Special Issue 6): 9482-9490, 2019
Fig. 3: Earth’s presence of methane gas
Fig. 4: (a) Satellite photos shows drifting ice from the sea and (b) Satellite photos shows drifting ice into the sea
Table 1: The main sources of methane in the atmosphere
Sources Amount/Year
Oil bearing grounds 1016 tons
Swamps Stagnant waters Lake sediments Rice paddies Deep sea Sewage treatment
Termites (7 trillions) 188 tons
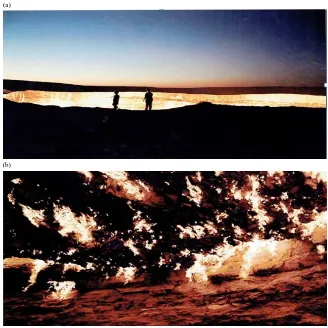
earth’s atmosphere contains 5 ppm methane and is increasing. Conrad (1995), Ding et al. (2004) Ding and Cai (2007), Holmes et al. (1999) many countries such Russia and Iraq witness methane gas burning day and night as was seen in Fig. 5 and 6. Methane could be
decreased by growing a special methane oxidizer landfills and rice paddies. Presence of methane gas is indicated in Fig. 6. In fact, part of Russia and the Middle East, so much, methane escape from sub terrain hydrocarbon deposit that land is literally on fire (Horz et al., 2005).
Methanomonas. sp. does not normally colonize on solid media and therefore, it is missed in isolation procedures (Brown et al., 1964). The relatively unknown microorganism is a highly efficient methane utilizing bacteria and is the microorganism to be employed in the study. M. methnooxidans requires methane and oxygen for growth (Al-Hindawi, 1970; Hutsch, 1998; Zang et al., 2008).
100,000,000,000+
10,000,000,000+
1,000,000,000+
1,000,000+ 0
[image:3.612.141.462.372.534.2] [image:3.612.72.298.577.665.2]J. Eng. Applied Sci., 14 (Special Issue 6): 9482-9490, 2019
Fig. 5: a, b) Hell-gateUzbekistan methane gas burning
Table 2: Outline of experiment using soil samples
6 oz. bottle potting soil 10 g Natural Sterile Sterile Sterile Sterile tap water (mL) 2 2 2 2 2 2 2 2 Methanomonas (106 cells) 1 1 1 1 1 1 1 1
Persisting bacteria (106 cells) - - -
-CH4 gas (mL) 30 30 30 30
Incubation 1-3 months 28°C 28°C 28°C Room temperature Flushing and gassing 30 30 30
-CH4 (mL)
Gas chromatography Stored 4 months count (Co2-O2-CH4) calculation MPN by
of gases dilution to
extinction
MATERIALS AND METHODS
Soils were injected with the same number of methane consuming bacteria to calculate methane consumption by square meter of surface in Table 2 (Carpent, 1997). Culture: The methane-utilizing bacterium employed in this investigation was Methanomonas methanooxidans
new sp. (Brown et al., 1964) from the stock culture collection of the biological science, department at Mississippi State University, checked for purity by lack of growth on nutrient agar and by gram staining (Kukla-Lamount, 2006; Hutsch et al., 1996).
Mineral salt medium: The medium was prepared in ten liter quantities consisting of: KNO3-1.00 g, K2HPO4. 3H2O-0.50 g, MgSO4.7H2O-0.20, FeCL2.6H2O-0.0.5 g, distilled water 1000 mL, final pH 7.0. After sterilization the screw caps replaced with rubber stoppers aseptically. Mineral salt ager was prepared by using 1.7% Bacto Agar and incubated to assure sterility. Methane gas was 99.1 mole percent (Matheson, Tri Gas Inc.). Potting soil samples were obtained from Hyponex Comp. The samples were seaved and the normal soil was agricultural land, dried and grounded (Ding et al., 2004).
Growth studies: The six oz bottles containing 10 g of soil samples were injected through the serum stoppers. About 1 mL bacterial culture containing 109 cells per mL, determined previously. Air in the atmosphere of the
(a)
[image:4.612.72.298.473.616.2]2000
1750
1500
1250
1000
750
500
250
50
V
alu
es
(
m
L
/k
g)
5 g
5 g
5 g
5 g
5 g 5 g
10 g
10 g
10 g 10 g
10 g 10 g
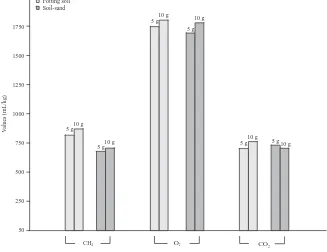
CH4
Potting soil Soil-sand
*Values are average of 30 days of growth with the addition of 30 mL methane daily
O2 CO2
bottles was immediately drawn out and chromatographic analysis was made for the methane, oxygen and carbon dioxide. All bottles including the control were incubated at 32°C for 2 weeks. In other set bottles without methane were included. Daily consumption of methane was made (Brown et al., 1964).
Gas chromatographic analysis: Gas analysis were conducted using 50 ul samples and filter using duel detector, gas partitioned model 1200 with Omniscribe series D5000 detector. The carrier gas was Helium at a flow rate of 40 mL/min., column temperature of 75 and a bridge current packed with 80-100 mesh compact TmPG. Column two was 11 ft. long by 3/16 in diameter. Aluminum and packed with 60-80 mesh molecular sieve 13x.
For calculation of gases, known amount of four gases were injected into the chromatograph and the area under the curve of each gas was calculated. The peak height of each gas was proportional to the amount of sample employed. To convert the mm of peak height on the gas chromatographic to mL methane, 1 kg soil, the factor used was 0.93, thus, mmX 0.93 divided by 50×170×103 = ML methane/bottle. mL/bottle divided by 10 = mL/g sample. Gases have different factors in calculations (Kightley et al., 1995).
RESULTS AND DISCUSSION
Gas consumption is potting soil and soil-sand mixture: using potting soil (natural or sterile) and soil-sand inoculated with M. methanooxidans, consumption of methane gas in a sq. meter amount to about 101 L methane and 97.9 L in the natural and sterile potting soil, respectively. Close to that was the consumption in the soil-sand, Table 3 (Anonymous, 1999).
When methane was added daily to soil samples for 120 days, the changes in gases were proportional to time in methane and oxygen consumption and carbon dioxide production. About 88 L of methane were consumed in natural soil and similar to that in the sterile soil, Table 4. Doubling the amount of inoculated soil has no effect on methane consumption (Kightley et al., 1995).
Methane utilization was the same weather soil sample was natural or sterile as in Fig. 6. This indicated that were no effect for the presence of microbial flora on methane consumption which is driven by this bacterium alone (Mosher et al., 1999).
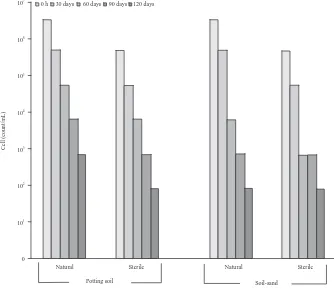
[image:5.612.147.474.441.693.2]Shelf life of M. methanooxidans: To study the persistence of M. methanooxidans in soil without the presence of methane for 4 months, the cells were diminished one log per month reaching 102 cells/g soil after 120 days (Fig. 7).
J. Eng. Applied Sci., 14 (Special Issue 6): 9482-9490, 2019
107
106
105
104
103
102
101
0
C
el
l (
co
u
n
t/
m
L
)
Potting soil Soil-sand
0 h 30 days 60 days 90 days 120 days
[image:6.612.150.484.97.386.2]Natural Sterile Natural Sterile
[image:6.612.314.540.438.532.2]Fig. 7: Counts of M. methanooxidans in soil stored at 28°C for 0-4 months
Table 3: Average consumption of methane in potting soil and in soil-sand at 28°C in 24 h
Value Potting soil natural/sterile Soil-sand natural/sterile Mm/bottlea
/50 μLa
24.2/23.4 23.1/21.5 ml/10 g soil 7.652/7.399 7.304/6.798 ml/kgb 765.2/739.9 730.4/679.8
L/m2 landc 9.056/8.757 8.644/8.048 “a, b, c”
[image:6.612.72.295.438.494.2]Significant values
Table 4: The accumulative changes in gases (1 kg-1 soil) in the growth
of M. methanooxidans
Days 30 60 90 120
Methane consumed 19.595 43.728 66.799 88.310 Natural soil daily (mL) 653.000 728.000 742.000 736.000 Sterile soil 19.244 43.233 66.240 87.880 Oxygen consumed 50.875 113.085 173.509 230.406 Natural soil daily (mL) 1.696 1.885 1.928 1.920 Sterile soil 50.461 110.298 171.294 228.100 Carbon consumed 21.667 47.743 71.028 95.307 Natural soil daily (mL) 0.722 0.796 0.789 0.794 Sterile soil 21.397 47.543 70.267 92.559
Concentration of some element in soil samples: Chemical analysis of some essential element content of all soil samples revealed high values for total kjeldhl nitrogen, phosphate and even the nitrate-nitrogen, Table 5. Thus, it is not necessary to add them to types of soil used to obtain maximum growth and uptake of methane. They were found to be adequate after 4 month’s period.
Table 5: Concentration of some elements in soil-sand potting soil (mg/kg)
Elements Soil-sand Potting soil
TKN 1525 2925
Nitrite 2.7 <0.1
Nitrite 102 388
Ammonium 34 33
Chloride 14.5 10.0
O-phosphate 513 444
Total phosphate 368 278
Magnesium 17 61
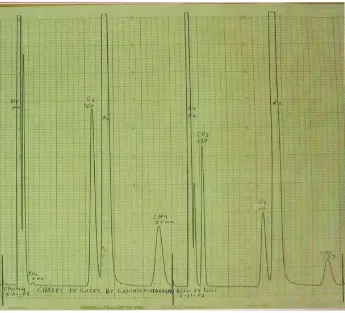
Methane consumption at different temperatures: To simulate the effect of seasonal variations in the temperature on methane consumption by this bacterium in the fields, it reached 80 L methane/sq soil after 14 days at 30°C, less, so, at 35 and 40°C, Fig. 8. Similar oxidation of methane was reported by Horz et al. (2005) curves of gas changes are shown in Fig. 9.
Soil inoculated with M. methanooxidans, 1 cm deep and covering 1 m2 of land will consume between 8.0 and 9.0 L of methane in 24 h at 30°C. As would be expected. The surface area of the culture exposed to the methane contaminated atmosphere and the porosity of soil mixture, dictate the rate of methane consumption.
[image:6.612.71.298.527.624.2]90
80
70
60
50
40
30
20
10
0
L
iter
m
eth
an
e
/m
so
il
2
2 4 6 8 10 12 14 16 18 20 22 24 26 28 30
Days Methane at 30°C
[image:7.612.138.472.94.352.2]Methane at 35°C Methane at 40°C
Fig. 8: The effect of temperature on utilization of methane
[image:7.612.133.478.386.699.2]J. Eng. Applied Sci., 14 (Special Issue 6): 9482-9490, 2019
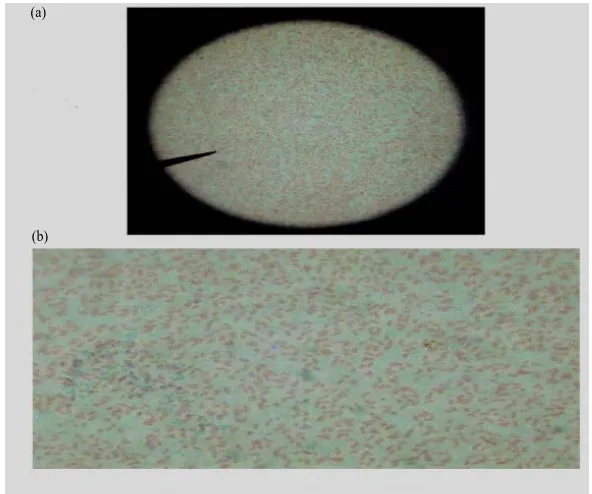
Fig. 10: M. methanamonas methanooxidans, 1000X methane gas to reach about 88 L per k/g of inoculated soil. Gram stain of M. methaoxidans is shown in Fig. 10.
CONCLUSION
The objective of this project was to determine the feasibility of using the methane-consuming bacterium, Methanomonas-methanooxidans in potting soil as a cover to consume the methane emanating from landfills and subterranean hydrocarbon deposits.
Potting soil inoculated with M. methanooxidans, 1 cm deep and covering 1 m2 of land will consume 31.3 L of methane in 24 h. As would be expected, the surface area of the culture exposed to the methane-contaminated atmosphere and the porosity of soil mixture, dictate the rate of methane consumption. All of the nutrients needed for growth of M. methanooxidans are presented in potting soil and even when mixed with 50% sand, no additional nutrients are needed for good growth. Unlike other methane-oxidizing microorganisms, nitrate and other normal constituents in potting soil do not interfere with methane consumption by M. methanoxidans. Other bacteria and fungi in the soil have no effect on the consumption of methane. Seasonal changes between the temperature of 30 and 45°C (86 and 113 °F) can be tolerated by the methane-consuming bacterium, although, methane consumption is reduced at a higher temperature. Methane consumption returns to normal when the temperature returns to 30°C.
Inoculated potting soil containing 107 cells/mL stored at room temperature in the absence of methane when exposed to methane retained 103 cells/mL after 4 months but the cell concentration quickly recovers when exposed to methane and oxygen. The potting soil also can be dried at 40°C for 1 h in the oven with the reduction in count of only one log. This treatment reduces the moisture content to 14.5%, thus, preventing microbial growth, since, 18% moisture is necessary for microbial growth. These data clearly indicate that the inoculated potting soil can be stored for several months prior to use.
It is concluded that covering landfills and subterranean hydrocarbon deposits with potting soil inoculated with M. methanooxidans would significantly reduce that emanation of methane into the atmosphere.
ACKNOWLEDGEMENTS
The researcher are obliged to the excellent efforts of Mr. Mohammed F. Hamza at AL-Bashiq Office solutions in Baghdad, Iraq. For his excellent efforts in the preparation and typing of the manuscript of this study.
REFERENCES
Al-Hindawi, N.A.H., 1970. Assimilation of methane and carbon-dioxide by methanomonas methanooxidans. Ph.D Thesis, Mississippi State University, Starkville, Mississippi.
(a)
Anonymous, 1999. Inventory of U.S. greenhouse gas emissions and sinks: 1990-1997. United States Environmental Protection, Washington, D.C., USA. https://www.epa.gov/ghgemissions/inventory-us-greenhouse-gas-emissions-and-sinks-1990-1997 Bender, M. and R. Conrad, 1992. Kinetics of CH4
oxidation in oxic soils exposed to ambient air or high CH4 mixing ratios. FEMS Microbiol. Lett., 101: 261-269.
Borgeson, G., B. Celin, J. Samuelsson and B.H. Swens, 2015. Methane emissions from landfills: Options for measurement and control. MCS Thesis, Department of Software Engineering, Linkoping University, Linkoping, Sweden.
Brown, L.R., R.J. Strawinski and C.S. McCleskey, 1964. The isolationand characterization of Methan omanos methan oxxidans. Can. J. Microbiol., 10: 791-799.
Bull, I.D., N.R. Parekh, G.H. Hall, P. Ineson and R.P. Evershed, 2000. Detection and classification of atmospheric methane oxidizing bacteria in soil. Nat., 405: 175-178.
Carpent, P.L., 1997. Microbiology. W.B. Saunders Company, Toronto, Canada,.
Chanton, J. and K. Liptay, 2000. Seasonal variation in methane oxidation in a landfill cover soil as determined by an in situ stable isotope technique. Global Biogeochem. Cycles, 14: 51-60.
Conrad, R., 1995. Soil microbial processes involved in production and consumption of atmospheric trace gases. Adv. Microb. Ecol., 14: 207-250.
Digestive Ferments Company Difco Labora, 2018. Difco Manual of Dehydrated Culture Media and Reagents for Microbiological and Clinical Laboratory Procedures. 9th Edn., Franklin Classics Trade Press, USA., ISBN:9780353228429, Pages: 354.
Ding, W., Z. Cai and D. Wang, 2004. Preliminary budget of methane emissions from natural wetlands in China. Atmos. Environ., 38: 751-759.
Ding, W.X. and Z.C. Cai, 2007. Methane emission from natural wetlands in China: Summary of years 1995-2004 studies. Pedosphere, 17: 475-486.
Gulledge, J. and J.P. Schimel, 1998. Low-concentration kinetics of atmospheric CH4 oxidation in soil and mechanism of NH4+ inhibition. Appl. Environ. Microbiol., 64: 4291-4298.
Holmes, A.J., P. Roslev, I.R. McDonald, N. Iversen and K. Henriksen et al., 1999. Characterization of methanotrophic bacterial populations in soils showing atmospheric methane uptake. Appl. Environ. Microbiol., 65: 3312-3318.
Horz, H.P., V. Rich, S. Avrahami and B.J.M. Bohannan, 2005. Methane-oxidizing bacteria in a California upland grassland soil: Diversity and response to simulated global change. Appl. Environ. Microbiol., 71: 2642-2652.
Hutsch, B.W., 1998. Methane oxidation in arable soil as inhibited by ammonium, nitrite and organic manure with respect to soil pH. Biol. Fertil. Soils, 28: 27-35.
Hutsch, B.W., K. Mengel and P. Russell, 1996. CH4 oxidation in two temperate arable soils as affected by nitrate and ammonium application. Biol. Fertile. Soils, 23: 86-92.
Jin, H.J., J.W. Wu, G.W. Cheng, N. Tomoko and G.Y. Sun, 1999. Methane emission from waterland on the Qinghi-Tibet Plateau. China Sec. Bull., 44: 2282-2286.
Kightley, D., D.B. Nedwell and M. Cooper, 1995. Capacity for methane oxidation in landfill cover soils measured in laboratory-scale soil microcosms. Applied Environ. Microbiol., 61: 592-601.
Kukla-Lamount, G., 2006. Dorothy Observatory. Columbia University, Palisades, New York, USA.,.
Mosher, B.W., P.M. Czepiel, R.C. Harriss, J.H. Shorter and C.E. Kolb et al., 1999. Methane emissions at nine landfill sites in the northeastern United States. Environ. Sci. Technol., 33: 2088-2094.