THE EFFECT OF PROCURMENT CAPABILTIES AND
INNOVATIVE PERFORMANCE ON FIRM
PERFORMANCE:
A CASE STUDY ON FORMULA 1 TEAMS FROM 2008-2017, A HIGH-TECH,
HIGHLY INNOVATIVE AND COMPETITIVE ENVIRONMENT
MASTER THESIS
AUTHOR:
Ing. D.A.M. Segerink
S1763997
[email protected]
FIRST SUPERVISOR:
First: Mr. DRS.IR. J.C. Kuijpers
Second: Mr. DR. M.L. Ehrenhard
1
Acknowledgements
The Master Thesis is the final part of my master program specialization Entrepreneurship, Innovation
and Strategy. This research cannot be finished without acknowledgement to the people who helped
creating this master thesis. The research was an initially a hard and relatively slow going process that
resulted in an extensive database covering the subject Formula 1. However, it was rather difficult to
determine what to do with the generated database. This struggle proved to be bigger than anything I
thus far encountered in my academic life. Therefore, I would like to thank my first supervisor, Mr. Koen
Kuijpers, for the help and guidance during this period, enabling me to learn what is necessary to
complete the master program.
In addition, I would like to thank my second supervisor, DR. Michel Ehrenhard, for the help with the
initial start of this thesis and his final remarks. Showing overlooked points in the research and lifting
the thesis to a higher level. I would also like to thank my fellow students for the support and experience
sharing. Last but not least, I would like to thank my family and friends for the emotional support and
the creation of a supportive environment. Thus enabling me to write this master thesis and motivating
me to get on with the thesis to finish it. Enjoy reading this master thesis!
Oldenzaal, November 2019
2
Abstract
It is understood that the procurement department and innovative performance of an
organization influence the overall business performance of that organization. The research explaining
this matter is based on knowledge based view. This underpins the point of view that human capabilities
are one of the firms most valuable assets. Both departments are often linked together and research
on the matter showed a positive interaction term between them regarding the business performance
of an organization. However, current literature is predominantly based on the view of the
management. Procurement managers are asked to grade their own department, and the same goes
for the department responsible for innovation.
Furthermore, this leads to a gap in existing literature, where objective data can possibly verify
or falsify existing literature. Resulting in the formulation of the following main question; “What effect
do procurement capabilities and innovative performance of a Formula 1 team have on the business
performance of the team?”. The research is performed in an environment that enables unbiased data
of Formula 1 teams. The data was extracted form independent sources and if possible, verified
two-fold. On team level, ten years of data is gathered and analysed. The analysis used is the Fixed effects
model, applicable for longitudinal and for multiple groups.
The results show that both the procurement capabilities and the innovative performance of
the Formula 1 teams have a positive significant effect on business performance. Controversially, the
interaction effect was found to be negative significant. However, this contradicts current literature on
the subject of business performance. Furthermore, this implicates that it is for organizations that are
active in a comparable industry as is the Formula 1, investing in both the procurement and innovative
department can lead to improved business performance. Even so, the interaction between the two
departments might be less than current literature suggests and is of interest for further research.
3
Table of contents
Acknowledgements ... 1
Abstract ... 2
Table of contents ... 3
1. Introduction ... 4
2. Theoretical framework and hypothesis formulation ... 7
2.1 The effect of procurement capabilities on business performance ... 7
2.2 Innovation performance and business performance ... 8
2.3 The interaction between innovative performance and procurement capabilities ... 9
2.4 Empirical model ... 10
3. Methodology ... 11
3.1 Data collection ... 11
3.2 Data Analysis ... 12
3.2.1 Statistical approach ... 13
3.2.2 Variables ... 13
3.2.3 Application ... 16
4. Results ... 17
4.1 Descriptive statistics ... 17
4.2 Hypothesis testing ... 18
4.2.1 Hausman test ... 19
4.2.2 Fixed effects model ... 20
5. Conclusion & discussion ... 22
References ... 24
Appendices ... 28
APPENDIX 1 Data variables description ... 28
APPENDIX 2 STATA 13 code used for analysis ... 29
APPENDIX 3 Descriptive statistics results (complete)... 31
4
1.
Introduction
Procurement strategy, as others strategies, has evolved over time. The procurement
departments of organizations historically tend to focus on purchasing efficiently. Procurement
strategies are focussed on low cost and high quality of the, to be purchased, products or components
(Nollet & Beaulieu, 2003; Schiele, 2007a). This procurement strategy focusses all capabilities to be used
within organizational structure limitations (Nollet & Beaulieu, 2003). The procurement capabilities
often limited in an isolated part within the organization. Moreover, it is not included in decision making
in other departments nor at the suppliers side. However, in the last decade the procurement
capabilities of an organization are often linked to innovative and overall business performance (C.a,
T.b, & M.c, 2013; Carey, Lawson, & Krause, 2011; Luzzini, Amann, Caniato, Essig, & Ronchi, 2015). Thus,
creating the need for a broader use of procurement capabilities and knowledge about the effect it can
have on an organization (Luzzini et al., 2015).
Currently procurement capabilities are recognised as one of the key sources for improved
innovative performance and business performance. Nevertheless, in current literature this seems only
the case when there is a high level of integration of the procurement department, within other
organizational departments and suppliers. Current literature that for example, this enables a suppliers
to add product and process knowledge in the customers organizational product development (Walter,
2003). The quicker an organization and its supplier collaborate, the more efficient and possibly
effective the innovation can be (Clark, 1989; Ragatz, Handfield, & Petersen, 2002). However, being able
to work extensively with a supplier on innovation is not without constraints. Both parties must be
willing to participate and share knowledge, possible creating imbalance in power between supplier
and customer. Which on itself is a deterrent for such a relation (Ragatz et al., 2002; Schiele, 2007b).
The literature and theoretical models used in this paper are based upon the resource based
view (RBV) (Barney, 1991; Conner, 1991) and knowledge based view (KBV)(Grant, 1996; Kogut &
Zander, 1992), which evolved from RBV. With the knowledge of this theories, the difference in business
performance is explained on a team level. RBV is used to determine which factors within a Formula 1
team (organization) can make a difference on the procurement capabilities, innovation performance
of the team. Creating a theoretical understanding why some organization perform better than their
competitors.
Current literature leaves the connection of procurement capabilities, innovative performance
and their effect on business performance, yet to be discovered with solid empirical research (Akın Ateş,
van Raaij, & Wynstra, 2018; Hong & Kwon, 2012; Luzzini et al., 2015). The link between procurement
capabilities, innovative performance and business performance is not completely new. Present
5 procurement capabilities and innovative performance. Creating a possible positive bias (Akın Ateş et
al., 2018; Hong & Kwon, 2012; Luzzini et al., 2015). To analyse this aspects of procurement and
innovations performance, a complex and innovative market is sought after to which procurement and
innovation both play a key role (Houman & Rask, 2003; Williamson, 2008).
In order to gain the necessary data in the right settings, this research applies data from
organizations that are not only innovative, but also have measurable in- & output. Organizations that
meet this criteria are Formula 1 teams1 (Castellucci & Podolny, 2017; Jenkins, 2010, 2014). The Formula
1 industry is highly innovative and competitive (Jenkins, 2010, 2014). Additionally, the results from the
races are publicly available2. Moreover, the fanbase of the Formula 1 creates and stores even more
publicly available data3. The nature of this industry (innovative, technical and competitive) and the
availability of data makes it possible for this research to analyse the procurement and innovation link
to business performance.
The aim of this paper is to contribute to existing literature about the effect of procurement
capabilities and innovative performance on business performance. This is performed through
empirically testing the link between the concepts. This is executed in an environment where
procurement capabilities are used and a high level of innovativeness are made measurable. As well as
a measurable performance indicator. In one sentence: The goal of this research is to ground the current
theoretical knowledge of the link between procurement, innovation and business performance in a
highly innovative market, without the bias of managers that have an interest in improving results. The
question to be answered in order to achieve this goal is:
What effect do procurement capabilities and innovative performance of a Formula 1 team have on
the business performance of the team?
This thesis aims to contribute to current procurement and innovation literature and the
possible interaction effect between the concepts regarding business performance. The interaction
phenomenon is only recently described in literature and has mostly been tested qualitatively. The
study is based on case data from the Formula 1. Therefore, testing current theories in a “real world”
case, creating a substantial additive to literature that tries to link procurement strategy with innovation
and business performance. Additionally, it can create discussion whether or not current theories are
applicable in a highly innovative, highly technical and highly competitive industry. Creating knowledge
1 Formula 1 teams, are organizations active in the “FIA FORMULA 1 WORLD CHAMPIONSHIP”
https://www.fia.com/events/fia-formula-one-world-championship/season-2019/2019-fia-formula-one-world-championship
6 for companies that seek information about procurement innovation, and the possible effect of
innovation on the relation with procurement and business performance.
This thesis is outlined as follows. In chapter 1, the introduction of the Master thesis is done. In
the following chapter, the relevant literature is described and explained. The theoretical framework
chapter is build on what is already researched and what blanks are still there to be filled. Due to the
lack of empirical researches on this topic, and the studies are mostly qualitative. Furthermore, chapter
2 also contains the hypothesises that are to be tested. In chapter 3 the design of the construct is
formulated. The research method is explained, as well as how the measurements are performed and
how the data is collected and analysed. The data-analysis is done in chapter 4, here the hypothesis
that have been formulated in chapter 2 are tested. Chapter 5 contains the conclusion and discussion.
This will include the key finding, limitations and advise for future research.
To clarify the abstract terms used in this paper, the definition of two terms are explained.
Innovation and business performance are both terms that are multi-interpretable and therefore
explained in this section. The definitions are based on definitions from relevant literature on the topic
of procurement. First, innovation, according to the European Commission (1995), it is the “Successful
production, assimilation and exploitation of novelty in the economic or social environment”(European,
1995). This definition includes the broader view of innovation within an organization. In this research
it is measured on a level of effectiveness of the innovation
Secondly, the business performance of an organization can be measured to the extend of
which an organizational goal is achieved. It can be determined by measuring the effectiveness of the
organization in reaching its goal over a certain time period. This therefore is thus is goal dependent
and differs per industry an organization is in and the goal an organization has set (Franco-Santos et al.,
2007). For this research, the Formula 1 goals are measured and the business performance determined
accordingly. Jenkins (2010), describes that the Formula 1 teams, the goal is to maximize the points
7
2.
Theoretical framework and hypothesis formulation
2.1
The effect of procurement capabilities on business performance
This research’s goal is to link the procurement strategy of an organization to the innovation
performance and business performance. The resource based view (RBV) creates the understanding in
theoretical literature that sustainable competitive advantage can be created through resources of the
organization(Barney, 1991; Curado, 2006; Penrose, E, 1959). However, the internal paradox of RBV and
lack of empirical backing of the theory enabled the theory to evolve in to a more wholistic view (Day
& Wensley, 1988; Dierickx & Cool, 1989; Lado et al., 2006; Newbert, 2007).
The evolution of RBV is knowledge based view KBV. KBV is a more wholistic view of the
organization(Kogut & Zander, 1992; Newbert, 2007). The new theory focusses on the capabilities of
employees as being a vital resource of the organization(Curado, 2006; Grant, 1996; Grant & Grant,
2005; Jensen & Meckling, 1976; Lado et al., 2006; Mathews, 2003). The KBV is vital for this research to
embed the procurement capabilities. The capabilities of an organization, according to KBV, can be the
source of sustainable competitive advantage. Schiele (2007), investigated the effect the purchasing
department maturity stage has on the performance of an organization. The research was based on the
assumption that a greater maturity of the procurement department was related to a better
performance of the organization (Schiele, 2007a).
Prior to the work of Schiele (2007), research showed that purchasing volume as a percentage
of organizations financial budget has expanded and plays an evermore bigger role within an
organization(Goh, Lau, & Neo, 1999). This might imply that a further improvement of the procurement
department performance has a positive effect on the overall business performance (Goh et al., 1999;
Narasimhan & Das, 2001). Schiele (2007) states that the procurement department has a significant
positive effect on the business performance. The data used was derived from perceptions from the
managers on how “mature” the procurement department was. The data was also not reported with
the same method from different firms. This research seeks to standardize the measurement creating
a quantitative case study on the highly innovative Formula 1 industry. The following hypothesis is
formulated to test this phenomenon:
H1: Procurement capabilities of a Formula 1 team positively influences the business performance
The first hypothesis aims to test the assumption that there is a positive link between
procurement capabilities of an organization and the ultimate business performance. This is also based
on KBV and RBV and described by Schiele (2007). However, focussed on the improvement of a
procurement department on the basis of their ability to reduce costs. Which is not always necessary
8 1 team goals are focussed on maximizing output through innovation. The procurement department
plays a vital role in enabling further processes in the organization.
2.2
Innovation performance and business performance
In current literature the link between innovation and business performance has been
researched extensively. For example, the research of Neely & Hii (1998) showed that at that time, the
connection was already broadly supported by empirical research (Camagni & Capello, 1999).
Furthermore, the research found that firms that innovate are able to obtain a higher profit margin and
grow faster than non-innovative firms (Geroski & Machin, 1992). However, the measurement of
innovation is hard due to the multi-dimensional character. There was no empirical evidence found that
a higher level of innovation leads to less business performance (Neely & Hii, 1998).
The positive influence of innovation on business performance is also in line with the RBV and
KBV theories. Highly innovative products are rare and are in some ways hard to imitate. The knowledge
for innovation is within the employees and therefore based on the capabilities of the employees. More
recent research on the topic of innovation and business performance does not contradict the previous
understanding of the link (Wong et al., 2016). The research of Wong et al, (2016) again shows an
empirical grounded research that finds innovation to be of a great influence on the business
performance. The research is performed with data from SME’s in Malaysia (Wong et al., 2016).
For this research it is necessary to clarify the meaning of innovative performance of a Formula
1 team to make it measurable. The innovative performance of a Formula 1 team is defined as being
the performance of the team on creating the best possible car with the least amount of research.
Hence, creating encompassing effectiveness and efficiency of the team on creating the best possible
racing car. This leads to the creation of the second hypothesis.
H2: Innovative performance of a Formula 1 team positively influences the business performance
The second hypothesis tests the assumption that an enhanced innovative performance within
an organization leads to a better business performance of that organization. This is in line with RBV
and KBV theory in the way that innovation often is created by unique capabilities of employees.
Furthermore, according to Neely and Hii (1998), innovation creates both new products and processes
that improve a firm’s competitive position in relation to its rivals. The link The hypothesis aims to
further enhance current understanding of highly innovative teams and the effect of innovation on their
9
2.3
The interaction between innovative performance and procurement
capabilities
The link between innovation and procurement is researched by Luzzini et al. (2007). This
research uses KBV to investigate the supplier collaboration and the effect it has on innovation of NPD4
(Luzzini et al., 2015). The research focusses on two types of advantages gained by the procurement
department; supplier collaboration level and strategic sourcing which are grounded in RBV and KBV
due to the understanding of capabilities of the procurement department (Luzzini et al., 2015; Ramsay,
2001). In this paper, there is a proposed model. The model is tested in the research of Luzzini et al.
(2015).
Moreover, the first hypothesis being that an higher focus on innovation strategy has a positive
effect on the effort put in supplier collaboration as well as strategic sourcing. The second and third
state that a higher purchasing knowledge leads to more effort on both strategic sourcing as supplier
collaboration. The fourth and fifth describe the hypothesis that a greater effort in strategic sourcing
and supplier collaboration has a positive effect on the innovation performance (Luzzini et al., 2015).
Testing these hypothesis, grounded in KBV creates an the ability to confirm or deny the link between
innovation performance and purchasing knowledge.
The hypothesis tested were all found to be supported by the empirical testing. tested with the
help of a survey, spread across western Europe and North-American organizations. The survey tested
the perspective of “highly qualified purchasing professional”(Luzzini et al., 2015). This creates a result
based on the perspective of a group of professionals that all share the “procurement perspective”,
which might be a potential blind spot in the paper. This drawback is overcome by empirically testing
data that is not based on the perspective of just one function or discipline within an organization, by
selecting data retrieved from independent databases5. The conclusion is that the purchasing
capabilities have a significant positive effect on the innovation performance of this organization
according to the data provide by the procurement department managers(Luzzini et al., 2015).
H3: The procurement capabilities of a Formula 1 team positively influences the effect the
innovative performance has on the business performance
4 New Product Development
55 Formula 1 teams, are organizations active in the “FIA FORMULA 1 WORLD CHAMPIONSHIP”
https://www.fia.com/events/fia-formula-one-world-championship/season-2019/2019-fia-formula-one-world-championship
10 The hypothesis tests the assumption that there is an interaction effect between the innovative
performance and the procurement capabilities. This effect, according to RBV and KBV, should be
positive due to the fact that better procurement capabilities enable more effective innovation.
Resulting in a sustainable competitive advantage. Supported by RBV and KBV theories in the way that
innovation often is created by the capabilities of employees to communicate and share knowledge
between departments. The hypothesis aims to further enhance current understanding of highly
innovative teams and the effect of innovation on their performance.
2.4
Empirical model
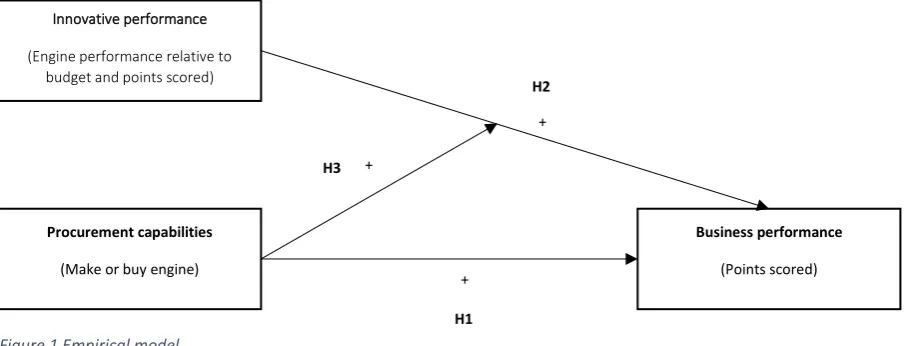
In order to visualize how the stated hypothesis are combined, an empirical model is developed.
The first hypothesis tests a positive relationship between procurement capabilities and the business
performance. The second hypothesis tests a positive relationship among the innovative performance
and the business performance. The third hypothesis tests an implied interaction effect of a positive
relation between innovation performance and business performance that is further strengthened by
better procurement capabilities.
Business performance
(Points scored) Procurement capabilities
(Make or buy engine)
Innovative performance (Engine performance relative to
budget and points scored)
H2
H1 H3
+
+
[image:11.595.75.529.366.539.2]+
11
3.
Methodology
This research design is grounded on the data created by and for Formula 1 teams. The data is
then analysed to research the procurement capabilities and the innovation performance of the teams.
Both the variables are used for the empirical testing of the hypothesis in relation to the business
performance of the teams. For the validity and reliability of the variables and statistical analysis of the
research, the data is collected for the Formula 1 teams from 2008 till 2017. If accessible, ten years of
data of each individual team was collected, when teams were not active for the entire period, the
remaining available data was used6. Therefore, creating a longitudinal and multidimensional dataset,
ready for analysis.
The data is divided in to different variables in order to analyse different aspects of the teams
and create a valid dataset containing the right variables. The data to create the necessary variables is
collected performing a desk research. Data is obtained form different sources from existing literature
on the topics of Formula 1, procurement strategy, innovation and business performance literature.
The data needed on the Formula 1 teams, official Formula 1 archive, the official team websites and fan
based websites7 are used. The
All the data variables collected and created can be found in appendix 1. At last the statistical
analysis is described and explained. The statistical analysis is performed using the fixed effects model,
random effects model and the Hausman test. The later to determine if the fixed effects model or the
random effects model suited the data best. The analysis is performed using a statistical analysis
program named STATA 13. If executed correctly, the steps lead to the correct data collection, statistical
analysis and interpretation.
3.1
Data collection
Key in any research is the data, and especially, the source of the data. In this section of the
research the data collection is discussed extensively. Due to the empirical nature of this research, the
need to ground the theory of the chapter 2 is fulfilled in this section. This is realized by using empirical
data on the topic. In order to do so, innovation performance, business performance and procurement
capabilities of an organization are made measurable into a variable. The data is obtained by desk
research and verified using multiple resources. These resources vary from the Formula 1 official
6 Teams that were not active for the entirety of the 10 year data set (2008-2017): HAAS (2016-2017), HRT
Cosworth (2010-2012), Lotus F1 Team (2010-2014), MRT Mercedes (2010-2016), Super Aguri Honda (2008) & Toyota (2008-2009).
7
https://www.fia.com/events/fia-formula-one-world-championship/season-2019/2019-fia-formula-one-world-championship & https://www.formula1.com/en/results.html/2019/races.html &https://www.racefans.net &
12 website to the previously done research on the topic, as well as fan controlled websites on the Formula
1 and websites of the organizations themselves8 .
The official F1 website has a database with the records of all races from the beginning of F1.
From this database we retrieved the drivers name, team names, nationality of the driver, the number
of points scored per season. As well as the constructor points and the position in the general rankings
per season. The data is retrieved using a web scraping tool named “Octoparse” . The tool was used to
minimize the time spent on collecting the data as well as eliminating the human error in the collection
of data (Kirwan, Martin, Rycraft, & Smith, 1990). This data was the foundation for further analysis and
used to validate other databases.
The Formula 1 database however, does not contain all the necessary information for this
research. Further information about the teams is found on the sites of the different teams
(organizations) selves and fan sites that keep record of the teams throughout the years. The different
variables found are: names, gender and the age of the management team key figures. Additionally, the
engine manufacturer was linked to each team. Moreover, the financial budget of each team per
season. This data is collected by hand and double checked in order to minimize human error (Kirwan
et al., 1990). The data can be found in the digital appendix 1.
3.2
Data Analysis
The data obtained in this research has to be analysed correctly in order to create valid and
trustworthy results. Before it becomes clear what analysis type is necessary, the data has to be
interpreted. What type of data is there? And what types of analysis should be used to analyse
correctly? The data is collected over the Formula 1 teams, if accessible, for a period of ten years from
2008 till 2017. This time period is used in order to create the most recent dataset and therefore the
most relevant data. The raw data can be found in digital appendix 1.
The data variables are collected for all the active teams for the ten years. Creating a
longitudinal dataset for each team. Not all teams have had the same owner over time, nor have all the
teams been active for a period of 10 years. For the teams that changed owners, the teams were named
and coded as being the same team over the years. One team entered the Formula 1 later on in the
data set and is analysed for it is active years only. This leads to the data being labelled as “Panel Data”,
panel data is data in which different individuals or organizations are observed for more than one
observation (across time) (Torres-Reyna, 2007).
8
https://www.fia.com/events/fia-formula-one-world-championship/season-2019/2019-fia-formula-one-world-championship & https://www.formula1.com/en/results.html/2019/races.html &https://www.racefans.net &
13
3.2.1 Statistical approach
In research there are multiple analysis methods that can be used, however the correct analysis
method must be applicable for panel data. The first option, often used in literature, is the Ordinary
least squares (OLS). OLS is used to analyse cross-sectional measurements at a specific point in time
(Hesselink, 1988; Paulraj, Chen, & Flynn, 2006; Psillaki, Maria; Kaskalakis, 2009). Therefore, the OLS
method of statistical analysis does not fit the panel data and cannot be used in this research. In addition
to standard OLS method, the two-stage least square model can be used to overcome a multiple time
period data base problem that OLS itself cannot overcome. The method however requests the use of
independent variables that have no influence on the dependent variable of the second measurement
in time (NCSS Statistics, 2019). The dataset of this study has variables that are related to one another
over time, creating the need for another statistical model.
The Formula 1 business performance is the dependent variable of this research. The business
performance variable is a count variable. Meaning that there is no negative value (no smaller value
than 0). This type of variable cannot be assumed to have a normal distribution due to the fact that a
normal distribution also includes negative values (Barbour, Chen, & Loh, 1992; Zou, 2004). The normal
distribution model do not correctly predict the dependent variable values. Therefore, a Poisson
regression is used to predict the dependent variable (Barbour et al., 1992; Zou, 2004). The Poisson
regression model is a generalized linear model for count data, and does not include negative values
(Barbour et al., 1992; Zou, 2004).
In addition, statistical models that are suitable for the analysis of panel data are the
fixed/random effects model (Schmidheiny, 2018; Torres-Reyna, 2007). The fixed effects model (FEM)
and random effects model (REM) are a statistical type of multiple regression used to analyse panel
data in quantitative research. The models are able to control for omitted variables9 (Psillaki, Maria;
Kaskalakis, 2009; Schmidheiny, 2018; Torres-Reyna, 2007). Furthermore, the models are able to
analyse data variables at different time levels, over a longer period of time. Creating the opportunity
to analyse groups simultaneously over a longer period of time. Additionally, a Hausmann test has to
be conducted to determine whether the FEM or REM is best suitable for use in analysis (FEM/REM).
3.2.2 Variables
The dependent variable in this statistical analysis and test has to reflect the business
performance of the Formula 1 teams. Every team wants to perform at the highest level possible and
therefore score as much points in the Formula 1 championship as possible. The business performance
of the team is consequently made measurable by creating the variable “business performance” This
14 variable does includes the constructors points gained by the main drivers of the team. However, there
are also drivers in teams that drive for less than a complete season for different reasons. These points
are also added to the variable for business performance. The variable therefore shows all the points a
team gathered during a season in the Formula 1. Moreover, this creates a more accurate performance
measurement variable for the analysis than the normal constructor points of a team.
Starting with the first independent variable discussed in this research “PROCUREMENT”. The
procurement capabilities of a Formula 1 team are hard to collect data of. This is due to the closed
nature of Formula 1 teams in general and specially in the way the teams spend their money internally.
The teams are not publicly owned and therefore do not have to provide clear and specific data of the
organization publicly to their stakeholders. This scarcity of data from the teams, makes it hard to gain
insight in their procurement capabilities of the teams. In general, the capabilities are measured by the
output and input. Normally the purchasing strategy and capabilities are measured by interviews and
questionnaires send to the purchasing managers of organization. Formula 1 teams do not want to
share information on this topic to not give competitors insight in their organizations. These
circumstances have led to a different view on procurement capabilities measurement.
To measure the procurement capabilities of a Formula 1 organization a non traditional
approach is necessary. In order to understand this, it is necessary to know that a Formula 1 team
divides the development of the car in two separate pieces, the chassis and the engine.(Triya Nanalal
Vadgama, Mr. Arpit Patel, & Dr. Dipali Thakkar, 2015) Six of the ten teams active in the Formula 1 in
2017 produce their chassis in the close proximity to each other in the U.K.. However, not one of the
engine manufacturers are located in the U.K.. This shows that, even though teams develop their own
engine, another organization in another country develops and builds the engines.
The procurement capabilities can be made measurable on the basis of whether a team that
makes its “own” engine or not. Formula 1 teams that make their own engine have to extensively
worked together with their own organization, that is total other organization on its own. The teams
collaborate with the engine development and co-create a fitting engine and chassis. Teams that buy
an engine from them have little to no influence on the development of the engine. The procurement
department of these teams do not have to work intensively with their engine supplier. The teams that
make their own engine spend more time, effort and money in the process, and therefore have better
procurement capabilities than the teams that simply buy a ready made product. This has been made
measurable by creating a dummy variable “PROCURMENT” (1 = Make vs 0 = BUY ).
The second independent variable is innovation. The innovation variable is in general made
measurable by analysing the budget of an organization spend on research and development, number
of employees involved in innovation and strategic orientation (Adams, Bessant, & Phelps, 2006;
15 these data points are not able to be measured easily. Although, the Formula 1 teams main goal is to
maximize business performance and therefore championship points. This can only be done by creating
a better car than the competitors, by innovating the cars ability to go around a circuit as quick as
possible (Jenkins, 2014).
The engine part of the car also has influence on the business performance. However, the
budget of the engines developed by the Formula 1 team self is not included in the teams budget. The
teams that build their own engines have a different, seperate organization that builds the engines,
which have a different budget. Whereas teams that buy their engine spend a relative low amount of
their budget on purchasing that engine as a customer. The money spend on the engine deals with
suppliers is not clarified, some teams even receiving payments from suppliers to use their engine. The
engine budget is a minor factor in the budget.
To measure the innovative performance of the Formula 1 teams correctly the variable
“INNOVATION” is created. the innovation performance of a Formula 1 team. The engine performance
is measured and per type of engine, which shows the amount of money spent per championship point
scored, with a certain engine type, creating a variable for engine performance. The engine
performance variable is then multiplied by the number of points the team has scored over the season
and divided by the actual budget of the team, creating a relative innovation performance score. This
score is than based on how much money a team had as a budget for innovation without the effect the
of a potentially better engine.
Additionally, a “PROCUREMENT & INNOVATION INTERACTION” is measured. This interaction effect implies that better procurement enables better innovative performance of teams and that leads
to a better business performance. The interaction effect exists of both the procurement as well as the
innovation variable. The interaction effect is preformed using the interaction effect function that
STATA13 offers for the FEM and REM analysis. The analysis is compared by creating a separate model
for both the interaction effect as well as without the effect. According to literature, a positive effect is
expected.
Lastly, there is need for control variables. In prior studies it has been proven that certain factors
have a potential relationship with the business performance. Prior research showed that the
management team of an organization has influence on the business performance, factors that
influence the team are gender, age and experience(Castellucci, Padula, & Pica, 2011; Dwyer, Richard,
& Chadwick, 2003; Perryman, Fernando, & Tripathy, 2016; Taylor & Greve, 2006). The management
16
3.2.3 Application
In order to test the three hypothesis the fixed and random effects models where used. The
program used to complete these tests is STATA 13 64 bit for windows . In order to run the tests, it is
necessary to compile the data in an orderly manner. Some of the variables where string variables, the
string variables have to be recoded in order to be analysed with the program. After the recoding, the
string variables are numeric variables. Furthermore, the “age” variables are standardised in order to
analyse them on the same scale as the other variables. The last step before the analysis of the data is
the summarization of variables to control for outliers, missing data and other strange variables in the
data set.
The analysis of the data is performed wit the fixed and random effects models. The input for
both models is the same. For the analysis, two different variable models are made, one with and one
without the interaction effects. The fixed and random effects model for both models give a different
output. Which makes it crucial to determine which of the two models is best suited with the variable
methods. This is done wit the use of the Hausmann test. Both models are compared with each other
and a significant results ( a >0.05) indicates the use of the FEM in favour of the REM and vice versa.
Therefore the most suitable of the two statistical models is picked to analyse the data models. In
17
4.
Results
4.1
Descriptive statistics
In the first place the descriptive statistics of the key variables of this research. The descriptive
statistics are used to inspect the variables before the further analysis is run to know which analysis and
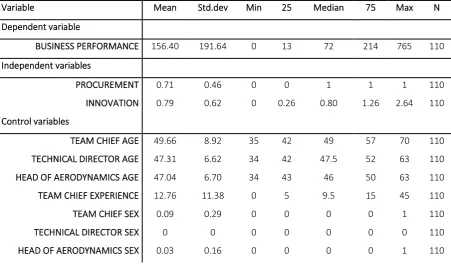
variables to use. Table 2 shows the descriptive statistics. The table includes the Mean, standard
deviation, minimum, 25th, median, 75th and maximum percentage. Furthermore, the number of
observation, giving insight in the data completeness. All the variables have the same number of
observations 110, which is the same as the number of total observation that illustrates that there is no
missing data in any of the variables in the dataset. A table with all the variables of this research can be
[image:18.595.73.525.315.585.2]found in appendix 1.
Table 1 Descriptive Statistics (Key variables from table 1)
The variable “BUSINESS PERFORMANCE” has a mean of 156,40 which is the average points the
teams have scored over the years. The standard deviation is higher than the mean, which indicates
that there is a large spread within the variable. This is again confirmed by the percentiles, which show
a relative large max in comparison to the mean. It also shows an absolute zero and the median of 72.
In the data shows an right skewed variable. This is the dependent variable, it is not normally
distributed, but this is not necessary for panel data. (Battese & Coelli, 1995) The variable is suitable for
further use in the analysis as being the dependent variable.
Variable Mean Std.dev Min 25 Median 75 Max N
Dependent variable
BUSINESS PERFORMANCE 156.40 191.64 0 13 72 214 765 110
Independent variables
PROCUREMENT 0.71 0.46 0 0 1 1 1 110
INNOVATION 0.79 0.62 0 0.26 0.80 1.26 2.64 110
Control variables
TEAM CHIEF AGE 49.66 8.92 35 42 49 57 70 110
TECHNICAL DIRECTOR AGE 47.31 6.62 34 42 47.5 52 63 110
HEAD OF AERODYNAMICS AGE 47.04 6.70 34 43 46 50 63 110
TEAM CHIEF EXPERIENCE 12.76 11.38 0 5 9.5 15 45 110
TEAM CHIEF SEX 0.09 0.29 0 0 0 0 1 110
TECHNICAL DIRECTOR SEX 0 0 0 0 0 0 0 110
18 The first independent variable “PROCUREMENT” is a dummy variable, the descriptive statistics
give a mean of 0.71, where 1 is coded as making your own engine, and 0 being coded for the teams
that buy their engine from a third party supplier. There is no missing data or abnormalities. The statistic
shows that there are more teams that buy an engine than that make themselves. The descriptive
statistics display that the data can be used and is suitable for further analysis. The second independent
variable is “INNOVATION”, a variable that scores between 0 and 2.64 (min-max). The values are based
on a relative innovation performance, where 1 is a neutral figure and better innovating teams have a
value of higher than 1 and vice versa. With the standard deviation of 0.62, the maximum value can be
seen as an outlier. This outlier however needs not to be corrected, due to the nature of the dataset.
The control variables are three different categories, the first is age. The age of the Team chef,
technical director and head of aerodynamics. All values are comparable and show no abnormalities.
The second is experience, the experience of the team chef in Formula 1. The factor shows a lot of
variance, ranging from 0 to 45 years of experience. The last category is gender, the gender of the team
chef, technical director and head of aerodynamics. Only for the team, gender can play a role in
analysing, the other two variables have none, or only one count of different measure and are to small
to analyse. All control variables except the gender of the technical director and the gender of the head
of aerodynamics can be used to further analyse with the fixed effects model.
The full descriptive statistics can be found in appendix 3. In short, the correlation matrix shows
that the variables that are based on the financial variable have a significant positive effect on the
dependent variable. Additionally, the age of the team chef also has a significant negative relation with
the points scored, this is opposite of what theory prescribes (Castellucci et al., 2011). However, this is
a two dimensional outcome that has no further implications. The nature of panel data creates the need
for the account for a time factor. To analyse the time factor, the FEM and REM analysis have to be
executed.
4.2
Hypothesis testing
After it becomes clear which variables are able to be omitted after the descriptive statistics,
the rest of the variables can be used in the further analysis. The variables are analysed using the FEM
and REM method, after which the Hausman test is performed. For the sake of conciseness, the
Hausman test is discussed first to determine which model must be used to further test the
hypothesises. This enables the interpretation of the correct results and the hypothesis testing. In both
cases of the fixed effect model and random effect model, are displayed in a table that includes four
19
4.2.1 Hausman test
The Hausman test is based on the comparison of the two analysis models fixed effects and
random effects. Furthermore, the analysis is done with an interaction effect and without one. This
means that there are four different analysis done, one with and one without interaction effects for
both the FEM and REM, creating four different analyses. The Hausman test is performed with the
comparable models, without interaction effect of the FEM and REM and with the interaction effect for
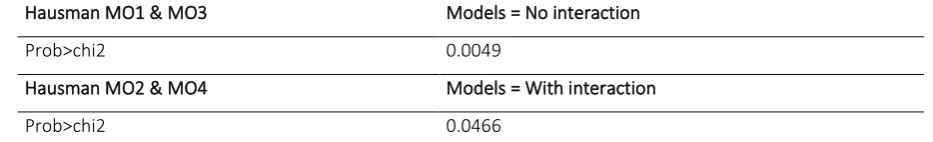
both. In table 2 the results of the Hausman test are shown, after which can be concluded whether the
[image:20.595.62.529.261.332.2]FEM or REM is further used in the analysis of this research.
Table 2 Hausman test with and without interaction effect
Hausman MO1 & MO3 Models = No interaction
Prob>chi2 0.0049
Hausman MO2 & MO4 Models = With interaction
Prob>chi2 0.0466
The Hausman test in table 2 shows the chi square value for both Hausman tests that have been
run. The null hypothesis of the Hausman test prefers the Random effects model. The rejection of the
null hypothesis therefore favours the Fixed effects model. The result of the first test shows a value of
0.0049 that is lower than 0.05, and favours the FEM in favour of the REM. The second test results in a
value of 0.0466, which is also lower than the significance level of 0.05. The test shows that for the
models with and without interaction effect, the FEM is preferred. this research will therefore use the
fixed effects model for further analysis of the dataset and hypothesis testing.
Besides the statistical explanation of the Hausmann test, there is another way of determining
which model suits better. The models both have different places of usage, where the fixed effects
model includes all observations as being true and assumes that there is one true effect that is the same
in every observation(Barbour et al., 1992; Schmidheiny, 2018; Torres-Reyna, 2007). The random
effects model assumes that there is in sample variation that is from within sample heterogeneity. The
random effect model is commonly used in meta-analysis to take into account the differences in
research samples. This research however does not make use of meta-analysis (Schmidheiny, 2018).
The data is obtained from the same resources for each grouping variable and differences are due to
chance. Therefore, in agreement with the Hausman test, the fixed effects model is best suited for the
analysis of this research.
20
4.2.2 Fixed effects model
The results of the Fixed effect model are the basis on which the hypothesis can be accepted or
rejected. In table 3 the different models are shown. The first model shows all the independent variables
with the control variables and without the interaction effect. The second model shows the same as
model one, but with the interaction variable. The third model shows only the dependent variables, and
the fourth model shows the dependent variables with including the interaction effect. The last two
models create the ability to check the control variables and the effect the control variables might have
on the overall model.
The dependent variable is the business performance of the team, which is the number of
points scored per season per team. The grouping variable used in the analysis is the team name. The
grouping variable identified 12 different groups that where each individually analysed. The team with
the least observable years had 2 years, and was usable for this research. The maximum number of
observations per grouping variable is 10, which is the number of years of the data is gathered from.
The remaining variables are used in the analysis as being independent and control variables.
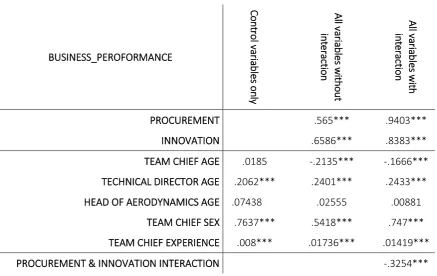
In table 3 the results of the four models are compared with one another. Additionally, the table
shows whether the results are significant and the level of significance. The data shows no new data
other than the significance level. The data shows the three hypothesis: H1: Procurement capabilities of a Formula 1 team positively influences the business performance. H2: Innovative performance of a Formula 1 team positively influences the business performance. H3: The procurement capabilities of a Formula 1 team positively influences the effect the innovative performance has on the business performance. The results of the FEM are now discussed.
Hypothesis 1 expects to find a positive relationship between the procurement capabilities of a
formula1 team and the business performance of the team. The procurement capabilities variable is
therefore analysed in the all encompassing model including control and interaction variables. The
procurement variable showed a positive significant relationship with business performance with a
coefficient value of 0.9403 at an α of 0.0001. The predictive power decreases when the interaction
effect is not included in the model with a coefficient value of 0.565, but the significance level remains
at an α of 0.0001. The data therefore is aligned wit the expectation of H1, leading to the ascertain that
there is enough statistical prove to accept hypothesis 1 in favour of rejecting hypothesis 1.
The second hypothesis suggests a positive significant relation between the innovation
performance of a Formula 1 team and their business performance. The complete model, including the
control and interaction variables is used to statistically analyse the relationship. The model
encompassing all the variables shows a positive significant relationship. The relation is significant at an
α level of 0.0001 with a coefficient of .8383. the model excluding the interaction term, give a value of
21 The positive significant values are as expected in hypothesis 2, leading to the accepting of hypothesis
2 in favour of rejecting it.
Finally, the third hypothesis describes a possible positive interaction effect between the
innovative performance and procurement capabilities, regarding the business performance of the
team. The fixed effects model including all variables reveals a negative significant result. The model
with the control variables has coefficient of -0.3254 and the results is significant at an α of 0.0001. In
contrast to what the third hypothesis expected, the relation was found to be significant negative.
Consequently, the third hypothesis must be rejected in favour of the acceptance of the hypothesis.
Table 3 FEM comparison of control variables and all variables except the interaction effect and the last model includes interaction effect *indicates significance level at 0.05 **indicates significance level at 0.01 ***indicates significance level at 0.001 BUSINESS_PEROFORMANCE C o n tro l va ria b le s o n ly A ll v ar ia b le s w ith o u t in te ra ct io n A ll v ar ia b le s w ith in te ra ct io n
PROCUREMENT .565*** .9403***
INNOVATION .6586*** .8383***
TEAM CHIEF AGE .0185 -.2135*** -.1666***
TECHNICAL DIRECTOR AGE .2062*** .2401*** .2433***
HEAD OF AERODYNAMICS AGE .07438 .02555 .00881
TEAM CHIEF SEX .7637*** .5418*** .747***
TEAM CHIEF EXPERIENCE .008*** .01736*** .01419***
PROCUREMENT & INNOVATION INTERACTION -.3254***
Lastly, the control variables. The age of the team chief is not significant positive in the model
including only the control variables. However, a significant negative relation is found in the models
including the dependent variables. The age of the technical director is found significant positive 0.2062
at an α level of 0.0001. The age of the head of aerodynamics is positive not significant. And the sex of
the team chief is positive significant at an α level of 0.0001. The experience of the team chief is also
[image:22.595.73.511.287.563.2]22
5.
Conclusion & discussion
The link between procurement capabilities, innovative performance and their effect on
business performance was yet to be researched with empirical data. Current literature is based on a
biased perspective. The research was based on the perception of innovation and procurement
managers on the role their capabilities and performance played within an organization. This research
aimed to find the link between the different aspects on the base of data obtained without the bias of
the relevant managers. Therefore, the highly innovative and technical Formula 1 industry is used to
obtain unbiased data. The industry lends itself for this research due to the large quantity of unbiased
data obtainable online.
The first two hypothesis test the individual effect of procurement capabilities and innovative
performance, on the business performance of the team. Both hypothesises are proven in previous
literature on the basis of the findings of managers. The hypothesis confirms that improved
procurement capabilities have a positive effect on the business performance of the team. Secondly,
the innovative performance also positively influences the business performance of a Formula 1 team.
This is in line with KBV, where unique capabilities of teams and better resources lead to a better
business performance of the Formula 1 teams.
This finding is supported by previous performed research, which was predominantly based on
perception of performance and capabilities by the managers of relevant departments (Goh et al., 1999;
Narasimhan & Das, 2001; Neely & Hii, 1998; Schiele, 2007a; Wong et al., 2016). The proven relationship
between procurement capabilities and business performance strengthens the believe that improved
capabilities improve business performance. Therefore, the procurement department can, and should
be a place of internal development and investment. This data research displays that this has a high
change of contributing to a better business performance.
The relationship between innovation and business performance is also confirmed in the
analysis. Consistent with previous research, the innovative performance of an organization does
improve business performance positively. Hence, suggesting that investing in innovative performance
of an organization to improve the performance can be expected to positively influence the business
performance. Concluding, investing and improving both individual factors of the procurement
capabilities and innovative performance, has a positive effect on overall business performance.
The third hypothesis tests an interaction effect. Whether the procurement capabilities and
innovative performance strengthen each other to improve the business performance even more than
the sum of the two individual factors already achieve (as seen in H1 & H2). In contrast to existing
literature about the interaction effect of procurement capabilities and innovative performance and
23 The rejection shows that, within the Formula 1 industry, the procurement capabilities and innovative
performance do not empower each other beyond their own effect on business performance.
The data and analyses led to a confirmation of existing literature. The knowledge based view,
evolved from resource based view, is further enforced on the view of personal capabilities as a unique
intangible asset of an organization. Two of the three hypothesises are accepted in favour of the
expectation supported by the literature research based theoretical model. However, the interaction
effect spoken about in existing literature between procurement and innovation has not been found in
this case study. This does not necessary means that there is no such interaction effect, due to the
nature of a case study there are some limitation.
This study has several limitations. The first one is the generalizability of the used dataset, the
Formula 1 is a highly innovative and highly technical environment. The Formula 1 team organizations
are often large multinationals, with some exceptions. This means that the data is not representative
for most SME’s nor other organizations not operating in a highly innovative or technical environment.
The second limitation of this study is the measurement of procurement capabilities. In spite of the fact
that the variable is a presentation of the procurement department, it is created of only one data point
for each team each year. It is also not used as a procurement indicator in other existing literature.
Future research might be in the direction of a more generalizable sample study. Meaning that
the data is not just focussed on a specific sector or industry. However, a sample of for example SME’s
in a certain counties or industries could be of interest. This might boost the usability of the research
for the workforce. Furthermore, a better measurement of procurement might be used to determine
the procurement capabilities of organizations. Lastly, future research could use a more in depth
analysis of organization by for example using interviews to create a possibility to analyse the data with
background information. Creating a perspective for the numbers used in the analysis.
The implications for organizations is limited, the nature of a case study always encompasses
limitations of the interpretation and usability10. Although, the study has several implications for
organizations that are active in a highly innovative and technology driven industry. This study implies
for them that the procurement capabilities have a significant effect on the business performance of
the organization. Moreover, the innovative performance of the organizations has more impact on the
overall business performance of the organizations. The link between these departments in an
organization is not denied by this research, only not further strengthened. Organizations that suite the
high tech, highly innovative and competitive prescription should focus on both of the departments to
further improve their business performance.
24
References
Adams, R., Bessant, J., & Phelps, R. (2006). Innovation management measurement: A review.
International Journal of Management Reviews, 8(1), 21–47. https://doi.org/10.1111/j.1468-2370.2006.00119.x
Akın Ateş, M., van Raaij, E. M., & Wynstra, F. (2018). The impact of purchasing strategy-structure (mis)fit on purchasing cost and innovation performance. Journal of Purchasing and Supply Management, 24(1), 68–82. https://doi.org/10.1016/j.pursup.2017.05.002
Aversa, P., Furnari, S., Haefliger, S., Row, B., & Ecy, L. (2015). Business model configurations and
performance : A qualitative comparative analysis in Formula 1 racing , 2005 – 2013. Industrial and Corporate Change, 24(3), 655–676. https://doi.org/10.1093/icc/dtv012
Barbour, A. D., Chen, L. H. Y., & Loh, W.-L. (1992). Compound Poisson Approximation for Nonnegative
Random Variables Via Stein’s Method. The Annals of Probability, 20(4), 1843–1866. https://doi.org/10.1214/aop/1176989531
Barney, J. (1991). Firm Resources and Sustained Competitive Advantage. Journal of Management,
17(1), 99–120. https://doi.org/10.1177/014920639101700108
Battese, G. E., & Coelli, T. J. (1995). A model for technical inefficiency effects in a stochastic frontier production function for panel data. Empirical Economics, 20(2), 325–332.
https://doi.org/10.1007/BF01205442
C.a, B., T.b, S., & M.c, K. (2013). Ambidextrous Governance in Supply Chains: The Impact on Innovation and Cost Performance. Journal of Supply Chain Management, 49(4), 59–80. https://doi.org/10.1111/jscm.12033
Camagni, R., & Capello, R. (1999). Innovation and Performance of SMEs in Italy: the Relevance of Spatial Aspects. In Competition & Change (Vol. 3, pp. 181–214). https://doi.org/10.1007/978-3-642-58524-1_9
Carey, S., Lawson, B., & Krause, D. R. (2011). Social capital configuration, legal bonds and
performance in buyer-supplier relationships. Journal of Operations Management, 29(4), 277–
288. https://doi.org/10.1016/j.jom.2010.08.003
Castellucci, F., Padula, M., & Pica, G. (2011). The age-productivity gradient: Evidence from a sample of F1 drivers. Labour Economics, 18(4), 464–473. https://doi.org/10.1016/j.labeco.2010.09.002 Castellucci, F., & Podolny, J. M. (2017). The dynamics of position, capability, and market competition.
Industrial and Corporate Change, 26(1), 21–39. https://doi.org/10.1093/icc/dtw016
Clark, K. B. (1989). Project Scope and Project Performance: The Effect of Parts Strategy and Supplier Involvement on Product Development. Management Science, 35(10), 1247–1263.
https://doi.org/10.1287/mnsc.35.10.1247
Conner, K. R. (1991). A Historical Comparison of Resource-Based Theory and Five Schools of Thought Within Industrial Organization Economics: Do We Have a New Theory of the Firm? Journal of Management, 17(1), 121–154. https://doi.org/10.1177/014920639101700109
Curado, C. (2006). THE KNOWLEDGE BASED-VIEW OF THE FIRM: FROM THEORETICAL ORIGINS TO FUTURE IMPLICATIONS. Universidade Téchnica de Lisboa.
Day, G. S., & Wensley, R. (1988). Assessing Advantage : for Framework Diagnosing Superiority
25 Dierickx, I., & Cool, K. (1989). Asset Stock Accumulation and the Sustainability of Competitive
Advantage: Reply. Management Science, 35(12), 1514–1514. https://doi.org/10.1287/mnsc.35.12.1514
Dwyer, S., Richard, O. C., & Chadwick, K. (2003). Gender diversity in management and firm performance: the influence of growth orientation and organizational culture. Journal of Business Research, 56(12), 1009–1019. https://doi.org/10.1016/S0148-2963(01)00329-0 European, C. (1995). Green Paper on Innovation. Retrieved from
http://europa.eu/documents/comm/green_papers/pdf/com95_688_en.pdf
Franco-Santos, M., Kennerley, M., Micheli, P., Martinez, V., Mason, S., Marr, B., … Neely, A. (2007).
Towards a definition of a business performance measurement system. International Journal of Operations & Production Management, 27(May 2014), 784–801.
https://doi.org/10.1108/01443570710763778
Geroski, P., & Machin, S. (1992). Do Innovating Firms Outperform Non-Innovators? Business Strategy Review, 3(2), 79–90. https://doi.org/10.1111/j.1467-8616.1992.tb00030.x
Goh, M., Lau, G. T., & Neo, L. (1999). Strategic Role and Contribution of Purchasing in Singapore: A Survey of CEOs. The Journal of Supply Chain Management, 35(4), 12–23.
https://doi.org/10.1111/j.1745-493X.1999.tb00240.x
Grant, R. M. (1996). Toward a knowledge-based theory of the firm. Strategic Management Journal,
17(S2), 109–122. https://doi.org/10.1002/smj.4250171110
Grant, R. M., & Grant, R. M. (2005). Contemporary Strategy Analysis: Concepts, Techniques, Applications (Fifth Edit). Malden: Blackwell Publishing.
Hesselink, L. (1988). Digital Image Processing in Flow Visualization. Annual Review of Fluid Mechanics,
20(1), 421–486. https://doi.org/10.1146/annurev.fl.20.010188.002225
Hong, P., & Kwon, H. B. (2012). Emerging issues of procurement management: a review and prospect. International Journal of Procurement Management, 5(4), 452.
https://doi.org/10.1504/IJPM.2012.047199
Houman, P., & Rask, M. (2003). Supply chain management : new organisational practices for
changing procurement realities. 9, 83–95. https://doi.org/10.1016/S1478-4092(02)00037-7 Jenkins, M. (2010). Technological Discontinuities and Competitive Advantage: A Historical
Perspective on Formula 1 Motor Racing 1950-2006. Journal of Management Studies, 47(5), 884–910. https://doi.org/10.1111/j.1467-6486.2010.00928.x
Jenkins, M. (2014). Innovate or Imitate? The Role of Collective Beliefs in Competences in Competing Firms. Long Range Planning, 47(4), 173–185. https://doi.org/10.1016/j.lrp.2013.04.001
Jensen, M. C., & Meckling, W. H. (1976). Theory of the Firm : Managerial Behavior , Agency Costs and
Ownership Structure Theory of the Firm : Managerial Behavior , Agency Costs and Ownership
Structure. Journal of Financial Economics, 3(4), 305–360. https://doi.org/doi.org/10.1016/0304-405X(76)90026-X
Kirwan, B., Martin, B., Rycraft, H., & Smith, A. (1990). Human Error Data Collection and Data Generation. International Journal of Quality & Reliability Management, 7(4),
02656719010004522. https://doi.org/10.1108/02656719010004522
26 Lado, A. A., Boyd, N. G., Wright, P., Kroll, M., Lado, A. A., Boyd, N. G., & Kroll, M. (2006). PARADOX
AND THEORIZING WITHIN THE RESOURCE-BASED VIEW. Academy of Management Review,
31(1), 115–131. https://doi.org/10.2307/20159188 https://www.jstor.org/stable/20159188 Luzzini, D., Amann, M., Caniato, F., Essig, M., & Ronchi, S. (2015). The path of innovation: Purchasing
and supplier involvement into new product development. Industrial Marketing Management,
47, 109–120. https://doi.org/10.1016/j.indmarman.2015.02.034
Mathews, J. A. (2003). Competitive dynamics and economic learning : an extended resource-based view. Industrial and Corporate Change, 12(1), 115–145.
https://doi.org/https://doi.org/10.1093/icc/12.1.115
Narasimhan, R., & Das, A. (2001). The impact of purchasing integration and practices on manufacturing performance. Journal of Operations Management, 19(5), 593–609. https://doi.org/10.1016/S0272-6963(01)00055-9
NCSS Statistics, S. (2019). Two-Stage Least Squares. NCSS Statistical Software, pp. 316-1;316-10. Retrieved from
https://ncss-wpengine.netdna-ssl.com/wp-content/themes/ncss/pdf/Procedures/NCSS/Two-Stage_Least_Squares.pdf
Neely, A., & Hii, J. (1998). Innovation and Business Performance: A Literature Review. The Judge Institute of Management Studies University of Cambrigde, (January), 57. Retrieved from http://89.249.21.76/data/696/521/1221/litreview_innov1.pdf
Newbert, S. L. (2007). Empirical research on the resource-based view of the firm: an assessment and suggestions for future research. Strategic Management Journal, 28(2), 121–146.
https://doi.org/10.1002/smj.573
Nollet, J., & Beaulieu, M. (2003). The development of group purchasing: An empirical study in the healthcare sector. Journal of Purchasing and Supply Management, 9(1), 3–10.
https://doi.org/10.1016/S0969-7012(02)00034-5
Paulraj, A., Chen, I. J., & Flynn, J. (2006). Levels of strategic purchasing: Impact on supply integration and performance. Journal of Purchasing and Supply Management, 12(3), 107–122.
https://doi.org/10.1016/j.pursup.2006.08.002
Penrose, E, T. (1959). The Theory of Growht of the Firm. New York: John Wiley.
Perryman, A. A., Fernando, G. D., & Tripathy, A. (2016). Do gender differences persist? An
examination of gender diversity on firm performance, risk, and executive compensation. Journal of Business Research, 69(2), 579–586. https://doi.org/10.1016/j.jbusres.2015.05.013
Psillaki, Maria; Kaskalakis, N. (2009). Are the determinants of capital structure country or firm specific. Small Business Economics2, 33(3), 319–313. https://doi.org/10.1007/sl
Ragatz, G. L., Handfield, R. B., & Petersen, K. J. (2002). Benefits associated with supplier integration into new product development under conditions of technology uncertainty. Journal of Business Research, 55(5), 389–400. https://doi.org/10.1016/S0148-2963(00)00158-2
Ramsay, J. (2001). The Resource Based Perspective , Rents , and Purchasing ’ s Contribution. Journal of Supply Chain Management, (August), 38–47. https://doi.org/https://doi.org/10.1111/j.1745-493X.2001.tb00104.x
Schiele, H. (2007a). Supply-management maturity, cost savings and purchasing absorptive capacity: Testing the procurement–performance link. Journal of Purchasing and Supply Management,
13(4), 274–293. https://doi.org/10.1016/j.pursup.2007.10.002