Selection, Subdivision and Extinction and Recolonization
Joshua L. Cherry
1National Center for Biotechnology Information, National Library of Medicine, National Institutes of Health, Bethesda, Maryland 20894
Manuscript received April 14, 2003 Accepted for publication November 2, 2003
ABSTRACT
In a subdivided population, the interaction between natural selection and stochastic change in allele frequency is affected by the occurrence of local extinction and subsequent recolonization. The relative importance of selection can be diminished by this additional source of stochastic change in allele frequency. Results are presented for subdivided populations with extinction and recolonization where there is more than one founding allele after extinction, where these may tend to come from the same source deme, where the number of founding alleles is variable or the founders make unequal contributions, and where there is dominance for fitness or local frequency dependence. The behavior of a selected allele in a subdivided population is in all these situations approximately the same as that of an allele with different selection parameters in an unstructured population with a different size. The magnitude of the quantity
Nese, which determines fixation probability in the case of genic selection, is always decreased by extinction and recolonization, so that deleterious alleles are more likely to fix and advantageous alleles less likely to do so. The importance of dominance or frequency dependence is also altered by extinction and recolonization. Computer simulations confirm that the theoretical predictions of both fixation probabilities and mean times to fixation are good approximations.
P
OPULATION subdivision has many population- between theNethat applies to fixation probabilities ofselected alleles and theNe describing the behavior of
genetic consequences. The amount of neutral
varia-tion maintained in a populavaria-tion, the distribuvaria-tion of neutral alleles can in some cases be resolved with the notion of the effective selection coefficientse(Cherry
coalescence times, expected times to fixation or loss of
alleles, and fixation probabilities of selected alleles can andWakeley 2003).Nese, rather than Nes, determines
fixation probability.Neis raised by subdivision, butseis
all be altered by subdivision. An important determinant
of the magnitudes, and even the directions, of these lowered such thatNeseis unaltered by subdivision. This
framework is consistent with the fact that although fixa-effects is whether gene flow among subpopulations
in-tion probabilities are unaffected by subdivision, times cludes local extinction and subsequent recolonization.
to fixation are increased. In the absence of extinction and recolonization,
sub-If the assumption of simple genic selection is re-division increases the amount of standing neutral
varia-laxed—if there is dominance for fitness or frequency-tion and lengthens coalescence times. By these measures
dependent selection—fixation probabilities are altered subdivision therefore increases effective population size,
by subdivision, even in the absence of extinction and Ne. Extinction and recolonization can diminish and
recolonization (Slatkin1981;Lande 1985;Spiritoet even reverse these effects (Slatkin 1977; Maruyama
al. 1993; Cherry 2003a). Specifically, subdivision de-andKimura1980), so that effective size can be either
creases the importance of dominance or frequency de-larger or smaller than actual size.
pendence. This effect can be described in terms of effec-The simplest case involving natural selection is genic
tive values of the additional parameters that describe selection in the absence of extinction and
recoloniza-the more complex selection regime (Cherry2003a). tion. Under these conditions, so long as migration is
Extinction and recolonization can alter fixation prob-symmetric, subdivision has no effect on the fixation
abilities, even with simple genic selection (Barton probability of an allele under selection (Maruyama
1993). The effect of this type of population structure 1970, 1974). This would seem to suggest that for the
is to decrease the importance of selection relative to purpose of understanding the behavior of selected
al-stochastic forces; extinction and recolonization is an lelesNeis unaffected by subdivision, since fixation
prob-additional stochastic force that brings with it no addi-ability is generally thought of as a function ofNes, where
tional directional change. The interaction between nat-sis the selection coefficient. The apparent discrepancy
ural selection and extinction and recolonization has been a subject of much recent theoretical work (Cherry 2003b;RozeandRousset2003;Whitlock2003).
1Address for correspondence:National Center for Biotechnology
Infor-Cherry (2003b) derived results for genic selection
mation, National Library of Medicine, National Institutes of Health, 45
Center Dr., Bethesda, MD 20894. E-mail: [email protected] in a finite island model with extinction and
tion by a single founding allele. Here I extend these parameters of this equivalent panmictic population are, by definition, the effective population size (Ne), the
results in two ways. First, I allow for recolonization by
multiple founders, which may have a tendency to origi- effective selection coefficient (se), and, in the case of
dominance, the effective dominance parameter (he).
nate from the same deme. Second, I obtain results that
apply when there is dominance for fitness or, what is Founders chosen independently:I first consider the case of genic selection where the founders that recolo-formally equivalent, a form of frequency-dependent
se-lection. nize an extinct deme have no particular tendency to originate from a common source deme. This case corre-sponds toSlatkin’s (1977) “migrant pool” model.
MODELS AND RESULTS
The mean change in allele frequency in the popula-tion as a whole is the mean of the within-deme mean The model of population structure considered here
is the finite island model. In this modelDdemes, each changes due to selection (because migration and recolo-nization are symmetric they do not, on average, change consisting ofNhaploid orN/2 diploid individuals,
ex-change migrants among themselves and also serve as the allele frequency). For a deme whose allele frequency isx, the mean change due to selection is approximately sources for recolonization of extinct demes. The
ex-pected fraction of migrant alleles entering a deme in a sx(1 ⫺ x), where s is the selection coefficient. Thus the expected value of the mean change in the entire generation is m. The probability of extinction of any
given deme in any generation is. Subsequent to extinc- population isⵑsE[x(1⫺x)], where the expectation is taken across the quasi-equilibrium distribution ofx. The tion, a deme is recolonized bykfounding alleles. The
subpopulation then immediately grows to full size. quasi-equilibrium value ofE[x(1⫺x)] can be obtained from a recursion that gives this expected value in one Every deme receives migrants and colonists from the
population as a whole, in which the allele frequency is generation as a function of its value in the previous generation and the previous value of E[x]. Let H ⫽ x. Suppose thatxchanges slowly compared to the allele
frequency in any deme. From the point of view of any E[2x(1⫺ x)]. This quantity is the probability that two copies of the gene sampled from the same deme, inde-deme, the population as a whole looks, in the short
term, much like a source population with constant allele pendently and with replacement, are in distinct allelic states. LetHtbe the value ofHin generationt. We seek
frequencyx. The distribution of the within-deme allele
frequencies will then attain a quasi-equilibrium, which an expression forHt⫹1in terms orHt andE[x].
For two copies of the gene sampled at timet⫹1 to corresponds to the equilibrium of a source-sink
(conti-nent-island) model. Forxto change sufficiently slowly, be in different allelic states, it is necessary that the same copy of the locus has not been sampled twice (probabil-two conditions must hold. First, the number of demes
must be large, so that the stochastic change in the overall ity 1 ⫺ 1/N). Assuming that this is the case there are several possibilities to consider. There may have just allele frequency is small compared to the within-deme
been an extinction/recolonization event (probability stochastic change. Second, selection must be weak in
), in which case the two copies of the gene may or the sense that the magnitudes of selective differences
may not be descended from distinct founders (probabil-are small comp(probabil-ared to the reciprocal of the deme size
ities 1 ⫺ 1/k and 1/k, respectively). The two can be N. This condition allows selection to have a significant
allelically distinct only if they are descended from dis-effect on the behavior of an allele in the population as
tinct founders, in which case they are different with a whole because the size of the entire population is
probability 2x(1⫺x). If there has not just been an ex-much larger thanN. This assumption has the additional
tinction/recolonization event (probability 1⫺ ), zero, consequence that selection can be neglected in the
deri-one, or both of the sampled alleles may be migrants. If vation of the quasi-equilibrium distribution of
within-neither is a migrant, the immediate ancestors of the deme allele frequency. I make these two assumptions—
sampled pair are chosen independently and with re-that the number of demes is large and re-that selection is
placement from generationt. Thus the probability that weak compared to 1/N—in all that follows.
they are allelically distinct isHt. If exactly one is a
mi-The temporal trajectory of an allele’s frequency is
grant, the probability is E[x](1⫺x)⫹ (1⫺E[x])x, the outcome of the interaction between the directional
where E[x] refers to the expectation in the previous effects of natural selection and the stochastic effects of
generation. If both are migrants, they are chosen inde-genetic drift and extinction/recolonization. A diffusion
pendently from the population at large, so the probabil-approximation for these processes gives a complete
sta-ity that they are in different allelic states is 2x(1 ⫺x). tistical description of this trajectory. The diffusion is
Therefore specified completely by expressions for the mean and
variance of the per-generation change in allele fre- H
t⫹1⫽(1⫺1/N) quency as functions of the allele frequency. For the
⫻{(1⫺ )[(1⫺m)2H
t⫹2m(1⫺m)(E[x](1⫺x)⫹(1⫺E[x])x)
cases considered here, the diffusion turns out to be approximately the same as that describing a panmictic
⫹m22x(1⫺x)] population whose size and selection parameters are
where againE[x] refers to the expectation in the previ- Ⰶ1,E[x⬘]⬇x. The distribution ofx⬘is a mixture of two components, one corresponding to extinction and ous generation. At equilibrium,E[x]⫽ x. The
equilib-rium condition forHis therefore recolonization and another to the binomial sampling that occurs in the absence of extinction. Conditional
H⫽(1⫺1/N){(1⫺ )[(1⫺m)2H⫹(2m⫺m2)2x(1⫺x)]
on no extinction, the second moment about E[x⬘] is
ⵑ(1/N)x(1⫺ x) (the familiar binomial sampling
vari-⫹ (1⫺1/k)2x(1⫺x)}. (2)
ance). The expected value of this quantity over the Solution forHgives distribution ofxis (1/N)(1⫺ F
ST)x(1 ⫺x). The case of
extinction and recolonization is more complicated. Let
H⫽(1⫺1/N)[(1⫺ )(2m⫺m
2)⫹ (1⫺1/
k)]
1⫺(1⫺1/N)(1⫺ )(1⫺m)2 2x(1⫺x) ybe the allele frequency after recolonization. The
vari-ance of y is about equal to the variance in the allele frequency among the founders. The number of thek
⫽(N⫺1)[(1⫺ )(2m⫺m2)⫹ (1⫺1/k)]
N⫺(N⫺1)(1⫺ )(1⫺m)2 2x(1⫺x). (3)
founders that carry theAallele has a binomial distribu-tion with number of “trials”kand probability of “suc-FST is defined by 1⫺ FST⬅E[x(1⫺ x)]/x(1 ⫺x) ⫽
cess” x. The variance in the number of A alleles is H/2x(1 ⫺x). Because H is proportional to x(1⫺x),
kx(1⫺ x), and the variance in the fraction ofAalleles FSTwill be independent ofx, as it is in the absence of
is (1/k)x(1 ⫺x). Thus, since the mean of y is x, the extinction and recolonization. From Equation 3 it
fol-second moment of yabout zero, E[y2], is ⵑ(1/k)x(1⫺
lows that
x)⫹ x2. The second moment about x, E[(y ⫺ x)2]⫽
E[y2]⫺2E[y]x⫹ x2, isⵑ(1/k)x(1 ⫺x)⫹ x2⫺ 2xx⫹
1⫺FST⫽
(N⫺ 1)[(1⫺ )(2m⫺ m2)⫹ (1⫺ 1/k)]
N ⫺(N ⫺1)(1⫺ )(1⫺ m)2
x2. We know that at equilibriumE[x]⫽xandE[x(1⫺
x)] ⫽ (1 ⫺ FST)x(1 ⫺ x), and therefore E[x2] ⫽ x⫺
⬇2Nm⫹ N(1 ⫺1/k)
2Nm⫹ N ⫹1 , (4) (1⫺FST)x(1 ⫺x). It follows from substitution and re-arrangement that the expected value of the second mo-ment ofyaboutxisⵑ[(1/k)⫹FST]x(1⫺x).
Combin-where the approximate equality holds for smallm, large
ing the two components of the variance ofx⬘gives N, and small. For ⫽0, the approximate expression
reduces to 2Nm/(2Nm⫹1), a familiar approximation
E[Var(x⬘)]⬇
冦
(1⫺ )1N(1⫺FST)⫹
冤
1
k⫹FST
冥冧
x(1⫺x).for 1⫺FSTfor an island model with ordinary migration
(Wright1940;DobzhanskyandWright1941).
(7) The above shows that the mean change in x in a
generation, M⌬x, is approximated by (1⫺ FST)sx(1 ⫺ This is the expected variance of the change in a single
deme. The variance of ⌬x, the change in the overall x), withFSTgiven by Equation 4. BecauseFSTis
indepen-dent ofx, the effective selection coefficient can be de- allele frequency, is given by fined byM⌬x⫽ sex(1⫺x).seis equal to (1⫺FST)s, and
therefore V⌬x⫽
1 D2兺i
Var(⌬xi)
se⫽
冢
(N⫺1)[(1⫺ )(2m⫺m2)⫹ (1⫺1/k)]
N⫺(N⫺ 1)(1⫺ )(1⫺m)2
冣
s (5) ⬇ 1DE[Var(⌬xi)] ⬇
冢
2Nm⫹N(1⫺1/k)2Nm⫹N ⫹1
冣
s. (6) ⬇ 1D
冦
(1⫺ ) 1N(1⫺FST)⫹
冤
1k⫹ FST
冥冧
x(1⫺x), (8) The effective population size can be defined in termswherexi is the allele frequency in the ith deme. Thus
of the variance in the change in overall allele frequency
V⌬x is approximately proportional to x(1⫺ x), as it is
in a generation (⌬x). This overall variance is a
combina-in a panmictic population, and the variance effective tion of within-deme variances. The variance of the
size can be defined byV⌬x⫽(1/Ne)x(1 ⫺x). From this
change within a deme is a function of the local allele
definition and Equation 8 it follows that frequency. To obtain the variance in⌬x,V⌬x, I first derive
an expression for the within-deme variance conditional
Ne⬇
ND
(1 ⫺FST)⫹N[(1/k)⫹FST]
, (9) on allele frequency. I then take the mean across the
quasi-equilibrium distribution of allele frequency,
which leads to an approximate expression for the overall withFSTgiven by Equation 4.Necan be larger or smaller
than the actual population sizeND, depending on the variance.
Let xbe the allele frequency within a representative parametersN,m,, andk.
Founders that tend to come from the same deme: deme in one generation andx⬘be the frequency in the
next. The variance of⌬x, the change in allele frequency, So far it has been assumed that the individuals that recolonize an extinct deme have no particular tendency is equal to the variance ofx⬘, which is the second
deme. Slatkin (1977) analyzed a model (the “propa- ance of their sum. The covariance of a pair is given by Cov(⌼i,⌼j)⫽E[⌼i⌼j]⫺E[⌼i]E[⌼j]. ClearlyE[⌼i]E[⌼j]⫽
gule pool” model) in which all of the founders always
come from the same deme. Whitlock and Barton x2.E[⌼
i⌼j] is the probability that both the ith and jth
founders carry theAallele. Consider the case wherei⬆ (1997) presented more general results that allowed for
any degree of the tendency for a common deme of j. With probability 1⫺ φ, the corresponding founders come from different demes and the conditional proba-origin. The methods used above can be adapted to give
results for alleles under selection with this pattern of bility that both carry A is x2. With probability φ they
come from the same deme, and the conditional proba-recolonization.
FollowingWhitlockandBarton(1997), but using bility that they both carry theAallele isE[x2
i]⫽E[xi]⫺
E[xi(1⫺xi)]⫽x⫺(1⫺FST)x(1⫺x)⫽FSTx(1⫺x)⫹
a haploid model, letφbe the probability that two distinct
founders come from the same deme. As above, we seek x2. Therefore the unconditional probability that both
carryAis (1⫺φ)x2⫹φ[F
STx(1⫺x)⫹x2]⫽φFSTx(1⫺
an equilibrium value ofH, the probability that two genes
sampled from within a deme are allelically distinct. Now x)⫹ x2and
there are two cases to consider when a sampled pair
Cov(⌼i,⌼j)⫽φFSTx(1⫺ x). (13)
are immediate descendants of distinct founders. With
probability 1 ⫺ φ the founders come from different The variance of⌼iis simply the Bernoulli variancex(1⫺
demes and the conditional probability that they carry x). The variance of the sum of the⌼iis the sum of their
distinct alleles is 2x(1⫺x). With probability φ they variances plus twice the sum of the covariances of dis-come from the same deme and the conditional probabil- tinct pairs:
ity that they are distinct is H(of the previous
genera-Var(
兺
⌼i)⫽ kVar(⌼i)⫹k(k⫺1)Cov(⌼i,⌼j) (14)tion). The equilibrium condition forHis therefore
⫽ [k⫹k(k⫺1)φFST]x(1⫺x). (15) H⫽(1⫺1/N){(1⫺ )[(1⫺m)2H⫹(2m⫺m2)2x(1⫺x)]
The variance of the fraction of A alleles in the newly ⫹ (1⫺1/k)[(1⫺φ)2x(1⫺x)⫹φH]}
formed population is given approximately by (10)
Var(y)⬇
冤
1 k⫹k⫺1
k φFST
冥
x(1 ⫺x). (16) (compare to Equation 2). Solving forH, and using 1⫺FST⫽H/2x(1⫺ x), we obtain
Thus the analog of Equation 7 for the more general 1⫺FST⫽
(1⫺1/N)[(1⫺ )(2m(1⫺m)⫹m2)⫹ (1⫺1/k)(1⫺φ)]
1⫺(1⫺1/N)(1⫺ )(1⫺m)2⫺(1⫺1/N)(1⫺1/k)φ case is
E[Var(x⬘)]⬇
冦
(1⫺ )1N(1⫺FST)⫹
冤
1 k⫹冢
k⫺1
k φ⫹1
冣
FST冥冧
x(1⫺x). ⬇ 2Nm⫹N(1⫺1/k)(1⫺φ)2Nm⫹N[1⫺φ(1⫺1/k)]⫹1. (11)
(17) The approximate equality is equivalent to an expression
This leads to forFSTgiven byWhitlockandBarton(1997, Equation
21).
V⌬x⬇
1
D
冦
(1⫺ )1
N(1⫺FST)⫹
冤
1
k⫹
冢
k⫺1k φ⫹1
冣
FST冥冧
x(1⫺x)AgainFSTis independent ofx, soseis well defined. It
is given by (18)
and
se⫽
冢
(1⫺1/N)[(1⫺ )(2m(1⫺m)⫹m2)⫹ (1⫺1/k)(1⫺φ)] 1⫺(1⫺1/N)(1⫺ )(1⫺m)2⫺(1⫺1/N)(1⫺1/k)φ
冣
sNe⬇
ND
(1⫺ FST)⫹ N[(1/k)⫹(((k⫺ 1)/k)φ⫹1)FST] ⬇
冢
2Nm⫹N(1⫺1/k)(1⫺φ)2Nm⫹N[1⫺φ(1⫺1/k)]⫹1
冣
s. (12)(19) I now turn to the variance of the change in allele
frequency in a deme, which leads to an expression for (compare to Equations 8 and 9). Equation 19 can be shown, with the aid of Equation 11, to be equivalent to the effective population size. The component of the
variance due to ordinary drift is the same as in Equation a result obtained byWhitlockandBarton(1997). These results show that a selected allele in a subdi-7, but the component due to extinction and
recoloniza-tion must be modified. The number ofAalleles among vided population with extinction and recolonization be-haves much like an allele with a different selection coef-the kfounders is the sum ofkBernoulli random
vari-ables, ⌼i, that are 1 when theith founder carries anA ficient in a panmictic population with a different size.
This follows from the fact that both the mean and the allele (probabilityx) and 0 when it carries ana
(proba-bility 1⫺x). When founders are chosen without regard variance of the change in allele frequency are approxi-mately proportional tox(1⫺x), as they are in a panmic-to the deme of origin, these Bernoulli random variables
are independent, and the distribution is a binomial. In tic population (expressions for this mean and variance completely determine the diffusion approximation). the more general case the⌼iare not independent and
seandNe, are given by Equations 12 and 19. The value Cov(i,j)⫽ [1/kˆ⫹ (1⫺1/kˆ)φFST]x(1⫺x). (22)
ofNese, which determines fixation probability, is altered
The variance in the sum of thei is given by
by subdivision with extinction and recolonization.
Spe-cifically, Var(
兺
(i))⫽N Var(i)⫹N(N⫺1)Cov(i,j)⫽Nx(1⫺x)⫹N(N⫺1)[1/kˆ⫹(1⫺1/kˆ)φFST]x(1⫺x) Nese⬇
(1⫺FST)
(1⫺FST)⫹N[(1/k)⫹(((k⫺1)/k)φ⫹1)FST] NDs
(23) (20) and the variance in the allele frequency after
recoloniza-tion is given by and the effect of extinction and recolonization is to
reduce the magnitude ofNese.
Var(y)⫽
冤
N⫺ 1 N冢
1 kˆ⫹
kˆ⫺1 kˆ φFST
冣
⫹1
N
冥
x(1 ⫺x). (24) More complicated patterns of colonization: In theforegoing it was assumed that the number of founders
Forkˆ⫽k, this equation differs slightly from Equation was fixed and that they contributed equally to the new
16. The reason is that Equation 16 took the variance in population. The number of founders might vary
ran-allele frequency in the new population to be equal to domly, and the contributions of founders might be
un-the variance among un-the founders, whereas Equation 24 equal. For the present purposes, these details can be
includes additional variance due to multinomial sam-summed up by a single number␣, the probability that
pling of the founders in the formation of the new popu-two distinct copies of the gene in a newly recolonized
lation. Which expression is more appropriate depends deme descend from the same founding allele. Suppose,
on the details of the colonization process, but the effect for example, that the number of founders is one with
of the difference on Ne is negligible. This is evident
probability 1/4, two with probability 1/2, and three with
from comparison of Equation 19 with the expression probability 1/4. Then␣ ⫽ (1/4)(1) ⫹ (1/2)(1/2)⫹
forNecorresponding to Equation 24:
(1/4)(1/3)⫽ 7/12. More generally, ␣ equals the ex-pected value of 1/kwhen founders make equal
contri-Ne⬇ ND
(1⫺FST)⫹(N⫺1)[(1/kˆ)⫹(((kˆ⫺1)/kˆ)φ⫹1)FST]⫹ .
butions to the new population. Suppose, to take another
example, that there are always two founders, but that (25) one gives rise to, on average, a fraction a of the new
Dominance or local frequency dependence:Suppose population while the other gives rise to the remaining
that in a diploid population the fitnesses of the geno-1 ⫺ a. Then ␣ ⫽ a2 ⫹ (1 ⫺ a)2 ⫽ 1 ⫺ 2a(1 ⫺ a).
typesaa,Aa, andAAare given by 1, 1⫹2hs, and 1⫹ Because␣ ⫽1/kwith fixedkand equal contributions,
2s, respectively. The average selective difference be-it makes sense to define the effective number of
found-tween anAand anaallele, the marginal selection coef-ers,kˆ, by␣ ⫽1/kˆ.
ficientsˆ, depends on the allele frequencyxand is given Expressions forFST, and hencese, for the present gen- by
sˆ(x)⫽2hs(1⫺x)⫹(2s⫺2hs)xin an unstructured eralization are straightforward modifications of results
population with nonassortative mating.sˆcan be written for the special case presented earlier. In Equation 10,
ask0⫹ k1x, withk0 ⫽2hsandk1 ⫽2s⫺ 4hs. Thus the
the number of founderskmatters only in that it
deter-effect of dominance on fitness is formally equivalent to mines the probability of descent from the same founder.
frequency-dependent selection where fitness is a linear Thus simply replacingkwith kˆgives the more general
function of allele frequency. result:
Consider now a subdivided population. The expected change in overall allele frequencyxis the mean of the
1⫺FST⫽
(1⫺1/N)[(1⫺ )(2m(1⫺m)⫹m2)⫹ (1⫺1/kˆ)(1⫺φ)]
1⫺(1⫺1/N)(1⫺ )(1⫺m)2⫺(1⫺1/N)(1⫺1/kˆ)φ
expected changes due to selection across all demes:
E[⌬x]⫽ (1/D)
兺
i
sˆ(xi)xi(1⫺xi) ⬇ 2Nm⫹N(1⫺1/kˆ)(1⫺φ)
2Nm⫹N[1⫺φ(1⫺1/kˆ)]⫹1. (21)
⬇k0E[xi(1⫺xi)]⫹k1E[x2i(1⫺ xi)]. (26)
As before,se⫽(1 ⫺FST)s.
That␣ ⫽1/kˆis sufficient to determine the variance We have already established thatE[xi(1⫺ xi)]⫽ (1⫺
of⌬xis more difficult to show. The number ofAalleles FST)x(1⫺x) at quasi-equilibrium, withFSTgiven by
Equa-in a deme after recolonization is the sum ofNBernoulli tion 4. The problem is then to findE[xi2(1 ⫺ xi)]. In
random variables, i, that are 1 if the ith individual the absence of extinction and recolonization, this
ex-carries an Aallele and 0 otherwise. The variance of i pectation followed from the moments of the beta
distri-isx(1⫺x). We seek the covariance ofiandjfori⬆ bution that approximately characterizes within-deme
j. This is given by Cov(i,j)⫽E[ij]⫺E[i]E[j].E[i]⫽ allele frequency under that condition (Whitlock2002;
x, so E[i]E[j] ⫽ x2.E[ij] is the probability that two Cherry 2003a). In the presence of extinction and
distinct copies of the gene are bothA’s. This is equal to recolonization this distribution is unknown. However, (1/kˆ)x⫹(1⫺1/kˆ)[(1⫺φ)x2⫹φ(F
STx(1⫺x)⫹x2)]⫽ just as we derived quasi-equilibrium conditions forH⫽
2E[xi(1⫺xi)] (Equations 2 and 10), we can write such
conditions forE[xi2(1⫺xi)]. As in the case ofE[xi(1⫺ 2. With probability 3/N, one pair of the triple
repre-sents resampling of the same copy of the locus. There xi)], it is convenient to think in terms of
probabili-ties of sampling certain allele configurations. Let I ⫽ will be two A’s and one a when the twice-sampled copy is an Aand the other is an a, which happens E[3xi2(1⫺xi)].Iis then the probability that three copies
of the gene sampled from the same deme, indepen- with probabilityH/2. dently and with replacement, consist of two copies of
Putting this all together gives the Aallele and one of the a allele. Consideration of
the ways in which such a sample can arise, and of their
I⬇(1⫺3/N){(1⫺ )[(1⫺3m)I⫹3m(3(1⫺FST)x2(1⫺x)
probabilities as functions of conditions in the previous
generation, yields the desired quasi-equilibrium condi- ⫹FSTx(1⫺x))]
tion forI.
⫹ [3(1⫺1/k)(1⫺2/k)x2(1⫺x)
To limit the number of cases that must be considered,
I immediately adopt approximations for smallmand ⫹3(1/k)(1⫺1/k)x(1⫺x)]} and large N that neglect possibilities involving two or
⫹(3/N)(1⫺FST)x(1⫺x) (27)
more unlikely events. For example, the probability that no member of a triple is a migrant is approximated by
at quasi-equilibrium. Solution forIgives 1⫺3m, the probability that exactly one is a migrant is
approximated by 3m, and the possibility that more than
I⬇[(1⫺3/N){3m[3(1⫺FST)x2(1⫺x)⫹FSTx(1⫺x)] one is a migrant is neglected. Even with such
simplifica-⫹ [3(1⫺1/k)(1⫺2/k)x2(1⫺x) tions, there are many cases to consider, which I
enumer-ate hierarchically below for the migrant pool model.
⫹3(1/k)(1⫺1/k)x(1⫺x)]}
1. With probability 1⫺3/N, all three members of the ⫹(3/N)(1⫺F
ST)x(1⫺x)]/[1⫺(1⫺3/N)(1⫺ )(1⫺3m)].
sample are distinct (no copy of the locus has been (28)
sampled twice).
a. With probability 1 ⫺ , extinction has not oc- Neglecting second-order terms in the denominator, us-curred. ing 1⫺ 3/N ⬇ 1, and multiplying numerator and
de-i. With probability 1⫺3m, none of the sampled nominator byN/3 gives alleles is a migrant. In this case the probability
I⬇[Nm[3(1⫺FST)x2(1⫺ x)⫹FSTx(1⫺ x)]
of two A’s and one a is the value of I in the
previous generation. ⫹ (N/3)[3(1⫺1/k)(1⫺2/k)x2(1⫺ x)
ii. With probability 3m, one member of the
sam-⫹ 3(1/k)(1⫺1/k)x(1⫺x)] ple is a migrant. There are two ways that there
can be twoA’s and onea. The two nonmigrants ⫹ (1⫺F
ST)x(1⫺x)]/[Nm⫹ N/3⫹1]. (29)
can be allelically distinct and the migrant a
copy of the Aallele [probabilityHx⫽ 2(1 ⫺ This daunting expression can be written in the form FST)x2(1⫺x)], or both nonmigrants can beA’s c0x(1⫺x)⫹c1x2(1⫺ x), withc0andc1independent of
and the migrant an a [probability E[x2](1 ⫺ xand given by
x)⫽E[x⫺x(1⫺x)](1⫺x)⫽FSTx(1⫺x)⫹
(1 ⫺ FST)x2(1 ⫺ x)]. The total probability is c 0⫽
NmFST⫹ N(1/k)(1⫺1/k)⫹(1⫺ FST)
Nm⫹N/3⫹ 1 (30)
thereforeFSTx(1⫺ x)⫹3(1⫺ FST)x2(1⫺x).
b. With probability an extinction/recolonization
c1⫽
3Nm(1⫺ FST)⫹ N(1 ⫺1/k)(1⫺2/k)
Nm⫹ N/3 ⫹1 . (31) event has occurred.
i. With probability (1⫺1/k)(1⫺2/k) the three members of the sample are descendants of
distinct founders, and the probability of two Thus the expected mean change in population-wide A’s and onea is 3x2(1⫺x). allele frequency,E[sˆ(x)x(1⫺x)]⫽k
0H/2⫹k1I/3, can
ii. With probability 3(1/k)(1⫺1/k) two of the be written as (k0e⫹k1ex)x(1⫺x), as it can in a
panmic-sampled alleles are descendants of the same tic population with dominance or linear frequency de-founder and the third is descended from an- pendence. The constantsk0eandk1eare given by
other founder. There will be twoA’s and one
k0e⫽(1⫺FST)k0⫹(c0/3)k1 awhen the first founder carries anAand the
second ana, which happens with probability
⫽(1⫺FST)k0⫹
NmFST⫹N(1/k)(1⫺1/k)⫹(1⫺FST) 3Nm⫹N ⫹3 k1 x(1⫺x).
iii. With probability 1/k2 all three members of
(32) the sample descend from the same founder
k1e⫽ (c1/3)k1 b. With probability an extinction/recolonization
event has occurred.
i. With probability (1⫺ 1/k)(1⫺ 2/k) the three ⫽ 3Nm(1⫺FST)⫹N(1⫺1/k)(1⫺2/k)
3Nm⫹N ⫹3 k1. (33) members of the sample are descendants of
dis-tinct founders. k0eandk1ecan be interpreted as the selection parameters
A. With probability 1⫺3φ⫹2the three found-that, in a panmictic population of sizeNe, give roughly
ers come from different demes, and the proba-the same behavior as do proba-the selection parametersk0and
bility of twoA’s and one ais 3x2(1⫺x).
k1 in the subdivided population. The selection
coeffi-B. With probability 3(φ⫺ ) two of the founders cient and dominance parameter in the equivalent
pcome from one deme and the third from an-mictic population,seandhe, are given byse⫽k0e⫹k1e/2
other. By an argument similar to that for case andhe⫽k0e/(2k0e⫹k1e). From Equation 4 it follows that
1.a.ii, the probability of two A’s and an a is NmFST, which appears in Equation 32, equals (1/2)[(1⫺
FSTx(1⫺x)⫹3(1⫺FST)x2(1 ⫺x).
FST)⫹N(1⫺FST)⫺N(1⫺1/k)]. Some algebra then
C. With probability the three founders come gives
from a single deme. The probability of twoA’s se⫽(1⫺FST)s (34) and ana isIof the previous generation.
ii. With probability 3(1/k)(1 ⫺ 1/k) two of the and
sampled alleles are descendants of the same
he⫽
3Nm(1⫺FST)⫹N(1⫺1/k)(1⫺2/k)
(1⫺FST)(3Nm⫹N ⫹3)
(h⫺1/2)⫹1/2. founder and the third is descended from another founder. There will be twoA’s and onea when (35)
the first founder carries anAand the second ana. A. With probability 1 ⫺ φ the founders do not Two noteworthy properties of se and he that were
come from the same deme, and the probability found to hold in the absence of extinction and
recoloni-that the first is an A and the second an a is zation (Cherry 2003a) also hold in its presence. First,
x(1⫺ x). seis independent ofhand is directly proportional tos.
B. With probability φ the founders come from As in the case with no extinction, the proportionality
the same deme. The probability of anAand constant is 1⫺FST, though the value ofFSTis altered by
anais (1⫺FST)x(1⫺x).
extinction and recolonization. Second, he is
indepen-iii. With probability 1/k2 all three members of the
dent ofs, and subdivision decreases the deviation ofhe
sample descend from the same founder and two from 1/2 by a factor that is independent ofh.
A’s and onea are impossible. If founders tend to come from the same deme,
analy-sis of the case of dominance or frequency dependence
The modified list of possibilities leads to a generalization is more complicated. There is an increase in the number
of Equation 29. Like Equation 29, this generalization of cases that must be considered when there is an
extinc-can be written as c0x(1⫺ x)⫹c1x2(1⫺x). The
con-tion/recolonization event. Furthermore, for k⬎ 2 an
stants are given by additional parameter must be specified to describe the
pattern of recolonization;φis insufficient to do so. c0⫽[NmFST⫹N(1⫺1/k)(1⫺2/k)(φ⫺ )FST⫹N(1/k)(1⫺1/k)(1⫺FSTφ) The need for an additional parameter can be seen
⫹(1⫺FST)]/[Nm⫹N/3⫹1⫺N(1⫺1/k)(1⫺2/k)] (36) as follows. For three distinct founders there are three
possibilities with regard to demes of origin: (a) The
and three founders come from three different demes; (b)
two come from one deme and the third from another; c1⫽[3Nm(1⫺FST)⫹N(1⫺1/k)(1⫺2/k) and (c) all three come from the same deme. Suppose
⫻[(1⫺3φ⫹2)⫹3(φ⫺ )(1⫺FST)]]/[Nm⫹N/3⫹1 thatφ⫽ 1/3. This value ofφcan be realized in many
different ways. At one extreme, possibility c could occur ⫺N(1⫺1/k)(1⫺2/k)]. with probability 1/3, possibility a with probability 2/3, (37) and possibility b with probability 0. At the other
ex-Thus the diffusion approximation for the subdivided treme, possibility b could occur with probability 1. Thus
population with linear frequency dependence is again
φdoes not uniquely determine the probabilities of the
identical to that for a panmictic population with linear three outcomes.
frequency dependence but different size and selection Letbe the probability that all three distinct founders
parameters. come from the same deme. Then the probabilities of
outcomes a, b, and c are 1⫺3φ⫹ 2, 3(φ⫺ ), and , respectively. Specifyingφanduniquely determines
COMPUTER SIMULATIONS
the probabilities of all possible outcomes.
To test the theoretical results obtained here, I have To account for common demes of origin, item 1.b in
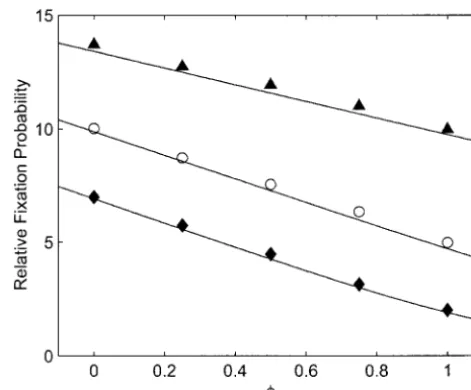
Figure 1.—Predicted and observed fixation probabilities Figure2.—Predicted and observed relative fixation proba-for various values ofkand. Fixation probabilities are given bilities when founders have some tendency to come from the relative to that of a neutral allele. In all cases theAallele was same deme. In all cases there are four founders (k⫽4),N⫽
initially present in a single copy,N⫽100,D⫽100,m⫽0.01, 100,D⫽100,m⫽0.001,s⫽10⫺3, and theAallele was initially ands⫽10⫺3. Simulation results and predictions as functions
present in a single copy. Simulation results and predictions ofare shown for three values ofk: k⫽1 (solid diamonds as functions ofφ, the probability of a common deme of origin, and curve),k⫽2 (open circles and curve), andk⫽4 (solid are shown for three values of the extinction rate: ⫽0.01
triangles and curve). (solid diamonds and curve), ⫽ 0.003 (open circles and
curve), and ⫽0.001 (solid triangles and curve).
compared the results to analytic predictions. In these
simulations the state of the population is represented question.p˜would be the expected new allele frequency if there were no selection. Incorporating the effect of byDintegers, each giving the number of copies of the
Aallele in a particular deme. Each generation new val- selection givesp⫽(1⫹ s)p˜/(1⫹ sp˜).
Figure 1 compares fixation probabilities estimated ues of these integers are chosen stochastically in
accor-dance with the model. With probabilityan extinction/ by simulation to theoretical predictions for different numbers of founders k with N ⫽ 100, D ⫽ 100, s ⫽ recolonization event occurs in a deme. The allele
fre-quency among the founders is chosen probabilistically 10⫺3, m ⫽ 0.01, and various values of . In all cases
the predictions are very close to the simulation results, according to the colonization pattern being simulated,
and the number of copies ofAis drawn from a binomial differing by no more than 2.6%. Predictions of mean times to fixation are also close to observed values (within distribution with this as its mean. With probability 1⫺
there is no extinction. In this case the new number 1.7%; results not shown).
Tendency for a common deme of origin: In these ofA’s is drawn from a binomial whose mean depends
on the within-deme frequency in the previous genera- simulations founders have some tendency to come from the same deme, characterized by the parameterφ. This tion, the pattern of selection, the overall allele
fre-quency x, and the migration rate. Theoretical predic- tendency modifies what happens after extinction. With probabilityφ, the founders come from the same deme. tions of fixation probabilities and fixation times result
from substitution of Ne,se, and he into classical results A source deme is chosen at random. The allele
fre-quency in this source is then the probability parameter for panmictic populations (Kimura1957;Kimuraand
Ohta1969). for a binomial random variable. With probability 1 ⫺
φ, the founders are chosen independently from the pop-The effect of the number of founders:These
simula-tions examine the effects of altering the number of ulation at large and the probability parameter isx. Figure 2 compares predicted and observed fixation founders. The case where there is no tendency for a
common deme of origin was simulated. In the case of probabilities over a range ofφvalues for different values ofwithk⫽4,N ⫽100,D⫽100,s⫽10⫺3, andm⫽
extinction the number ofA’s among thekfounders was
chosen from a binomial distribution with the probability 0.01. The predictions agree well with the simulation results (within 5.7%). Mean times to fixation are also parameter equal tox. In the absence of extinction, the
number ofAalleles in the next generation was chosen predicted well (within 2.2%; results not shown). Dominance or local frequency dependence: These from a binomial distribution whose probability
parame-ter p is determined as follows. Let p˜ ⫽ (1 ⫺ m)xi ⫹ simulations involve frequency-dependent selection in a
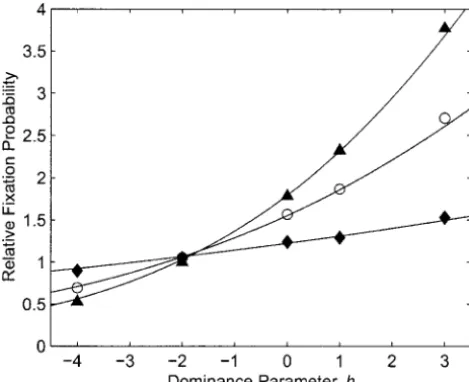
Figure3.—Predicted and observed relative fixation
proba-Figure4.—Predicted and observed mean times to fixation bilities in the presence of local frequency dependence or
in the presence of local frequency dependence or dominance. dominance. In all cases N⫽ 100, D ⫽ 100, m⫽ 0.01,s ⫽
The plotted points represent the same simulation runs pre-10⫺4, and the Aallele was initially present in a single copy.
sented in Figure 3. Simulation results and predictions as functions of the
domi-nance parameterhare shown for three values of the extinction rate: ⫽0.01 (solid diamonds and curve), ⫽0.003 (open
circles and curve), and ⫽0.001 (solid triangles and curve). extended to cover dominance for fitness or frequency
dependence.
In all of the cases analyzed, the diffusion approxima-terms of dominance in a diploid population, and I use tion for the subdivided population was identical to that the parameterization involvings andh to describe the for a panmictic population with a different size and pattern of selection. In all of these simulations the num- different selection parameters. This fact allowed the ber of founders was one. Selection differed from that definition of effective values of population-genetic pa-described above only in that the selection coefficients rameters: the effective population sizeN
e, the effective
was replaced by the marginal selection coeffiecientsˆ, selection coefficients
e, and, in the case of dominance,
so thatp⫽(1⫹ sˆ(p˜))p˜/(1⫹sˆ(p˜)p˜). the effective dominance parameterh
e. These effective
Figure 3 shows predicted and observed relative fixa- parameters are equal to the actual parameters that char-tion probabilities for a range of values of the dominance acterize a hypothetical equivalent panmictic popula-parameterhfor three different values of withk⫽1, tion. Substitution of effective for actual parameters in N⫽100,D⫽100,s⫽10⫺4, andm⫽0.01. The
classical results for panmictic populations allows predic-tions agree well with the observed values: With one tion of such quantities as fixation probabilities and ex-exception, all of the predictions are within 3.5% of the pected times to fixation.
simulation results (the prediction for ⫽ 0.001 and Computer simulations confirm that the theoretical h ⫽ ⫺4 differs from the simulation result by 6.4%). results give a good description of the trajectory of allele This figure illustrates that the dependence of fixation frequency under the conditions modeled. Probabilities probability on both h and is captured well by the of fixation are predicted to within a few percent, as are analytic results. Figure 4 shows that mean times to fixa- mean times to fixation. Figure 1 demonstrates that the tion are also predicted well by the theory (within 2.2%). theory captures the effect of multiple founders. Figure
2 shows that a tendency for founders to come from the same deme is properly accounted for. Figures 3 and 4
DISCUSSION
illustrate that predictions are good for cases of domi-nance or frequency-dependent selection.
The results presented here describe the fates of alleles
under selection in a subdivided population with local The effect of extinction and recolonization varies with the (effective) number of founders and their tendency extinction and subsequent recolonization by an
arbi-trary number of founding alleles. In the simplest case for a common deme of origin.FSTcan be either raised
or lowered by extinction and recolonization. This is treated, selection is genic and frequency independent
and founding alleles have no tendency to come from evident from Equation 21. It can also be seen from consideration of two extreme cases. If recolonization the same subpopulation. These results were extended
Cherry, J. L., 2003b Selection in a subdivided population with local
corresponds to maximum local differentiation from the
extinction and recolonization. Genetics164:789–795.
population average. This leads to higherFST. If, on the Cherry, J. L., andJ. Wakeley, 2003 A diffusion approximation for selection and drift in a subdivided population. Genetics163:
other hand, there is a very large number of founders,
421–428.
which have no tendency to come from the same deme,
Dobzhansky, T., andS. Wright, 1941 Genetics of natural
popula-then an extinction/recolonization event moves the local tions. V. Relations between mutation rate and accumulation of allele frequency to approximately the population mean. lethals in populations of Drosophila pseudoobscura.Genetics26:
23–51.
This destroys local differentiation and lowersFST.
Kimura, M., 1957 Some problems of stochastic processes in genetics.
The productNese, which determines fixation probabil- Ann. Math. Stat.28:882–901.
ity, is also affected by extinction and recolonization. Kimura, M., andT. Ohta, 1969 The average number of generations until fixation of a mutant gene in a finite population. Genetics
Despite the fact thatFSTcan be either raised or lowered
61:763–771.
by extinction and recolonization, the direction of the Lande, R., 1985 The fixation of chromosomal rearrangements in a effect onNesedoes not depend on the pattern of recolo- subdivided population with local extinction and colonization.
Heredity54(3): 323–332.
nization: |Nese| is always lowered by extinction and
recol-Maruyama, T., 1970 On the fixation probability of mutant genes
onization, as is clear from Equation 20. The change in in a subdivided population. Genet. Res.15:221–225.
FST, whatever its direction, has the same effect on the Maruyama, T., 1974 A simple proof that certain quantities are inde-pendent of the geographical structure of population. Theor.
mean change in allele frequency due to selection and
Popul. Biol.5:148–154.
the component of the variance due to ordinary genetic
Maruyama, T., andM. Kimura, 1980 Genetic variability and
effec-drift. Extinction/recolonization events are always a tive population size when local extinction and recolonization of subpopulations are frequent. Proc. Natl. Acad. Sci. USA77:
source of additional variance, but no additional
direc-6710–6714.
tional change. Thus the magnitude of the ratio of the
Roze, D., andF. Rousset, 2003 Selection and drift in subdivided
mean to the variance, which is given by |Nese|, is de- populations: a straightforward method for deriving diffusion ap-proximations and applications involving dominance, selfing and
creased by extinction and recolonization, and in its
pres-local extinctions. Genetics165:2153–2166.
ence selection is made effectively weaker relative to
sto-Slatkin, M., 1977 Gene flow and genetic drift in a species subject
chastic change. to frequent local extinctions. Theor. Popul. Biol.12:253–262. These results extend the situations in which a subdi- Slatkin, M., 1981 Fixation probabilities and fixation times in a
subdivided population. Evolution35:477–488.
vided population with selection can be related to a
Spirito, F., M. RizzoniandC. Rossi, 1993 The establishment of
roughly equivalent panmictic population. This equiva- underdominant chromosomal rearrangements in multi-deme sys-lence allows the application of a wealth of established tems with local extinction and colonization. Theor. Popul. Biol.
44:80–94.
results for panmictic populations (e.g., Kimura 1957;
Whitlock, M. C., 2002 Selection, load and inbreeding depression KimuraandOhta1969) to the subdivided populations. in a large metapopulation. Genetics160:1191–1202.
Whitlock, M. C., 2003 Fixation probability and time in subdivided populations. Genetics164:767–779.
Whitlock, M. C., andN. H. Barton, 1997 The effective size of a LITERATURE CITED
subdivided population. Genetics146:427–441.
Barton, N. H., 1993 The probability of fixation of a favoured allele Wright, S., 1940 Breeding structure of populations in relation to in a subdivided population. Genet. Res.62:149–157. speciation. Am. Nat.74:232–248.
Cherry, J. L., 2003a Selection in a subdivided population with