http://wrap.warwick.ac.uk/
Original citation:Young, Mark S. and Birrell, Stewart A.. (2012) Ecological IVIS design : using EID to develop a novel in-vehicle information system. Theoretical Issues in Ergonomics Science, Vol.13 (No.2). pp. 225-239.
Permanent WRAP url:
http://wrap.warwick.ac.uk/53201
Copyright and reuse:
The Warwick Research Archive Portal (WRAP) makes this work of researchers of the University of Warwick available open access under the following conditions. Copyright © and all moral rights to the version of the paper presented here belong to the individual author(s) and/or other copyright owners. To the extent reasonable and practicable the material made available in WRAP has been checked for eligibility before being made available.
Copies of full items can be used for personal research or study, educational, or not-for-profit purposes without prior permission or charge. Provided that the authors, title and full bibliographic details are credited, a hyperlink and/or URL is given for the original metadata page and the content is not changed in any way.
Publisher statement:
"This is an Accepted Manuscript of an article published by Taylor & Francis in Theoretical Issues in Ergonomics Science 30/09/2012., available online:
http://wwww.tandfonline.com/10.1080/1463922X.2010.505270 A note on versions:
The version presented here may differ from the published version or, version of record, if you wish to cite this item you are advised to consult the publisher’s version. Please see the ‘permanent WRAP url’ above for details on accessing the published version and note that access may require a subscription.
1
Ecological IVIS Design: Using EID to develop a novel in-vehicle
information system
New in-vehicle information systems (IVIS) are emerging which purport to encourage more environmentally friendly, or ‘green’ driving. Meanwhile, wider concerns about road safety and in-car distractions remain. The ‘Foot-LITE’ project is an effort to balance these issues, aimed at achieving safer and greener driving through real-time driving information, presented via an in-vehicle interface which facilitates the desired behaviours while avoiding negative consequences. One way of achieving this is to use ecological interface design (EID) techniques. This paper presents part of the formative human-centred design process for developing the in-car display through a series of rapid prototyping studies comparing EID against conventional interface design principles. We focus primarily on the visual display, although some development of an ecological auditory display is also presented. The results of feedback from potential users as well as subject matter experts are discussed with respect to implications for future interface design in this field.
Statement of relevance: The design development process for an in-vehicle EID is presented, which more often than not is seen as a ‘missing link’ in ergonomics as very few papers describe the link between analysis and design. Lessons can be learned for the general theoretical EID process, as well as for the specific application of IVIS displays.
Keywords: cognitive work analysis; eco-driving; ecological interface design; in-vehicle information systems, road safety
Introduction
Over the past decade the environmental cost of road transport has become a key issue
for government, car manufacturers and consumers (Young et al., 2008), accounting
for 19% of the European Union’s greenhouse gas emissions (EEA, 2007). One way
in which driving can become more environmentally friendly (or ‘greener’) is by
adopting ‘eco-driving’ behaviours, since CO2 emissions and fuel use are directly
linked. European studies suggest that eco-driving can reduce fuel consumption and
emissions by between 5 and 15% (af Wahlberg, 2002; 2007; Waters and Laker, 1980;
van der Voort et al., 2001). A number of vehicle manufacturers are capitalising on
this trend by offering in-vehicle information systems (IVIS) which provide
2 However, road safety remains a key policy issue alongside the environmental
concerns (e.g., PACTS, 2007), and the introduction of additional IVIS feedback could
have a negative impact on driver distraction (cf. Donmez et al., 2007; Regan et al.,
2009), with research completed for the ‘100-car naturalistic study’ in the US
suggesting that driver inattention accounts for almost 80% of crashes and 65% of near
crashes (Klauer et al., 2006). ‘Foot-LITE’ is a UK project, aiming to develop a
system which encourages both safer and more environmentally friendly driving, and
thus meeting both of these policy objectives. The system ostensibly comprises two
features: an in-vehicle interface providing real-time feedback on vehicle control,
coupled with a complementary pre- and post-drive web-based application which
would download and interpret journey data to support longer term behavioural
changes and inform transport choices. The work presented here is part of a package
focused on the ergonomics of the system, with particular emphasis on the in-vehicle
human machine interface (HMI), which will present information to the user while
they are driving. A key objective of the system, as with any in-car HMI, is to
encourage desired behaviours (in this case, safer and greener driving) while avoiding
any negative effects of overload or distraction (cf. Harbluk et al., 2007). One way of
achieving this would be to apply principles of ecological interface design (EID; Burns
and Hajdukiewicz, 2004; Vicente, 2002).
EID is an approach to interface design that was introduced specifically for
complex socio-technical, real-time, and dynamic systems. Based on a paradigm of
ecological psychology (cf. Gibson, 1979), it exploits the precept that we directly
perceive invariants in the world, rather than indirectly through mental representations
– meaning that, for interface design, we must study what is actually in the world
3 environments, including process control, nuclear, petrochemical, military and aviation
domains (Burns and Hajdukiewicz, 2004; Jamieson & Vicente, 2001). By presenting
environmental constraints in a graphical format for direct perception, performance is
improved and workload is reduced over conventional displays which require the user
to integrate information in their heads (Davidsson et al., 2009; Hajdukiewicz and
Vicente, 2004; Hoff, 2004; Sanderson et al., 2003). Vicente and Rasmussen (1992, p.
589) suggest that an ‘EID interface should not contribute to the difficulty of the task,
and at the same time, it should support the entire range of activities that operators will
be faced with.’ Thus it has been argued that interfaces designed following the EID
framework will reduce mental workload when dealing with unfamiliar or
unanticipated events (Vicente, 1999b). EID therefore offers potential for meeting the
IVIS requirement of improving performance at no cost to workload. Within the
scientific literature a handful of studies have used EID for vehicle design, for instance
a lateral collision warning system (Jenkins et al., 2007), lane change manoeuvres (Lee
et al., 2006; Stoner et al., 2003), intelligent transport systems (Salmon et al., 2007)
and adaptive cruise control (Seppelt and Lee, 2007).
Whilst the ergonomics literature presents several papers detailing the basis for
EID (namely cognitive work analysis – CWA; Vicente, 1999a; Birrell et al., 2008),
and an increasing number proffering their actual EID displays, there remains
something of a gulf between the development and the execution of EID as part of the
wider human-centred design process (though for exceptions see Jamieson, 2003, and
Sanderson et al., 2003). Moreover, it is imperative that this process includes a
justification for the EID approach over conventional interface designs, particularly
within a safety-critical context such as driving. In the rest of this paper, we explain
4 aimed at developing an EID concept for Foot-LITE, and testing this against an
alternative concept based on conventional interface design principles. We focus here
mostly on the development of the in-car visual interface, although later in the paper
we do also discuss similar efforts for the auditory interface.
EID visual display – design development
In keeping with the design process for ecological interface design (summarised by
Sanderson et al., 2003), our starting point was to focus on the information
requirements of the driver using cognitive work analysis – specifically, the abstraction
hierarchy (AH; Rasmussen, 1985). The AH can be used to establish what type of
information should be displayed, as well as where, when and how it should be
presented, and finally how to integrate pieces of information which need to be
associated (Lintern et al. 2004). An AH completed previously for the Foot-LITE
project (Birrell et al., 2008) suggested several aspects of safe and eco-driving that
should be represented on the display, such as headway, lane deviation and cornering
speed for safety, complemented by engine speeds and acceleration forces for
eco-driving. As implied above, EID offers to dynamically reflect the driving environment
and integrate this complex information onto a single, direct perception display.
Another key concept upon which EID is based, is the skills-rule-knowledge
taxonomy (Rasmussen, 1983) – components of which are largely identifiable from the
AH. It has been suggested that safe and green driving depends on support at all three
of these levels (Davidsson et al., 2009), but most in-vehicle information system
displays only provide (and, arguably, should only provide) skill- and rule-based driver
information. Sanderson et al. (2003) noted that the interface should support cognitive
5 al. (1998) implied that whilst an EID can foster knowledge-based processing, this is
only if users engage with the interface and reflect on its feedback. Given the concerns
for driver distraction and overload (Regan et al., 2009), we suggest that the
appropriate levels for in-vehicle feedback should be restricted to skill- and rule-based
information, since knowledge-based processing is effortful and attention-demanding
(Rasmussen, 1983). Mapping these levels onto models of vehicle control (e.g.,
Ranney, 1994), the IVIS display should show tactical and operational elements of
driving. The flexibility of the Foot-LITE concept allows for strategic information
(knowledge-based processing) to be presented off-board via the web-based
application. Thus, it was decided that only low-level manoeuvring and vehicle
control elements (consistent with the output of the AH) are to be presented on the
in-vehicle interface.
Sanderson et al. (2003) describe that, as a skill-based information design
principle, the interface should directly guide users’ actions – as well as their
understanding of how such actions move them towards their goal (Davidsson et al.,
2009). Highly skilled drivers, with expertise in safe and green driving styles, are
presumed here to pick up on direct cues in the environment (such as engine note,
kinaesthetic feedback or advance visual information) to modify their behaviour. At
the skill-based level, this will occur largely unconsciously, but most average drivers
are likely to process only a small proportion of this richness of information in the real
world (cf. Hoff, 2004). Thus the Foot-LITE EID attempts to make explicit the cues
used by skilled drivers, by providing real-time, continuous feedback on these
skill-based elements of vehicle control. Although there is an argument for retaining some
processing in the head for longer-term retention of skills (i.e., holding back some
6 situations which require a fast response (Patrick and Morgan, 2010) – such as driving.
Meanwhile, at the rule-based level, there should be consistent one-to-one mapping
between the environmental constraints and the perceptual information in the interface
(Sanderson et al., 2003). In our interpretation, such information is presented by
discrete, ‘pop-up’ messages in tandem with the continuous, skill-based display. For
instance, gear change information is implicit in the engine speed bar on the
eco-driving ring, and is reinforced by more tactically-oriented messages such as ‘change
up sooner’ – and both positive reinforcement as well as corrective messages are given.
Positive encouragement was a significant outcome from the CWA analysis completed
at the beginning of the project (Birrell et al., 2008), and is considered to be an
important learning tool in facilitating desired behaviours.
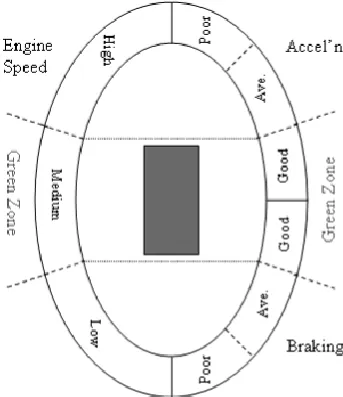
Figure 1 shows a prototype of the EID interface developed for the current
study. The principal aspects of the interface are based on Gibson and Crooks (1938)
ecological notion of the ‘field of safe travel’, which was noted as ‘…a spatial field but
it is not fixed in physical space. The car is moving and the field moves with the car
through space.’ (p. 456). On the EID display, the inner oval directly illustrates the
driver’s field of safe travel in the real-world, as the representation of the car moves
within the shape and warnings are given if headway decreases or for lane departures.
Thus the boundaries of the oval represent the limits of the field of safe travel. The
outer ring presents the parameters associated with eco-driving performance, such as
engine speed and acceleration; these are essentially bars moving up or down with
acceleration / engine speed, with the optimum level in the middle of the bar. All of
these parameters were identified from the AH, and reflect the continuous, skill-based
7 goal is to maintain the car within a ‘Green Zone’ of performance, to optimise each set
of parameters.
Insert Figure 1 about here
As an integrated graphical interface, this concept meets the requirements for
an ecological display by being high in temporality and spatiality properties (Hoff,
2004). Furthermore, the skill-based components are ‘semantically mapped’
(Sanderson et al., 2003) – the relations between, and constraints on behaviour and
performance are directly represented on the display. “Good semantic mapping means
that system states (normal and abnormal), relations and constraints can be easily
perceived” (Sanderson et al., 2003; p. 152). The grouping of both safety and
eco-driving elements around a ‘green zone’ of optimal performance clearly identifies the
constraints on desired performance, and suggests to drivers which actions ought to be
taken to maintain such.
As an alternative to the EID concept, a more conventional dashboard-type
interface (DB) has also been developed according to best practice interface design
guidelines in the human factors literature (such as the European Statement of
Principles on Human Machine Interface for in-vehicle information and
communication systems; EC, 2008). Based on a vehicle instrument panel layout, the
DB interface consists of bar charts, warning icons (derived from ISO 2575: 2004),
pop-ups and textual information (see figure 2). The basic principles of the design are
that driving information is grouped (as with the EID), with the eco-driving parameters
all being presented in the left hand circle, while safety-related information is shown in
the circle on the right. The main centre circle has a smart driving meter situated at its
8 presented underneath. The DB design is intended to offer familiarity to drivers, being
akin to standard instrument panels available in most vehicles. We do not go into
detail here on the development of the DB interface, since the focus of the present
paper is on EID. Rather, the DB is merely presented as a foil to the EID for the
subsequent rapid prototyping study, in a similar manner to the landmark study by
Christoffersen et al. (1998). Suffice to say here that it was purposefully designed to
impart exactly the same information as the EID, since ultimately the interfaces
developed here will be tested more thoroughly using simulated driving data. The data
feeding the displays will be equivalent across each interface option, and thus it is
merely the representation of the data that differs. Whilst it could be argued that the
representation itself imparts information to the user (especially in the configural
relationships between variables on the EID), in our view this is what may set the
interfaces apart – and, indeed, what we are testing.
Insert Figure 2 about here
Rapid prototyping study
In keeping with a human-centred design process to the project, both the ecological
interface design and dashboard concepts were presented to potential users for their
evaluation and consideration. In order to make an early human factors assessment of
the two designs, static rapid prototypes of each were produced using standard desktop
software.
Two iterative studies were conducted as part of this rapid prototyping phase,
both aimed at specifying information requirements for the interface as well as
9 questionnaire to determine users’ views on specific elements of the presentation as
well as choice of the ‘pop-up’ icons for rule-based information. This was followed by
Study 2, a desktop presentation study of a variety of driving scenarios on each
interface for user evaluation.
Study 1: User requirements questionnaire
A user requirements questionnaire was designed to elicit and refine the information
requirements to be represented on both the ecological interface design and dashboard
interfaces. The questionnaire was completed by 15 ‘user’ participants (nine female,
mean age 40.1 years), all of whom were regular, experienced drivers, as well as 11
subject matter experts (SMEs; primarily males aged 25-59) from the Foot-LITE
project consortium. The questionnaire was split into two sections. The first focused
on determining the type and format of information that should be presented on the
Foot-LITE in-vehicle interface. For instance, one design decision which called for
clarification was the orientation of the ‘acceleration’ bar of the EID outer ring –
should positive accelerations be towards the top of the graph, mapping on forward
movement and engine speed, or should braking be towards the top, reflecting the
momentum or g-forces involved in the motion? Without exception, the users and the
SMEs opted for a consistent mapping of movement and engine speed (i.e.,
acceleration ‘increases’ the bar and it moves up). It is perhaps unsurprising, given the
novelty of the EID interface for users, that most of their feedback pertained to this
rather than the DB display.
Similar differences in opinion emerged when considering the priorities of
information content on the display. For example, the SMEs rated having a gearshift
10 users ranked this 13th out of 20. However, in terms of format of presentation, both the
users and the SMEs agreed that information should be presented in an instantaneous
format (i.e., actual moment-to-moment data). A simple generic representation of
headway information (i.e., safe, dangerous etc.) was also favoured by both the user
and SME groups.
The second section of the questionnaire asked participants to rank, in order of
preference, a selection of icons which represented different aspects of green and safe
driving which would be used for the DB interface as well as the pop-ups. These icons
were derived from reviewing other standardised icons which are already present in
current vehicles (i.e. adaptive cruise control, gear shift indicators etc.), following
International Standards Organisation guidelines for in-vehicle icons (e.g., ISO
15008:2003; ISO 11429: 1996), and other icons generated specifically for the present
research. The parameters to be presented on the interface (i.e., headway, acceleration
forces etc.) were all listed along with four different icon options for each. The
preferred icons for each driving parameter were aggregated across respondents to
determine which icons would be used in study 2.
As well as rating their preferences, the respondents gave some useful feedback
about icon design. Key points from these comments related to advice on cornering
speeds and representation of gearshift information. Icons for cornering speed
received a mixed response. With further probing it transpired that participants did not
want to receive such information while actually driving the corner (as was intended),
as this could be distracting. Meanwhile, responses from SMEs and users differed for
the gearshift indicators. A simple numerical gear icon was preferred by users over a
11 gate, but since they also rated the simpler icon a close second, the latter option was
chosen to take forward.
Taken together, the results of the questionnaire enabled us to refine the
prototype displays in accordance with user and SME feedback. In essence, the nature
of the information presented has not changed, since this is determined by the
aforementioned abstraction hierarchy output and skill-rule-knowledge requirements.
The components of safe and eco-driving are still represented, and skill-based vehicle
control feedback is provided via the continuous display, while rule-based tactical
information is given as pop-up messages. Nevertheless, the exact format of
presentation has been adjusted according to user preferences – most notably in the
acceleration bar of the eco-driving display on the EID, as well as in the specific
choice of pop-up icons for both interfaces. The second stage of rapid prototyping
takes the full visual display forward for user evaluation against the DB option.
Study 2: Desktop evaluation
The principal aim of the desktop study was to evaluate users’ subjective responses to
the two candidate designs for the human-machine interface. A series of five driving
scenarios was conceived covering various aspects of safe and/or eco-driving, with
static exemplars for each version of the HMI constructed to represent these scenarios.
Both positive (i.e., desirable) and negative (undesirable) situations were represented.
It is important to note again that the scenarios and the associated HMI representations
were carefully designed such that the information presented across each interface
(EID and DB) remained the same – it is merely the format of presentation which was
12 which may occur during normal driving, with each interface presenting comparable
information.
A new sample of ten ‘user’ participants (six female; mean age 43.8 years),
separate from the questionnaire study, were shown the scenarios for both HMI options
in a counterbalanced repeated-measures design. No experts were used for this stage
of the evaluation. A minimum of ten participants was needed for the study in
accordance with SAE Recommended Practice J2364, which suggests that for early
development phases when using a mock-up or computer simulation, static task time
averaged over ten participants should be less than 15 seconds (Green, 1999).
Participants were given a brief introduction to the Foot-LITE project and the aims of
the study, and were informed of the basic principles of each interface design (EID and
DB). The static interface scenarios were then individually presented on a laptop PC;
following this participants offered a brief discussion on their understanding of the
scenario and any behavioural changes they would make to their driving as a result.
Dependent variables covered performance measures of response times and accuracy
in interpreting the scenarios. Qualitative analyses of participants’ descriptions of the
displayed scenarios were used to infer the accuracy of their understanding. In
addition, participants were asked to complete the System Usability Scale (SUS;
Brooke, 1996) as a quantitative reflection of their subjective opinions on usability for
each HMI design.
Results and discussion
Absolute response time, irrespective of whether the response was correct, was on
average 0.4s faster for the EID than the DB interface (8.0s vs. 8.4s respectively),
13 (Z = -0.56; p = 0.58). It is notable that in each case, the response times recorded here
are well within the 15 second rule for static task completion as suggested by Green
(1999) and as part of SAE Recommended Practice J2365, thus implying safe use of
either of these in-vehicle HMIs while driving. It is worth emphasising that
participants were viewing the interface options for the first time during the tests, with
only a very brief introduction explaining the displays. Nevertheless, both interfaces
showed some degree of a learning effect, in that response times reduced for the
scenarios presented later in the evaluation. Further observations on the data for
specific scenarios suggested in particular that participants responded well to the
positive encouragement given by the EID, as response times and standard deviations
were low.
Accuracy of participants’ responses to the scenarios was coarsely classified
into ‘fully correct’, ‘partially correct’ (i.e., some elements of safe and/or eco-driving
were not correctly identified), or ‘incorrect’. Approximately one-third more
participants correctly identified the scenario with the EID interface compared to the
DB display. At the same time, more participants incorrectly identified the scenario
with EID. Thus more participants only partially identified the scenario with the DB
compared to EID. With more fully correct responses on the EID, the results suggest
that this interface allows both the safety and fuel economy aspects of the design to be
more clearly identified. However, it is a notable concern that five participants could
not identify correctly any aspect of the interface, with all of these incidents occurring
on the very first slide presented to the participants. Furthermore, when reviewing the
transcripts, a common finding emerged that users were either slow to grasp or
misunderstood the EID interface particularly with respect to headway. The
14 and suggests the need for a detailed explanation or ‘tour’ of the interface before use in
an actual driving situation evaluation. However, it was also clear from their
subjective responses that participants made a direct link between acceleration and fuel
consumption with the EID, suggesting that it can support effective action and users’
understanding of how these actions move them toward their goals (cf. Davidsson et
al., 2009).
Subjective usability ratings, assessed via SUS, revealed that the DB design
was rated higher than the EID (74.1 vs. 67.8 respectively), but a Wilcoxon test also
revealed that this difference was not significant (Z = -0.65; p = 0.61). As well as
assessing the overall mean ratings, responses to the individual questions on the SUS
questionnaire were also analysed. Results suggest that participants rated EID as being
more complex but more consistent compared to the DB design. We believe that both
these factors are effects of the integrated nature of the EID presentation, which aims
to combine information onto a single, direct perception display. It is again worth
noting that participants were relatively naive to both interfaces in this study, and the
EID in particular is an unfamiliar style of presentation for drivers. Our findings echo
those of others (e.g., Jamieson et al., 2003) who have found initial resistance to EID
displays when compared to traditional interfaces. Anecdotal reports from the study
suggest that although the EID takes some getting used to, it can surpass the DB once
the initial learning curve is complete. Participants noted that a potential limitation
with the DB interface was its requirement to look in two separate places, hold this
information in memory and then integrate the information in order to interpret it. As
befits the ecological approach, the EID integrates all the information on the display,
15 favourably to the positive reinforcement elements of the EID, and this was reflected in
their objective performance data for both speed and accuracy.
EID auditory display – development and testing
Up to now, we have been discussing purely the visual component of the interface
designs. However, similar work has been undertaken to develop an auditory display
for the interfaces as well. Wickens (1984) suggests that because driving is a visually
demanding task, the auditory modality is ideal for delivering effective warnings. The
presentation of redundant information via the auditory field is therefore an effort to
reduce driver visual workload and manage mental demand during higher (visual)
workload situations (cf. Edworthy and Stanton, 1995).
For this project, audio options were developed for each real-time (i.e.,
skill-based) driving parameter. The rationale for addressing only the skill-based
information is based on the assumption that the auditory modality is limited in terms
of the amount and complexity of data it can transmit; thus the low-level vehicle
control elements lend themselves to auditory feedback. Furthermore, auditory
warnings are considered where the speed of response is a key variable (Edworthy and
Stanton, 1995), as is the case with the skill-based, vehicle control information. Such
information which Foot-LITE delivers to the driver includes gear change, acceleration
and braking information (related to eco-driving), and headway and lane deviation
information (related to safety). For each of these driving parameters three audio
options were created: auditory icons, earcons and speech icons.
Auditory icons have been defined as naturally occurring sounds that can
convey information about system events by analogy with everyday events (Gaver,
16 metaphor on desktop PCs, which gives a sound like the scrunching of paper when it is
emptied. In the driving domain these may include sounds such as sirens, horns,
engine noise or rumble strips. These are not abstract sounds (as with warning tones
and earcons), but are designed to convey ecological information which should be
familiar to the driver for a specific event. Gaver (1986) suggests that the more a
representation’s form depends on its meaning, the easier it should be to learn. From
the perspective of the present paper, then, auditory icons are the closest to an
ecological interface. The auditory icons created for the Foot-LITE interface included
a sound of rumble strips for lane deviation, a sonar Doppler for headway (similar to
that used for parking sensors), an over-revving engine for gear change, and the
skidding of tyres for excessive braking.
Earcons, on the other hand, are abstract, synthetic tones that can be used in
structured combinations to designate a particular meaning (e.g., Brewster et al., 1993).
However, the link between earcons and their meanings does not exist naturally and
must be learned (Graham, 1999). An example of an earcon, again from desktop PCs,
is the alert that plays when you receive an email. This sound has no direct
representation to receiving mail (an auditory icon of this might be a letterbox
flapping), but in regular computer users has a strong learned relation to check their
email. Earcons are the most common type of auditory warning used by vehicle
manufacturers, and to a large extent we have followed their lead with the design of
those used for the present study. For instance, a range of beeps were used to signify
compromised headway and lane deviation, with increasing frequency to denote
urgency for these safety-critical messages (cf. Hellier et al., 1993). Earcons for
17 for change down), and a set of three high or low pitched chimes for excessive
acceleration or braking respectively.
Finally, speech icons in our case comprised a synthetic voice verbalising a
maximum of two units of information (or three words) relating to the specific driving
parameter presented. Due to their nature, speech (or verbal) messages do not need to
be learned and no inference is required; however, speech signals (even when only one
or two words in length) take a relatively long time to present (Patterson, 1982) and
require a significant period to interpret (Graham, 1999). It also follows that speech
messages can only be fully interpreted when the message verbalisation is nearly
complete. The speech icons selected for this study included statements such as ‘too
close’ (for headway), ‘out of lane’ (for lane deviation), ‘change up’ or ‘change down’
(for gear change), and ‘heavy braking’ and ‘excessive acceleration’.
As with the visual display options, a desktop rapid prototyping study was
conducted to evaluate the different audio options, which will ultimately be used to
complement the real-time visual display. A series of static slides from the visual
scenarios discussed earlier was shown to a further 20 different ‘user’ participants (12
female; mean age 40.11 years) via a PC presentation. Each slide included three
hyperlinked boxes, one for each auditory interface type relating to that scenario (e.g.,
if the scenario was lane deviation, then there would be a clickable box to play a
rumble strip, an earcon beep, and the ‘out of lane’ speech warning). Participants were
allowed to click on these boxes as they pleased, in order to rate the sounds from most
to least appropriate, using a methodology adapted from that proposed by Edworthy
and Stanton (1995). Efforts were made to control for the loudness and duration of the
sounds, in accordance with guidance from Edworthy and Stanton (1995). However,
18 controlled for as this may have compromised the differences between the different
audio options. Furthermore, since this was a rapid prototyping study, the audio
options presented were not finalised or refined sound files, and participants were
instructed to simply rate the appropriateness of the warnings rather than their quality.
Results and Discussion
Participants’ responses were coded such that the audio rated as the most appropriate
was given a numerical value of 3, with the least appropriate given 1 – thus the higher
the mean rating the better perceived the audio. Descriptive statistics are presented in
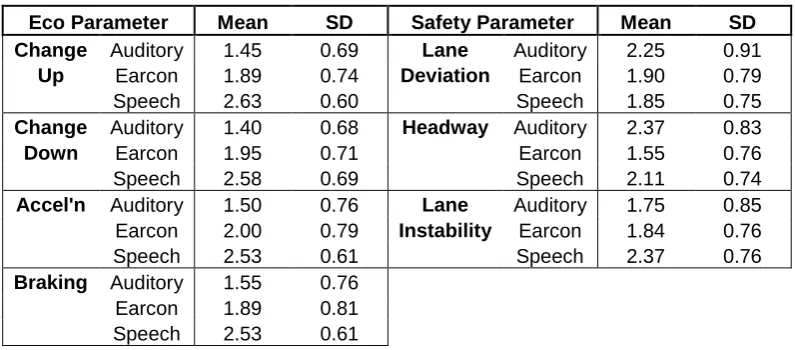
Table 1; no inferential analyses were conducted on this limited dataset. However, we
can observe some trends from the data. In general, speech was preferred for
conveying eco-driving information, with auditory icons rated the least appropriate.
However, for safety parameters, auditory icons were generally rated most appropriate,
with earcons the least.
Insert Table 1 about here
Previous research suggests a general tendency towards speech icons over
earcons and auditory icons amongst users (e.g., Jones and Furner, 1989; Lucas, 1995),
reflecting the trend for eco-driving information in the current study. However, Jones
and Furner (1989) make the point that the selection of audio representations should
not be based on preference alone. Participants who had received an explanation of the
auditory icons showed improved accuracy and response time, indicating a strong
19 A key benefit of auditory over speech icons is that the information conveyed
can be processed more effectively, especially at times of high workload (Bliss and
Kilpatrick, 2000). Graham (1999) assessed the use of auditory icons against more
conventional warnings for a vehicle collision avoidance system, and found that the
auditory icon warning produced significantly faster braking reaction times, thus
favouring the use of auditory icons for this safety-critical application. Furthermore,
the fact that speech messages can only really be fully understood when the message is
nearly complete, may slow down reaction times in emergency situations (Graham,
1999). However, it must be acknowledged that speech icons are generally preferred
by users and show greater response accuracy to non-speech icons (e.g. auditory icons
or earcons).
Our conclusions from this study suggest that the audio options to be taken
forward to the next phase of more rigorous testing should include one verbal and one
non-verbal icon for each of the safety and eco-driving parameters. Given that
auditory icons were preferred for safety, and in conjunction with the theoretical
advantages put forward in the literature, these will constitute the non-verbal icons for
safety-related parameters. The opposite preference for eco-driving parameters means
that earcons will be chosen as the non-verbal icon in this area – although it would
appear likely that speech icons will continue to attract users’ preferences.
Nevertheless, as Jones and Furner (1989) pointed out, we cannot design on users’
preferences alone, and the next stage of testing will be directed at evaluating the
effects of these displays on drivers’ performance in a simulator.
20 A visual human-machine interface for a new in-vehicle information system has been
developed according to ecological interface design principles. We have attempted to
describe our course through the interim phase of the human-centred design process,
from analysis through design development to early human factors assessment, which
more often than not otherwise remains hidden in the literature. Results from the user
requirements questionnaire suggested what format participants wanted the relevant
information to be presented in. These responses were used to develop the two
candidate HMI designs taken forward into the desktop evaluation study. Although the
visual EID offers a range of potential benefits in theory, there was little to choose
between the EID and traditional dashboard option based on the preliminary
assessment from users. Nevertheless, with extended use the advantages (or
otherwise) of EID may become more apparent (e.g., Christoffersen et al., 1998).
Participants also made clearer links between their driving style and changes to fuel
economy with the EID interface, ratifying the integrated and direct perception nature
of this design. The subjective responses given by the participants form a good basis
for potential iteration of both interfaces.
Similarly, a selection of audio options were developed for the interface, based
on auditory icons, earcons, or speech icons, and these were subjected to user
evaluation in a separate desktop study. Users preferred auditory icons for safe driving
feedback, and speech icons for eco-driving advice. It is our feeling that auditory
icons, which best align with principles of EID, would be most suited to the ecological
visual display, especially for safety-related driving parameters. Meanwhile, earcons
or speech icons might be better for presenting eco-driving information.
As a rapid prototyping evaluation of proposed interface designs for the
21 stage between background analysis and more detailed interface evaluation, and as
such makes no claims about the robustness of its scientific method. The sample sizes
are small, and the inferential statistics are consequently limited in their analysis.
What we have done is perform a preliminary evaluation of a series of visual and
auditory interface options, refining and narrowing these down for further development
and testing. However, these conclusions have been largely based on users’
preferences and some rudimentary performance evaluations with static visual
concepts. Further work is necessary to validate the designs, using dynamic versions
in actual driving scenarios, against the original criteria of improving driver
performance while avoiding distraction. Final decisions on the designs will be based
on driver performance and workload, in addition to subjective responses. The next
stage of the research is therefore to develop dynamic versions of the displays, and
take them forward for more rigorous performance testing in the Brunel University
Driving Simulator (preliminary results of which are available in Birrell and Young,
2009). In the meantime, we hope that the current paper sheds some light on the
design development process for other applications of ecological interface design.
Acknowledgements
Foot-LITE is sponsored by the TSB, DfT and EPSRC under the Future Intelligent Transport Systems initiative. The Foot-LITE consortium is comprised of: MIRA, TRW Conekt, Auto-txt, HW
Communications, Ricardo, Zettlex, Hampshire County Council, Institute of Advanced Motorists, Transport for London, Southampton University, Newcastle University and Brunel University. The authors are grateful to the two anonymous reviewers who provided useful feedback in improving our original manuscript.
References
af Wahlberg, A., 2002. Fuel efficient driver training - state of the art and
22 af Wahlberg, A., 2007. Long-term effects of training in economical driving: Fuel
consumption, accidents, driver acceleration behaviour and technical feedback. International Journal of Industrial Ergonomics, 37, 333-343.
Birrell, S.A. and Young, M.S., 2009. Smart driving aids and their effects on driving performance and driver distraction. Proceedings of First International Conference on Driver Distraction and Inattention, Gothenburg, Sweden, 28-29 September 2009.
Birrell, SA., Young, MS., Stanton, NA. and Jenkins, DP., 2008. Improving driver behaviour by design: A Cognitive Work Analysis methodology. Applied Human Factors and Ergonomics 2nd International Conference, 14-17 July 2008, Las Vegas, USA.
Bliss, J.P., Kilpatrick, F., 2000. The influence of verbal content on alarm mistrust. Proceedings of the 2000 Human Factors and Ergonomics Society Annual Meeting, San Diego, CA, July 30–August 4.
Brewster, S.A., Wright, P.C. and Edwards, A.D.N., 1993. An evaluation of earcons for use in auditory human-computer interfaces. Proceedings of the INTERACT ’93 and CHI ’93 conference on Human Factors in Computing Systems (pp. 222-227), Amsterdam, The Netherlands. Association for Computing Machinery.
Brooke, J., 1996. SUS: A "quick and dirty" usability scale. In P. W. Jordan, B. Thomas, B. A. Weerdmeester and A. L. McClelland (eds.) Usability Evaluation in Industry. Taylor and Francis, London, UK.
Burns, C.B., and Hajdukiewicz, J.R., 2004. Ecological Interface Design. CRC Press, Boca Raton, FL.
Christoffersen, K., Hunter, C.N. and Vicente, K.J., 1998. A longitudinal study of the effects of ecological interface design on deep knowledge. International Journal of Human-Computer Studies, 48, 729-762.
Davidsson, S., Alm, H., Birrell, S. A. and Young, M. S., 2009. Work Domain Analysis for driver information. IEA 2009 – 17th World Congress on Ergonomics, August 9-14 2009, Beijing, China.
Donmez, B., Boyle, L., and Lee, J., 2007. Safety implications of providing real-time feedback to distracted drivers. Accident Analysis & Prevention, 39, 581-590.
EC, 2008. Commission Recommendation on safe and efficient in-vehicle information and communication systems: update of the European Statement of Principles on human-machine interface. Official Journal of the European Union,
23 Edworthy, J. and Stanton, N., 1995. A user-centred approach to the design and
evaluation of auditory warning signals: 1. Methodology. Ergonomics, 38, 2262-2280.
EEA, 2007. Annual European Community greenhouse gas inventory 1990-2005 and inventory report 2007. European Environment Agency, 1-38.
Gaver, WW., 1986. Auditory icons: Using sound in computer interfaces. Human-Computer Interaction, 2, 167-177.
Gaver, WW., 1989. The SonicFinder: An interface that uses auditory icons. Human-Computer Interaction, 4, 67-94.
Gibson, J.J., 1979. The Ecological Approach to Visual Perception. LEA, New Jersey.
Gibson, JJ. and Crooks, LE., 1938. A theoretical field-analysis of automobile driving. The American Journal of Psychology, 51, 453-471.
Graham, R., 1999. Use of auditory icons as emergency warnings: Evaluation within a vehicle collision avoidance application. Ergonomics, 42, 1233-1248.
Green, P., 1999. Estimating compliance with the 15-second rule for driver-interface usability and safety. 43rd Annual Meeting of the Human Factors and
Ergonomics Society. 27 September - 1 October 1999, Houston, USA.
Hajdukiewicz, J. R. and Vicente, K. J., 2004. A theoretical note on the relationship between work domain analysis and task analysis. Theoretical Issues in Ergonomics Science, 5(6), 527-538.
Harbluk, J., Noy, Y., Trbovich, P. and Eizenman, 2007. An on-road assessment of cognitive distraction: Impacts on drivers' visual behaviour and braking performance, Accident Analysis and Prevention, 39, 372-379.
Hellier, EJ., Edworthy, J. and Dennis, I., 1993. Improving auditory warning design: Quantifying and predicting the effects of different warning parameters on perceived urgency. Human Factors, 35, 693-706
Hoff, T., 2004. Comments on the ecology of representations in computerised systems. Theoretical Issues in Ergonomics Science, 5(5), 453-472.
ISO 11429:1996. Ergonomics – System of auditory and visual danger and
information signals. International Organization for Standardization, Geneva, Switzerland.
24 ISO 2575:2004. Road vehicles – Symbols for controls, indicators and tell-tales.
International Organization for Standardization, Geneva, Switzerland.
Jamieson, G.A. (2003). Bridging the gap between cognitive work analysis and ecological interface design. Proceedings of the 47th Annual Meeting of the Human Factors and Ergonomics Society, Denver, CO, October 13-17 2003.
Jamieson, G.A., Ho, W.H. and Reising, D.V.C. (2003). Ecological Interface Design in practice: A design for petrochemical processing operations. In J.A. Jacko and C. Stephanidis (Eds.), Human-Computer Interaction: Theory and Practice (Part 1, Vol. 1) (pp. 133-137). Mahwah, NJ: Lawrence Erlbaum Associates.
Jamieson, G.A. and Vicente, K.J. (2001). Ecological interface design for petrochemical applications: supporting operator adaptation, continuous learning, and distributed, collaborative work. Computers and Chemical Engineering, 25, 1055-1074.
Jenkins, D. P.; Stanton, N. A.; Walker, G. H.; Young, M. S., 2007, A new approach to designing lateral collision warning systems, International Journal of Vehicle Design, 45, 379-396.
Jones, SD. and Furner, SM., 1989. The construction of audio icons and information cues for human-computer dialogues. In Megaw, ED., (ed), Contemporary Ergonomics (pp. 436-441). Taylor & Francis, London.
Lee, J. D. et al., 2006. Application of ecological interface design to driver support systems. IEA 2006 Congress (CD-ROM). Amsterdam: Elsevier
Lintern, G., Cone, S., Schenaker, M., Ehlert, J. & Hughes, T., 2004. Asymmetric Adversary Analysis for Intelligent Preparation of the Battlespace (A3-IPB). United States Air Force Research Department Report.
Klauer, S., Dingus, D., Neale, T., Sudweeks, J. and Ramset, D. 2006. The impact of driver inattention on near-crash/crash risk: An analysis using the 100-car naturalistic study data. Washington, DC: National Highway Traffic Safety Administration
(NHTSA), Report No: DOT HS 810 594, 1-244.
Lucas, PA., 1995. An evaluation of the communicative ability of auditory icons and earcons. In Kramer, G., (ed), Proceedings of the 2nd International Conference on Auditory Display, ICAD ’94, 121-128.
PACTS, 2007. Beyond 2010 – a holistic approach to road safety in Great Britain. London: Parliamentary Advisory Council for Transport Safety.
Patterson, R., 1982. Guidelines for auditory warning systems on civil aircraft. Civil Aviation Authority Paper 82017, London , UK.
25 Ranney, T. A., 1994. Models of driving behavior: a review of their evolution.
Accident analysis and prevention, 26(6), 733-750.
Rasmussen, J., 1983. Skills, rules, knowledge; signals, signs, and symbols, and other distinctions in human performance models. IEEE Transactions on Systems, Man and Cybernetics, 13, 257-266.
Rasmussen, J., 1985. The role of hierarchical knowledge representation in decision making and system management. IEEE Transactions on Systems, Man and Cybernetics, 15, 234-243
Regan, M.A., Lee., J.D. and Young, K.L., 2009 (Eds.). Driver Distraction: Theory, Effects, and Mitigation. Boca Raton, FL: CRC Press.
Salmon, P. M.; Stanton, N. A.; Regan, M.; Lenne, M.; Young, K., 2007. Work domain analysis and road transport: Implications for vehicle design, International Journal of Vehicle Design, 45(3), 426-448.
Sanderson, P., Pipingas, A., Danieli, F. and Silbertstein, R., 2003. Process monitoring and configural display design: a neuroimaging study. Theoretical Issues in Ergonomics Science, 4(1), 151-174.
Seppelt, B. D.; Lee, J. D., 2007, Making adaptive cruise control (ACC) limits visible, International Journal of Human-Computer Studies, 65, 192-205.
Stoner, H. A.; Wiese, E. E.; Lee, J. D., 2003, Applying ecological interface design to the driving domain: The results of an abstraction hierarchy analysis.
Proceedings of the Human Factors and Ergonomics Society 47th Annual Meeting, Santa Monica, CA, 444-448.
van der Voort, M., Dougherty, M. and van Maarseveen, M., 2001. A prototype fuel efficiency support tool. Transportation Research Part C, 9, 279-296.
Vicente, K., 1999a. Cognitive work analysis: Toward safe, productive, and healthy computer-based work,Mahwah, NJ: Lawrence Erlbaum Associates.
Vicente, K., 1999b. Ecological Interface Design: Supporting operator adaptation, continuous learning, distributed, collaborative work. Proceedings of the Human Centered Processes Conference, 93-97.
Vicente, K.J., 2002. Ecological Interface Design: progress and challenges. Human Factors, 44, 62-78.
Vicente, K., and Rasmussen, J., 1992. Ecological Interface Design: Theoretical foundations. IEEE Transactions on Systems, Man and Cybernetics, 22, 589-606.
26 Wickens, CD., 1984. Processing resources in attention. In Parasuraman, R. and
Davies, DR., (eds.), Varieties of attention (pp. 63-102). Academic Press, New York.
27
Table 1: Mean ratings given for each audio option within each real-time driving parameter.
Eco Parameter Mean SD Safety Parameter Mean SD
Change Auditory 1.45 0.69 Lane Auditory 2.25 0.91
Up Earcon 1.89 0.74 Deviation Earcon 1.90 0.79
Speech 2.63 0.60 Speech 1.85 0.75
Change Auditory 1.40 0.68 Headway Auditory 2.37 0.83
Down Earcon 1.95 0.71 Earcon 1.55 0.76
Speech 2.58 0.69 Speech 2.11 0.74
Accel'n Auditory 1.50 0.76 Lane Auditory 1.75 0.85
Earcon 2.00 0.79 Instability Earcon 1.84 0.76
Speech 2.53 0.61 Speech 2.37 0.76
Braking Auditory 1.55 0.76
Earcon 1.89 0.81
28
[image:29.595.100.272.131.330.2]List of Figure captions
Figure 1: Prototype EID interface.
[image:29.595.93.414.368.580.2]