Munich Personal RePEc Archive
Evaluating the liberalization process on
Telecommunications services for EU
countries
Agiakloglou, Christos and Polemis, Michael
University of Piraeus, Greece
28 November 2017
Online at
https://mpra.ub.uni-muenchen.de/85119/
Evaluating the liberalization process on
Telecommunications services for EU countries
Christos Agiakloglou and Michael Polemis*
University of Piraeus, Greece
Abstract
This paper investigates the main determinants of Telecommunications demand for European Union (EU) countries using a panel data set for 19 EU countries over the period 1991-2010, capturing the years before and after the liberalization process. The
goal is to clarify whether any changes in the demand of Telecommunications, as expressed by volume of traffic in local, mobile and international market segments, are
attributed to regulatory process or to some other major drivers, taking also into account the relevant price elasticities. It turns out that the regulatory process does not seem to have significant impact on demand for Telecommunications services for the
first period of liberalization.
Keywords: Telecommunications Demand, Price Elasticities, Regulation, Panel data
1. INTRODUCTION
The Telecommunications sector in Europe has undergone substantial regulatory and institutional reorganizations over the last two decades. Specifically, the European
Union (EU) has issued several directives (1998/84/EC, 2002/21/EC and 2009/140/EC) in order to promote effective competition in each market segment of
the sector. The primary goal of these Directives was to establish a common regulatory framework in Telecommunications within the EU countries, although, in practice, the implementation process varied considerably across member states.
As a result, the Telecommunications industry in EU has changed drastically, in terms of the intensity of competition, moving from a pure monopolistic environment to a regulated regime, where this regulatory process was controlled by National
Regulatory Authorities, known as NRAs (Beesley and Littlechild, 1989). Indeed, up
to the early ‘90s the Telecommunications sector in Europe was governed by vertically integrated state-owned companies, whereas after this period several policy actions have been taken to facilitate regulation in terms of formulating prices and revenues to
meet social and macroeconomic goals (Boylaud and Nicoletti, 2001). The liberalization of the industry was a necessary tool to eliminate distortions, generated
by the Public Telecommunications Operators (PTOs) that failed to meet social goals, and to enhance competition in order to provide better quality of services at lower prices (Newbery, 2002). Meanwhile, the demand for Telecommunications services
has overall increased over the last few years, without being able though to determine whether this increase is due to market opening or to other macroeconomic and demographic factors, such as economic activity, population density, technology and
These two fundamental characteristics of the Telecommunications sector, i.e.,
the regulatory process and all determinants of demand, gave researchers the incentive to analyze and investigate the behavior of the industry. For example, Laffont and Tirole (1993 & 2000) focused their research on regulation and they concluded that a
good regulatory framework requires cost and demand information. Other studies examined the impact of structural reforms, such as regulation, competition and
privatization, on telecommunications performance, see for example Agiakloglou and Polemis (2017) and Wallsten (2001), whereas several other studies attempted to analyze the Telecommunications demand using different empirical approaches, see
for example, Agiakloglou and Karkalakos (2007), Agiakloglou and Yiannelis (2005), Madden and Savage (2000), Wright (1999), Garin Munoz and Perez Amaral (1998), Sandbach (1996), Acton and Vogelsand (1992) and Bewley and Fiebig (1988).
Clearly, determining demand conditions for Telecommunications is not only
important for the operating companies but it is also essential for the NRAs. Existing companies need to know how their demand is formulated to design their strategies for their short run and long run internal and market goals, whereas NRAs need to know
market conditions to pursue policies and set rules regarding the structure, the conduct and the performance of the industry.
As it is known, demand conditions for Telecommunications services are determines by volume of traffic of calls in each market segment and prices (see for example Squire, 1973 and Rohlfs, 1974) as well as by several other macro and micro
study is to clarify whether the deregulation process has affected volume of calls in
three market segments, such as local, mobile and international calls.
The paper is organized as follows. Section 2 presents the data and the variables used in the relevant econometric methodology. Section 3 reports and
analyzes the empirical results, whereas the concluding remarks as well as some policy implications are portrayed in Section 4.
2. DATA AND MODEL
We consider volume of calls as the main response variable to study demand for Telecommunications for three market segments such as: a) local, measured by fixed to
fixed telephone traffic in minutes (LOCAL), b) mobile, measured by domestic mobile
telephone traffic in minutes (MOB) and c) international, measured by total international outgoing fixed telephone traffic in minutes (INTER). These variables are obtained from the World Telecommunications / ICT Indicators database (June
2014) published by the International Telecommunications Union (ITU) for 19 EU countries over the period 1991 – 2010.1
The explanatory variables used to identify the behavior of these response variables are categorized in two sets: a) structural reform variables and b) macroeconomic and demographic variables. The first set of explanatory variables
tries to capture the impact of structural reforms, such as regulation, competition and privatization, on the volume of Telecommunications services. For this reason we use: a) for regulation the Regulatory Reform Index (RRI), an index that measures the level
of regulation in Telecommunications for each country, taking values from 0 to 6,
meaning perfectly deregulated market to totally regulated market respectively, b) for privatization a dummy variable (PRIV) taking the value of one when the percentage of shares in the PTO owned by the government is less than 50% and zero otherwise
and c) for competition three dummy variables (COMP_LOCAL, COMP_MOB and COMP_INTER) accounting for the competitive conditions prevailing in local-trunk,
mobile and international market segments, respectively, taking the value of one if competition exists in each of the three market segments and zero otherwise. The data for all of the above variables is obtained directly from the OECD regulation database.
It is interesting to point out that the RRI index is formed according to the methodology of Conway and Nicoletti (2006) capturing several elements of market structure and it has been used in several other empirical studies (see, for example, Li
and Lyons, 2012, Pompei, 2013, Nesta et al, 2014).
The second set of variables includes some macroeconomic and demographic variables such as: a) the FRASER index, b) the number of active subscribers per 100 inhabitants for local-fixed and mobile market segments, i.e., F_SUBS and M_SUBS
respectively, and c) population density (POP). Specifically, the FRASER index is a very important measure that declares the prevailing degree of economic risk in each
country. This index takes values from 0 to 10, with the highest value indicating less economic risk, and it is generated as a weighted average of five main macroeconomic factors such as: i) the size of government, ii) the legal system and property rights, iii)
FRASER Institute and from the World Development Indicators Database available
from the World Bank respectively.
The model adopted for this study is given by the following equation:
0 1 2 it 3 it 4
jit it it t i it
Y a a RRI a COMP a PRIV a X u (1)
where all non-index variables are in natural logarithms, j = 1, 2, 3 denotes the three
dependent variables, i.e., LOCAL, MOB and INTER, for all countries (i) at time t and the errors (εit) are uncorrelated to each other. Xit is a vector of control variables
described above. 2 The γ
t stands for the time fixed effects and ui are the country fixed effects that control for differences across countries (see Agiakloglou and Polemis,
2017).
3. EMPIRICAL RESULTS
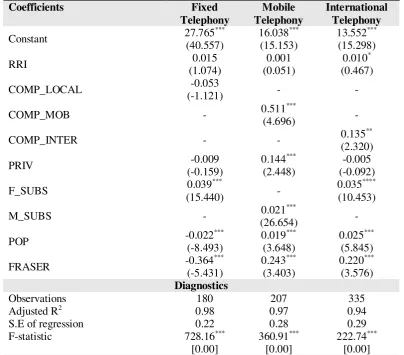
Model (1) is estimated using OLS with fixed effects for each of the three market
segments and the results are reported on Table 1.3 As can be seen from column one of this table none of the three structural reform variables affects the volume of fixed telephone traffic in the local market segment, since their coefficients are not
statistically significant. This result denotes that the deregulation process does not affect the volume of calls for this specific market segment. 4 One possible explanation
for this finding can be attributed to the fact that the demand for this particular segment of the Telecommunications market has not been increased, since other modes of
2 It is interesting to indicate that several other macroeconomic variables are included to model (1), such as Gross Domestic Product (GDP), Foreign Direct Investments (FDIs), Exports to GDP (EX) and the level of Total Employment (EMPL), but these variables did not produce significant results for all cases and therefore have been excluded.
3 Model (1) is also estimated with random effects, but the Hausman (1978) test did not accept the null hypothesis of these effects.
Telecommunications have been risen absorbing part of this volume of traffic. Hence,
the volume of fixed telephone traffic is affected by the other variables included in model (1).
Specifically, the number of active subscribers per 100 inhabitants for fixed
telephone lines has a positive and statistically significant impact on the level of traffic volume for the local market segment. However, its magnitude is rather small, i.e.,
equal to 3.9%, meaning that a 100% increase (decrease) of the number of subscribers will lead to a roughly 4% increase (decrease) of the traffic volume, ceteris paribus. This small magnitude is probably attributed to the fact that subscribers tend to apply
for fixed line connections not basically to make telephone calls, but to obtain other high value added complementary services bundled to a fixed line. Therefore, it is more important for firms, in terms of pricing, to charge low prices for fixed telephony
and high prices for all other complementary services, such as internet and broadband
connections, as well as cable TV.
On the other hand, the other two variables, population density and FRASER index, have a negative and statistically significant impact on the level of traffic
volume for fixed telephony. Clearly, as population density increases, the volume of fixed telephone traffic decreases, indicating the existence of a substitution effect, i.e.,
people tend to substitute fixed telephony with other more advanced ways of communications, such as mobile telephony. Similarly, as the economic risk of a country decreases, meaning that the FRASER index increases, people tend to use
more often other means of communications rather than fixed telephony, such as broadband services.
reform variables provide mixed results. In particular, the level of competition has
positive and statistically significant effect on volume, although, its magnitude is small, relative to the constant term, since it is a dummy variable, indicating that competition has minor impact on the volume of mobile telephony. Similarly,
privatization has positive and statistically significant effect on volume with an estimate of 0.14, lower than the 0.51 estimate of competition, indicating that more
privatization does not necessarily lead to a large increase in volume. On the contrary, the volume of mobile telephony is not affected by the level of regulation, since its coefficient is not statistically significant. Perhaps, one possible explanation for this
finding is attributed to the fact that the market for mobile telephony has opened instantly without the necessary regulatory enforcement period.
The other three variables, such as the number of mobile subscribers, the
population density and the FRASER index, do statistically significant affect the
behavior of the dependent variable. For example, the volume of mobile telephony is positively related to the number of mobile subscribers, as expected and similarly found in the case of local telephony. Likewise, population density and FRASER
index have positive impact on the volume of mobile telephony, a result though that it is in alignment with the one obtained for fixed telephony. This finding supports the
argument that people tend to use more mobile telephony, instead of conventional means of communication, such as fixed telephony, as economic activity grows along with the population density. It is also interesting to point out that the magnitude of
Finally, column three of Table 1 depicts the estimated results by using the
international volume traffic as the dependent variable. The effect of structural reform variables on international calls is different than the one obtained from the other two market segments. In this case, only the level of competition has statistically
significant effect on volume of international calls, while the other two structural reform variables, such as privatization and regulation, do not play any role in
determining the volume of this market segment. This finding can be justified by the fact that it is relatively easy for potential firms to enter the market and provide international calls at competitive prices. However, the magnitude of the estimated
coefficient of competition is relatively small, as indicated in the other two market segments, revealing that competition has limited impact on international volume traffic.
The number of fixed subscribers, the population density and the FRASER index
have statistically significant impact on the volume of international calls, as has been found for the other two market segments. However, all estimates of their coefficients are positive, compared to the fixed telephony at the local market, indicating that as
economy grows, along with population density and the number of subscribers, the traffic for international calls increases. This result is attributed to the fact that people
prefer to make their international calls through fixed line connections since calls are typically less expensive than calls made through mobile telephony. Similarly to the mobile market the magnitude of the coefficient of the FRASER index is substantially
Clearly, to support further the findings of this study a complimentary analysis is
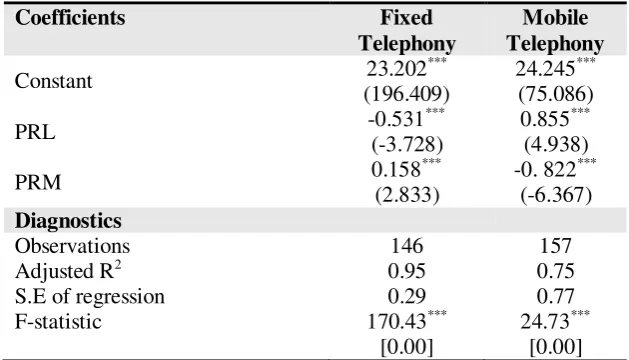
implemented in terms of estimating own and cross price elasticies for Local and Mobile market segments in order to obtain robust and meaningful results using only prices for Fixed and Mobile calls as regressors in model (1). For this reason we use
the price of a three minute local call to a fixed telephone line at pick rate, named as PRL, and the mobile cellular prepaid price of a three minute local call, at pick on net
rate, named as PRM, as a proxy variable of a regular price of three minutes mobile call. The values of these prices are obtained from the World Telecommunications / ICT Indicators database (June 2014) published by the ITU and the estimated own and
cross price elesticities for fixed and mobile telephony are reported on Table 2.5 In particular, column one of Table 2 reports the estimated results of regressing volume of fixed telephony on its own price and on the price of mobile telephony. The
own price elasticity of fixed telephony is equal to -0.53, whereas the cross price
elasticity of fixed telephony using prices of mobile telephony is equal to 0.15. All estimates are statistically significant and have the anticipated signs. More specifically, the absolute value of the own price elasticity of fixed telephony is less
than one, indicating inelastic demand, whereas the positive cross price elasticity suggests the existence of a substitution effect. However, the magnitude of the cross
price elasticity is small, close to zero, revealing that a price increase of the mobile telephony has a minor and negligible effect on the demand for fixed telephony.
In contrast, the own price elasticity of mobile telephony is equal to -0.82,
whereas the cross price elasticity of mobile to fixed telephony equals to 0.85, as can been seen from column two of Table 2. These results are obtained by regressing volume of mobile telephony on its own price and on the price of fixed telephony and
all estimates are statistically significant and have the proper signs. The own price
elasticity of mobile telephony is in absolute terms less than one, indicating also an inelastic demand for this market, whereas the cross price elasticity is positive, declaring the existence of a substitution effect.
Nevertheless, important results emerge by comparing the estimates of own and cross price elasticities obtained by the two market segments. First, the magnitude of
the own price elasticity of mobile telephony is larger in absolute terms than the one obtained in fixed telephony. This finding can be explained by the fact that fixed subscribers are less active to change provider than mobile subscribers. On the other
hand, the magnitude of the cross price elasticity of mobile telephony is almost six times larger than its counterpart cross price elasticity for fixed telephony, indicating that the substitution effect is more sensitive towards the mobile rather than the fixed
telephony market to price changes.
4. CONCLUDING REMARKS AND POLICY IMPLICATIONS
This paper studied the main determinants of Telecommunications demand for three
market segments (local, mobile and international) before and after the the liberalization process of the industry across 19 EU countries. The aim of this research was to explore the impact of structural reform variables, such as, regulation,
The empirical findings based on a panel fixed effects static model suggest that
structural reform variables do not have uniform impact on volume of calls in all of the three examined market segments. In particular, for the local market none of the three structural reform variables play significant role in determining the volume of calls.
On the contrary, competition and privatization do affect positively and statistically significant the volume of mobile calls, whereas the level of regulation does not
influence at all the volume of this market. Finally, for the international market only the level of competition has positive and statistically significant effect on volume of calls compared to the other two structural reform variables.
Moreover, the aforementioned findings are in alignment with the existing economic conditions. The local market seems to remain unaltered by the liberalization process, simply because the tendency was to move away from this
market to some other niche markets, such as mobile. On the other hand, the mobile
and the international markets have been affected mainly by competition due to gradually decreases in prices. The switching of the demand from fixed to mobile telephony can also be supported by the positive sign of the cross price elasticity. This
result strongly suggests the existence of a substitution effect between fixed and mobile demand, favorable towards mobile telephony, revealing the robustness of the
empirical findings.
Finally, all other macroeconomic and demographic variables do statistically significant affect the volume of calls in all three market segments, but, to some extent,
at a different impact. As it is showed, the number of subscribers affects positively the volume of calls in all markets. However, the population density and the level of economic risk, have a negative impact on the level of traffic volume only for fixed
economy and technology grow the relative importance of fixed telephony to the
overall Telecommunications sector decreases.
Hence, it turns out that the regulatory process did not have substantial impact on Telecommunications demand for the first period of liberalization. The demand for
Telecommunications for the three examined market segments seems to be affected by other factors and, therefore, policy makers should not pursue strategies towards to a
more regulated industry. The opening of the Telecommunications sector, due to regulatory efforts, gave the incentive to several companies to enter the market offering products and services at competitive prices. As a result these companies gained
market shares from the incumbent without though being able to increase the demand for Telecommunications in the EU.
Acknowledgments
REFERENCES
Agiakloglou, C. and Bloutsos K., 2011, “Comparing Estimates of Risk Between Markets and Telecommunications Institutions in Europe”, Applied Economics
Letters, 18, pp. 575–579.
Agiakloglou, C. and Gkouvakis M., 2014, “Causal Interrelations Among Market
Fundamentals: Evidence From the European Telecommunications Sector”, The Quarterly Review of Economics and Finance (In Press).
Agiakloglou, C. and Karkalakos S., 2009, “A Spatial and Economic Analysis for Telecommunications: Evidence from the European Union”, Journal of Applied Economics, XII, pp 11-32.
Agiakloglou, C. and Polemis M., 2017, “The Impact of Structural Reforms on Telecommunications Performance”, Journal of Industry Competition and
Trade, https://doi.org/10.1007/s10842-017-0261-4.
Agiakloglou, C. and Yiannelis D., 2005, “Estimation of Price Elasticities for International Telecommunications Demand”, International Advances in Economic Research, 12, pp 131-137.
Alesina, A., Silvia, A., Nicoletti, G., Schiantarelli, F., 2005. “Regulation and Investment”. Journal of the European Economic Association, 3(4), pp. 791– 825.
Arellano, M. Bond S., 1991. “Some Tests of Specification for Panel Data: Monte Carlo Evidence and an Application to Employment Equations”, Review of Economic Studies, 58(2), 277-297.
Averch, H. and Johnson L.L., 1962. “Behavior of the Firm Under Regulatory Constraint”, American Economic Review, 52, pp. 1052–1069.
Beesley and Littlechild., 1989. “The Regulation of Privatized Monopolies in the United Kingdom”, Rand Journal of Economics, 20(3), pp. 454-472.
Bortolotti, B. D’ Souza J. Fantini, M. and Megginson W.L., 2002, ‘‘Privatization and the Sources of Performance Improvement in the Global Telecommunications Industry’’, Telecommunications Policy, 26, pp. 243-258
Boylaud, O. and Nikoletti G., 2001, “Regulation, Market Structure and Performance in Telecommunications”, OECD Economic studies No 32.
Cadman., R., 2007, “Regulation and Investment in European Telecoms Markets. Prepared for the European Competitive Telecoms Association”, Strategy and Policy Consultant Network.
Conway P., Nicoletti, G., 2006, “Product Market Regulation in the Non-Manufacturing Sectors of OECD Countries: Measurement and Highlights”, OECD Economics Department Working Papers 530.
Datta, A. and Agarwal, S., 2004, ‘‘Telecommunications and economic growth: a panel data approach’’, Applied Economics, 36, pp. 1649-1654
Estache, A. Goicochea, A. Manacorda, M., 2006, “Telecommunications Performance,
Reforms and Governance”, World Bank Policy Research Working Paper 3822
Fink, C. A. Mattoo, and Rathindran, R., 2002. “Liberalizing Basic
Telecommunications: Evidence from Developing Countries.” World Bank
Working Paper, Washington.
Gual, J. and Thrillas, Fr., 2004, ‘‘Telecommunications Policies: Determinants and
Impact’’, Centre for Economic Policy ResearchDiscussion paper series 4578, London: CEPR
Gutierrez, L.H., 2003, “The Effect of Endogenous Regulation on Telecommunications Expansion and Efficiency in Latin America”, Journal of Regulatory Economics, 23(3), pp. 257-286
Hausman, J., 1978, “Specification Tests in Econometrics“, Econometrica, 46, pp. 1251- 1262.
Hausman, J. and Ros, Α., 2013, “An Econometric Assessment of Telecommunications Prices and Consumer Surplus in Mexico Using Panel Data”, Journal of Regulatory Economics, 43, pp. 284–304
Kim, J. Kim, Y. Gaston, N. Lestage, R. Kim, Y. Flacher, D., 2011. “Access Regulation and Infrastructure Investment in the Mobile Telecommunications Industry”, Telecommunications Policy 35, pp. 907–919.
Knorr, A., 2002, “Liberalization in Telecommunication”, HWWA Discussion Paper 162
Laffont, J. and Tirole, J., 2000, “Competition in Telecommunications”, MIT Press, London
Leibenstein, H., 1966. “Allocative Efficiency versus X-Efficiency”, American Economic Review, 56, pp. 392–415.
Lestage, R. Flacher, D. Kim, Y. Kim, J. Kim, Y., 2013, “Competition and Investment in Telecommunications: Does Competition Have the Same Impact on Investment by Private and State-Owned Firms?”, Information Economics and
Policy 25, pp. 41–50.
Li, Y. and Lyons, B., 2012, “Market Structure, Regulation and the Speed of Mobile Network Penetration”, International Journal of Industrial Organization, 30, pp. 697–707
Madden, G. and Savage, S.J., 1998, “CEE Telecommunications Investment and Economic Growth”, Information Economics and Policy, 10, pp. 173- 195 Madden, G. and Savage, S.J., 2000, “Market Structure, Competition, and Pricing in
United States International Telephone”, The Review of Economics and Statistics, 82, pp. 291-296.
Munoz, T. G. and Amaral, T. P., 1998, “Econometric modeling of Spanish very long
distance international calling”, Information Economics and Policy, 10, pp. 237-252.
Nesta, L., Vona, F., Nicolli, F., 2014, “Environmental Policies, Competition and Innovation in Renewable Energy”, Journal of Environmental Economics and Management, 67, pp. 396–411.
Paleologos, J. and Polemis, M., 2013. “What Drives Investment in the Telecommunications Sector? Some Lessons from the OECD Countries”,
Economic Modelling, 31, pp. 49-57.
Pompei, F., 2013, “Heterogeneous Effects of Regulation on the Efficiency of the Electricity Industry Across European Union Countries”, Energy Economics
40, pp. 569–585.
Röller, L-H., Waverman, L., 2001. “Telecommunications Infrastructure and Economic Development: A Simultaneous Approach”, The American Economic Review, 91(4), pp. 909-923 .
Rohlfs, J. 1974, “A Theory of Interdependent Demand for a Communications Service” Bell Journal of Economics, 5(1), pp. 16-37.
Schenker, N. and Taylor J.M.G., 1996 “Partially Parametric Techniques for Multiple Imputation”, Computational Statistics and Data Analysis, 22, pp. 425-446. Squire, L., 1973, “Some Aspects of Optimal Pricing for Telecommunications”, The
Bell Journal of Economics, 4(2), pp. 515-525.
Thatcher, M., 1999, “The Europeanization of Regulation. The Case of Telecommunication”, European University institute, Working Paper RS (N 99/22).
Taylor, L., D. 1994, Telecommunications Demand: A Survey and Critique, London, Kluwer Academic.
Wallsten, S. J., 2001, “An Econometric Analysis of Telecom Competition, Privatization and Regulation in Africa and Latin America”, The Journal of Industrial Economics, 49, pp. 1-19.
Wallsten, S. J., 2004, “Privatizing Monopolies in Developing Countries: The Real Effects of Exclusivity Periods in Telecommunications”, Journal of Regulatory
Economics, 26(3), pp. 303–320.
Winter,S., 1984. “Schumpeterian Competition in Alternative Chronological Regimes”. Journal of Economic Behavior and Organization28, pp. 287–320.
Wright, J. 1999, “International Telecommunications, Settlement Rates and the FCC”,
Journal of Regulatory Economics, 15, pp. 267-291.
Yemane, Wolde–R. 2007, “Another Look at the Relationship Between Telecommunications Investment and Economic Activity in the United states”,
International Economic Journal, 21, pp. 199-205
Yoo, S. H. and Kwak, S. J., 2004, ‘‘Information Technology and economic
List of Tables
Table 1: Fixed effects results
Coefficients Fixed Telephony
Mobile Telephony
International Telephony
Constant 27.765
*** (40.557) 16.038*** (15.153) 13.552*** (15.298)
RRI 0.015
(1.074)
0.001 (0.051)
0.010* (0.467)
COMP_LOCAL -0.053
(-1.121) - -
COMP_MOB - 0.511
***
(4.696) -
COMP_INTER - - 0.135
**
(2.320)
PRIV -0.009
(-0.159)
0.144*** (2.448)
-0.005 (-0.092)
F_SUBS 0.039
***
(15.440) -
0.035**** (10.453)
M_SUBS - 0.021
***
(26.654) -
POP -0.022
*** (-8.493) 0.019*** (3.648) 0.025*** (5.845)
FRASER -0.364
*** (-5.431) 0.243*** (3.403) 0.220*** (3.576) Diagnostics
Observations 180 207 335
Adjusted R2 0.98 0.97 0.94
S.E of regression 0.22 0.28 0.29
F-statistic 728.16***
[0.00]
360.91*** [0.00]
222.74*** [0.00]
Table 2: Own and Cross Price Elasticities
Coefficients Fixed Telephony
Mobile Telephony
Constant 23.202
***
(196.409)
24.245*** (75.086)
PRL -0.531
***
(-3.728)
0.855*** (4.938)
PRM 0.158
***
(2.833)
-0. 822*** (-6.367)
Diagnostics
Observations 146 157
Adjusted R2 0.95 0.75
S.E of regression 0.29 0.77
F-statistic 170.43***
[0.00]
24.73*** [0.00]