ON THE COMPENSATION OF PROBE POSITIONING ERRORS WHEN USING A NONREDUNDANT CYLIN-DRICAL NF-FF TRANSFORMATION
F. D’Agostino, F. Ferrara, C. Gennarelli, R. Guerriero and M. Migliozzi
Dipartimento di Ingegneria dell’Informazione ed Ingegneria Elettrica University of Salerno
via Ponte Don Melillo, 84084 Fisciano (Salerno), Italy
Abstract—Two different approaches for compensating the probe positioning errors in a near-field–far-field transformation with cylindrical scanning using a nonredundant number of measurements are presented and experimentally validated in this paper. In order to evaluate the uniformly distributed samples from the irregularly spaced ones, the former makes use of the singular value decomposition method, whereas the latter employs an iterative technique. In both the cases, the near-field data needed by a standard near-field-far-field transformation are efficiently evaluated via an optimal sampling interpolation algorithm.
1. INTRODUCTION
In the last fifteen years, the theoretical results on the nonredundant representations of electromagnetic (EM) fields [1] have allowed the development of efficient near-field-far-field (NF-FF) transformation techniques, which generally require a number of NF data remarkably lower than the standard ones. As a matter of fact, the NF data needed by the standard NF-FF transformations are accurately recovered by interpolating the minimum set of measurements via optimal sampling interpolation (OSI) expansions. A substantial time saving can be so achieved making these transformations more and more appealing, since nowadays the measurement time is very much greater than the computational one.
The mathematical foundation to achieve this result relies on the quasi-bandlimitation properties of EM fields [2] and their
nonredundant sampling representations [1]. In fact, according to [1], the EM fields radiated by finite size sources enclosed in a convex domain bounded by a rotational surface Σ and observed on a surfaceM having the same rotational symmetry can be very well approximated by spatially bandlimited functions, provided that a proper phase factor is singled out by the field expression and proper parameterizations are employed to describe M. Since, as shown in [3], the voltage acquired by a nondirective probe has the same effective bandwidth of the field radiated by the antenna under test (AUT), these sampling representations can be applied also to the voltage measured by such a kind of probe.
From a practical viewpoint, it may be impossible to get regularly spaced NF measurements due to an inaccurate control of the positioning systems. On the other hand, the actual measurement positions can be accurately read by optical devices. Moreover, the finite resolution of the positioning devices prevents the possibility to locate exactly the receiving probe at the points fixed by the sampling representation. In light of these considerations, the development of an accurate and stable reconstruction algorithm from nonuniformly distributed data becomes relevant.
interpolation formula. As a matter of fact, once the uniform samples have been determined, the value at any point of the scanning surface can be recovered by an accurate and stable OSI formula.
In this framework, two different approaches have been proposed. The former [10, 11] relies on the singular value decomposition (SVD) method and has been applied when the two-dimensional problem can be reduced to find the solution of two independent one-dimensional ones. Moreover, it may take advantage of data redundancy for increasing the algorithm stability [10, 11]. The latter [9, 12] is based on an iterative technique which has been found convergent only if it is possible to build a biunique correspondence, associating at each uniform sampling point the nearest nonuniform one.
The aim of this paper is to present and experimentally validate these two techniques in the case of the cylindrical scanning. The choice of such a scanning is mainly due to the availability of a NF cylindrical facility at the Antenna Characterization Lab of University of Salerno, but such a validation implicitly confirms the applicability of these approaches to other NF scanning geometries. It is worthy to note that, unlike done in [12], the iterative technique is here applied to a nonredundant NF-FF transformation with cylindrical scanning.
2. SAMPLING REPRESENTATION OF THE VOLTAGE ON A CYLINDER
Let us consider an AUT as enclosed in a convex domain bounded by a rotational surface Σ and a non directive probe scanning a cylinder of radiusdin the NF region. According to [1], the “reduced voltage”
˜
V (ξ) =V (ξ) ejγ(ξ), (1)
where γ(ξ) is a proper phase function and ξ is an optimal parameter used to describe each of the curvesC(generatrices and azimuthal rings) representing the cylindrical surface M, can be well approximated by a spatially bandlimited function. The related bandlimitation error becomes negligible as the bandwidth exceeds a critical valueWξ[1] and, accordingly, it can be effectively controlled by choosing a bandwidth equal toχWξ, whereχ >1 is the bandwidth enlargement factor.
When C is a generatrix, by adopting Wξ = β/2π (β is the wavenumber andis the length of the curveCobtained as intersection between the meridian plane passing through the observation point P and Σ), we get:
γ = β
2
R1+R2+s1−s2
; ξ= π
R1−R2+s1+s2
whereR1,2 are the distances fromP to the tangency pointsP1,2 onC
and s1,2 are their arclength coordinates.
WhenCis a ring,γ is constant and then it is possible to choose for it the value relevant to the generatrix passing through P. Moreover, it is convenient to choose the azimuthal angle ϕ as parameter. The corresponding bandwidth is given [1] by
Wϕ= β
2 maxz
(z−z)2+(d+ρ(z))2−(z−z)2+ (d−ρ(z))2
(3) ρ(z) being the equation of Σ in cylindrical coordinates.
In the following, for sake of simplicity, Σ is assumed coincident with the smallest spherical surface of radiusaable to contain the AUT (see Fig. 1). In such a case, for a generatrix, it results [1, 13]
Wξ =βa; γ =β
r2−a2−βacos−1(
a/r); ξ =ϑ (4)
whereas, the azimuthal bandwidth (3) becomes Wϕ =βasinϑ. By taking into account these results, the reduced voltage at P on the generatrix fixed by ϕ can be evaluated via the following OSI expansion:
˜
V (ϑ, ϕ) =
n0+q
n=n0−q+1
˜
V (ϑn, ϕ) ΩN(ϑ−ϑn)DN(ϑ−ϑn) (5)
wheren0 = Int [(ϑ−Δϑ/4)/Δϑ] is the index of the sample nearest to
the output point, 2q is the number of retained samples, and
ϑn=nΔϑ+ Δϑ/4; Δϑ= 2π 2N+ 1 (6)
N= Int χ N+ 1; N = Int χWξ+ 1 (7)
χ >1 being the oversampling factor needed to control the truncation
error. Moreover,
DN(ϑ) = sin [(2N
+ 1)ϑ/2]
(2N+ 1) sin(ϑ/2);
ΩN(ϑ) =TN
2 cos2(ϑ/2)cos2(ϑ0/2)−1
TN2cos2(ϑ0/2)−1
(8)
are the Dirichlet and Tschebyscheff Sampling functions, respectively, TN(·) being the Tschebyscheff polynomial of degreeN =N−N and
ϑ0=qΔϑ.
The intermediate samples V˜(ϑn, ϕ) can be evaluated by interpolating the samples measured on the rings via a quite analogous OSI formula.
The following two-dimensional OSI expansion thus results:
˜
V (ϑ, ϕ) =
n0+q
n=n0−q+1
{ΩN(ϑ−ϑn)DN(ϑ−ϑn)
·
m0+p
m=m0−p+1
˜
V(ϑn, ϕm,n) ΩMn(ϕ−ϕm,n)DMn(ϕ−ϕm,n)
(9)
where m0 = Int(ϕ/Δϕn), 2p is the number of retained samples along
ϕ
ϕm,n = mΔϕn= 2mπ(2Mn+ 1); Mn= Int χMn+ 1 (10) Mn = Int (χ∗Wϕn) + 1; χ∗= 1 + χ−1
(sinϑn)−2/3 (11) Mn = Mn−Mn, and the other symbols have the same meaning as in (5).
3. FROM NONUNIFORM TO UNIFORM SAMPLES
Two different approaches, which allow the reconstruction of the uniform samples from the nonuniform acquired ones, will be described in this section by highlighting all their features.
3.1. SVD Approach
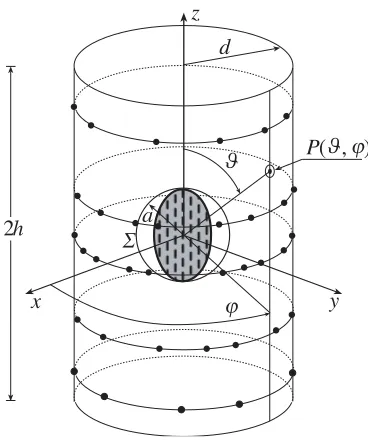
Let us now suppose that the nonuniformly distributed samples lie on rings not regularly spaced (see Fig. 1). This represents a realistic hypothesis in a cylindrical NF facility, where the acquisition is made by rings as required to exploit the possibility of reducing the number of NF data on non-central rings, offered by the described non-redundant representation. In such a hypothesis, the starting two-dimensional problem is reduced to find the solution of two independent one-dimensional problems.
y x
z
ϑ P( , )ϑ ϕ
ϕ Σ
d
2h a
Figure 1. Geometry of the problem.
˜
V(θk, φj) of the known nonuniform samples, x is the sequence of the unknown uniformly distributed samples ˜V(θk, ϕm), and A is the Jk×(2Mk+1) matrix, whose elements are given by the weight functions in the considered OSI expansion:
ajm= ΩMk(φj−ϕm)DM
k (φj −ϕm) (12) Note that, for a fixed row j, these elements are equal to zero if m is out of the range [m0(φj)−p+ 1, m0(φj) +p].
Once the uniform samples on the irregularly spaced rings have been recovered via the SVD algorithm, the OSI expansion along ϕ is employed for determining the intermediate samples ˜V(θk, ϕ) at the intersection points between the nonuniform rings and the generatrix through P. Since these samples are again nonuniformly distributed, the voltage at P can be found by recovering the regularly spaced intermediate samples again via SVD and then interpolating them by means of the OSI formula (5).
To minimize the computational effort for recovering the uniformly spaced samples on the uniform rings, it is convenient to reconstruct the same number Nϕ of samples on each of them. Thus, the samples are aligned along the generatrices and, as a consequence, the number of systems to be solved is minimized. Obviously, Nϕ is fixed by the ring corresponding to the maximum azimuthal bandwidth. Once the uniform samples (nonredundant in ϑ, but slightly redundant in ϕ) have been determined, the data needed to perform a standard NF-FF transformation (e.g., [14]) can be evaluated by using the OSI expansion (9) properly modified to take into account the redundancy inϕ.
3.2. Iterative Approach
Let us now remove the hypothesis that the nonuniformly distributed samples lie on rings not regularly spaced. Thus, the starting two-dimensional problem can no longer be reduced to find the solution of two independent one-dimensional ones. Obviously, the SVD-based approach could be generalized to such a case, but the dimension of the involved matrix would become very large, thus requiring a huge computational effort.
In order to overcome this drawback, it is convenient to resort to the iterative technique [12] and, accordingly, let us assume in the following that the nonuniformly distributed samples are such that it is possible to build a biunique correspondence, associating at each uniform sampling point the “nearest” nonuniform one. In such a case, by expressing the reduced voltage at each nonuniform sampling point (θk, φj,k) as a function of the unknown values at the nearest uniform ones (ϑn, ϕm,n) via the two-dimensional OSI expansion (9), we get:
˜
V(θk, φj,k) =
n0+q
n=n0−q+1
{ΩN(θk−ϑn) DN (θk−ϑn)
·
m0+p
m=m0−p+1
˜
V (ϑn, ϕm,n) ΩMn(φj,k−ϕm,n)DMn(φj,k−ϕm,n)
(13)
By splitting the matrixA in its diagonal and nondiagonal parts, AD and Δ, respectively, multiplying both members of the matrix relation Ax=bby A−D1 and rearranging the terms, it results:
x=A−D1b−A−D1Δx (14)
The following iterative scheme is so obtained:
x(ν) =x(0)−AD−1Δx(ν−1) (15)
where x(0) = A−D1b and x(ν) is the vector of the uniform samples estimated at theνth step. Necessary conditions for the convergence of the above scheme are that the modulus of each element on the principal diagonal of the matrixAbe not zero and greater than those of the other elements on the same row and column [12]. These conditions are surely verified in the assumed hypothesis of biunique correspondence between each uniform sampling point and the “nearest” nonuniform one.
By straightforward evaluations from (15), it results
˜
V(ν)(ϑn, ϕm,n) =
1
ΩN(θn−ϑn)DN(θn−ϑn) ΩMn(φm,n−ϕm,n)DM
n(φm,n−ϕm,n)
·
˜
V(θn, φm,n)−
k0+q
k=k0−q+1 (k=n) ∧
j0+p
j=j0−p+1 (j=m)
ΩN(θn−ϑk)DN(θn−ϑk)
·ΩMk(φm,n−ϕj,k)DM
k (φm,n−ϕj,k) ˜V
(ν−1)(
ϑk, ϕj,k)
(16)
The OSI expansion (9) is then used to reconstruct the NF data needed by a standard probe compensated NF-FF transformation from the so recovered uniform NF samples.
4. EXPERIMENTAL VALIDATION
19.4 cm×14.4 cm, located on the planex= 0 of the adopted reference system (Fig. 1) and operating at the frequency of 10 GHz. Such an AUT has been modelled as enclosed in a sphere having radius equal to 12 cm. The probe output voltages have been collected on a cylinder having d= 43.8 cm and 2h = 240 cm.
In the first set of measurements, the nonuniformly distributed sampling points lie on rings not regularly spaced. In particular, the NF data have been acquired in such a way that the distance between the position of each nonuniform ring and the associated uniform one is random variable uniformly distributed in (−Δϑ/2, Δϑ/2). In a similar way, the distances between the nonuniform sampling points and corresponding uniform ones on each of these rings are random variables uniformly distributed in (−Δϕn/2, Δϕn/2).
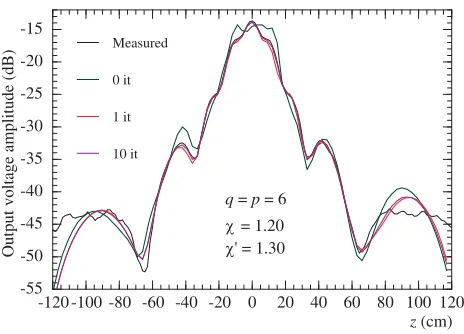
The amplitudes of the probe voltage relevant to the generatrices at ϕ= 0◦ andϕ= 30◦ reconstructed via the SVD-based approach are compared in Figs. 2 and 3 with those directly measured on the same generatrices. As can be seen, although the considered values of probe positioning errors are very pessimistic in an actual scanning, there is an excellent agreement between the reconstructed voltage (crosses) and the measured one (solid line), save for the peripheral zone wherein the error is caused both by the truncation of the scanning zone and the environmental reflections. The same nonuniform NF data have been employed to reconstruct the voltage on the generatrix at ϕ = 0◦ by using the iterative-based approach (see Fig. 4). As can be seen, the
-55 -50 -45 -40 -35 -30 -25 -20 -15
-120 -100 -80 -60 -40 -20 0 20 40 60 80 100 120
Output voltage amplitude (dB)
z (cm) q =p = 6
χ = 1.20 χ' = 1.30
-65 -60 -55 -50 -45 -40 -35 -30
-120 -100 -80 -60 -40 -20 0 20 40 60 80 100 120
Output voltage amplitude (dB)
z (cm) q =p = 6
χ = 1.20 χ' = 1.30
Figure 3. Amplitude of the probe voltage on the generatrix at ϕ = 30◦. Solid line: measured. Crosses: recovered from irregurarly spaced NF data via the SVD-based approach.
-55 -50 -45 -40 -35 -30 -25 -20 -15
-120 -100 -80 -60 -40 -20 0 20 40 60 80 100 120
Output voltage amplitude (dB)
Measured
0 it
1 it
10 it
z (cm) q =p = 6
χ = 1.20 χ' = 1.30
Figure 4. Amplitude of the probe voltage on the generatrix atϕ= 0◦. Black line: measured. Coloured lines: recovered from irregurarly spaced NF data via the iterative approach.
-40 -35 -30 -25 -20 -15 -10 -5 0
15 40 65 90 115 140 165
Relative field amplitude (dB)
q =p = 6 χ = 1.20 χ' = 1.30
ϑ (degrees)
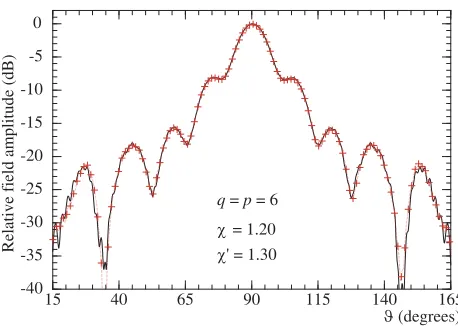
Figure 5. E-plane pattern. Solid line: reference. Crosses: recovered from irregurarly spaced NF data via the SVD-based approach.
-60 -50 -40 -30 -20 -10 0
-75 -60 -45 -30 -15 0 15 30 45 60 75
Relative field amplitude (dB)
ϕ (degrees) q =p = 6
χ = 1.20 χ' = 1.30
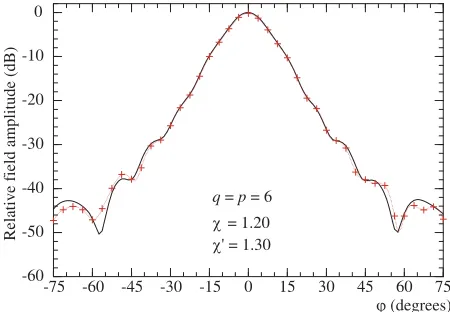
Figure 6. H-plane pattern. Solid line: reference. Crosses: recovered from irregurarly spaced NF data via the SVD-based approach.
NF-FF transformation. Figures 5 and 6 are relevant to the SVD-based approach and refer to the FF pattern reconstructions in the E and H planes, respectively. As can be seen, these reconstructions result to be very accurate, thus confirming the effectiveness of the approach. Practically identical results are obtained when using the iterative technique.
-40 -35 -30 -25 -20 -15 -10 -5 0
15 40 65 90 115 140 165
Relative field amplitude (dB)
ϑ (degrees) q =p = 6
χ = 1.20 χ' = 1.30
Figure 7. E-plane pattern. Solid line: reference. Crosses: recovered from an increased number of nonuniform NF data via the SVD-based approach.
-55 -50 -45 -40 -35 -30 -25 -20 -15
-120 -100 -80 -60 -40 -20 0 20 40 60 80 100 120
Output voltage amplitude (dB)
z (cm) q =p = 6
χ = 1.20 χ' = 1.30
When using the SVD-based technique, it is possible to exploit the data redundancy to increase the algorithm stability. This is confirmed by the better E-plane pattern reconstruction shown in Fig. 7, which has been obtained from an increased number (3 471) of irregularly spaced data.
-180 -150 -120 -90 -60 -30 0 30 60 90 120 150 180
-20 0 20 40 60 80 100 120
Output voltage phase (degrees)
q =p = 6 χ = 1.20 χ' = 1.30
z (cm)
Figure 9. Phase of the probe voltage on the generatrix at ϕ = 0◦. Solid line: measured. Crosses: recovered from irregurarly spaced NF data via the iterative approach.
-40 -35 -30 -25 -20 -15 -10 -5 0
15 40 65 90 115 140 165
Relative field amplitude (dB)
ϑ (degrees) q =p = 6
χ = 1.20 χ' = 1.30
Let us now turn to the validation of the iterative technique when the hypothesis of nonuniform sampling points that lie on rings is removed. To this end, the nonuniform samples have been acquired in such a way that the distances in ϑ and ϕ between the position of each nonuniform sample and the associated uniform one are random variables uniformly distributed in (−Δϑ/3,Δϑ/3) and (−Δϕn/3,Δϕn/3). The amplitude and phase of the reconstructed probe voltage relevant to the generatrix at ϕ = 0◦ are compared in Figs. 8 and 9 with those directly measured. Note that the phase is shown only in the range [−20 cm, 120 cm] in order to improve the readability. At last, the overall effectiveness of the technique is confirmed by theE-plane pattern reconstruction shown in Fig. 10.
5. CONCLUSIONS
In this paper, we have presented and experimentally validated two different techniques to compensate the probe positioning errors in a nonredundant NF-FF transformation with cylindrical scanning. The former makes use of the SVD method for recovering the uniformly distributed samples from the irregularly spaced ones and has been applied when the two-dimensional problem can be reduced to find the solution of two independent one-dimensional ones. The latter employs an iterative technique which requires a one-to-one correspondence, associating at each uniform sampling point the nearest nonuniform one. The validation has been performed at the Antenna Characterization Lab of University of Salerno, where a NF cylindrical facility is available and implicitly confirms the applicability of these approaches to other NF scanning geometries. Although the considered probe positioning errors are very pessimistic in an actual scanning, excellent results have been achieved both in the NF and FF reconstructions.
REFERENCES
1. Bucci, O. M., C. Gennarelli, and C. Savarese, “Representation of electromagnetic fields over arbitrary surfaces by a finite and nonredundant number of samples,” IEEE Trans. Antennas
Propagat., Vol. 46, 351–359, March 1998.
2. Bucci, O. M. and G. Franceschetti, “On the spatial bandwidth of scattered fields,”IEEE Trans. Antennas Propagat., Vol. 35, 1445– 1455, December 1987.
verification,”IEEE Trans. Antennas Propagat., Vol. 46, 204–210, February 1998.
4. Beutler, F. J., “Error-free recovery of signals from irregularly spaced samples,” SIAM Rev., Vol. 8, 328–335, July 1966.
5. Landau, H. J., “Sampling, data transmission, and the Nyquist rate,”Proc. IEEE, Vol. 55, 1701–1706, 1967.
6. Yao, K. and J. B. Thomas, “On some stability and interpolatory properties of nonuniform sampling expansions,” IEEE Trans.
Circuit Theory, Vol. 14, 404–408, 1967.
7. Yen, J. L., “On nonuniform sampling of bandwidth-limited signals,”IEEE Trans. Circuit Theory, Vol. 3, 251–257, 1956. 8. Landau, H. J., “Necessary density conditions for sampling and
interpolation of certain entire functions,” Acta. Math, Vol. 117, 37–52, 1967.
9. Bucci, O. M., C. Gennarelli, and C. Savarese, “Interpolation of electromagnetic radiated fields over a plane from nonuniform samples,” IEEE Trans. Antennas Propagat., Vol. 41, 1501–1508, November 1993.
10. Ferrara, F., C. Gennarelli, G. Riccio, and C. Savarese, “Far field reconstruction from nonuniform plane-polar data: A SVD based approach,”Electromagnetics, Vol. 23, 417–429, July 2003.
11. Ferrara, F., C. Gennarelli, G. Riccio, and C. Savarese, “NF-FF transformation with cylindrical scanning from nonuniformly distributed data,” Microw. Optical Tech. Lett., Vol. 39, 4–8, October 2003.
12. Bucci, O. M., C. Gennarelli, G. Riccio, and C. Savarese, “Electromagnetic fields interpolation from nonuniform samples over spherical and cylindrical surfaces,” IEE Proc. Microw.
Antennas Propagat.,Vol. 141, 77–84, April 1994.
13. Bucci, O. M., C. Gennarelli, G. Riccio, C. Savarese, and V. Sper-anza, “Non redundant representation of the electromagnetic fields over a cylinder with application to the near-field-far-field trans-formation,” Electromagnetics,Vol.16, 273–290, May 1996.