Munich Personal RePEc Archive
Spatial dependence in museum services:
An analysis of the Italian case
Cellini, Roberto and Cuccia, Tiziana and Lisi, Domenico
University of Catania, Departemnt of Economics and Business
9 February 2019
Online at
https://mpra.ub.uni-muenchen.de/92093/
Spatial dependence in museum services:
An analysis of the Italian case
+Roberto Cellini,
§Tiziana Cuccia, Domenico Lisi
Department of Economics and Business, University of Catania
[email protected], [email protected], [email protected]
Abstract: In this paper we investigate whether the services offered by museums are affected by the choices of neighbors, and we discuss whether the evidence can document that competition processes are at work. Specifically, we take into account the Italian case, where governmental and private museums co-exist. Resorting to Spatial Autoregressive Models, we show that a significant influence of neighbors’ choice concerning service supply does emerge. However, we cast several doubts that this piece of evidence can be solely due to sound competition among museums.
JEL Classification: Z10, C21, L33, L83
Keywords: Museum; Services; Competition; Spatial dependence; Italy
CONFLICT OF INTEREST: No conflicts of interest exist.
+ Acknowledgements: The financial support from FIR 2017 (Catania University internal fund programme) is acknowledged. We thank Enrico Bertacchini, Gabriel Brida, Chiara Dalle Nogare, Calogero Guccio and Antonello Scorcu for helpful insights and comments. The responsibility remains on the Authors only.
Spatial dependence in museum services:
An analysis of the Italian case
1. Introduction
This paper aims to study whether the choice of a museum concerning the service provision is influenced by the choices of its neighbors; we also aim to understand which mechanisms underpin the neighborhood effects. The services under our investigation concern activities aimed to enlarge the accessibility (e.g., evening openings, upon-request openings, etc.), supporting activities to improve the collection fruition (e.g., the availability of brochures, the presence of audio-guides, the presence of guided tours, the provision of childcare activities, and so on), and the presence of web-services. We investigate whether the availability of such services in a museum is influenced by the availability of similar services in neighboring museums.
As it happens in the supply of other public services, like education and healthcare (e.g., Matlock et al., 2014; Guccio and Lisi, 2016; Longo et al., 2017), the reasons to expect that such a spatial influence in services’ provision does exist can be related to a number of factors: competition pressure, imitation mechanisms among the managers (peer effect), institutional rules leading museums to make similar choices.
In fact, museums are institutions that offer different services. In economic terms, museums can be assimilated to multi-product or multi-services firms whose production function includes collection, conservation, research and exhibition of statements of tangible and intangible cultural heritage (Fernandez-Blanco and Prieto-Rodriguez, 2011).
potential alternative sources of revenues, sometimes necessary to support the traditional “core-business” of museums, namely conservation, research and exhibitions.
Thus, it is reasonable to expect that competition among museums to attract visitors is played not only on the basis of the content of collections, but also on the services supplied in order to facilitate access and collection fruition. In this framework, it is interesting to evaluate whether the supply of services in a museum is affected by the neighbors’ choices.
We take Italy as the case-study. Italy is rich of museums: nearly 5 thousand sites, including museums, monuments, archeological areas can be listed; most of them are small in terms of visits while others can be considered as world-level superstars. In Italy, private museums coexist with governmental museums, and –within the group of governmental museums– different institutes are endowed with different degrees of autonomy. Like in other service sectors where the presence of public providers is common (let us think of the healthcare sector or the childcare or the education sector), a larger degree of autonomy has been thought as a tool to enhance competition among providers, and hence to promote the service quality. In the present investigation, concerning the museum sector, “quality” means visitors’ satisfaction through additional services, such as the possibility of avoiding queue, thanks to online reservation and ticket office, or the availability of children-oriented services, or tools to improve the comprehension and to enjoy the experience during the visit also thanks to innovative devices.
From the technical point of view, in order to evaluate whether neighborhood effects do operate in the case of museum service provision, we employ the SAR (Spatial Auto-Regressive) model. We consider a very large cross-section sample of museums, as observed in 2015, and we investigate whether a significant influence of the neighbors emerges, as far as the number and type of offered services are concerned. Needless to say, the number and nature of available services are investigated conditional on the type of museum, and other individual, institutional and environmental characteristics.
We document that neighborhood effects in general do emerge. However, their strength is not homogeneous across museum types. The auto-Poisson model and the auto-binomial model –that could be alternative and appropriate regression models, in front of the dependent count-variable– fully confirm the evidence from the simpler SAR specification. We will discuss whether the evidence can be solely due to sound competition among museums, or other reasons may be consistent with the emerging evidence.
museums do offer. Section 3 presents the data at hand and discusses the empirical specification of the model. Section 4 provides the results of the econometric investigations. Comments and conclusions are gathered in Section 5.
2. Institutional feature of museums and the case of Italy
The most widely recognized definition, reported in the Statutes of ICOM - the International Council of Museums, affirms that museum is a “permanent institution in the service of society and its development, open to the public, which acquires, conserves, researches, communicates and exhibits the tangible and intangible heritage of humanity and its environment for the purposes of education, study and enjoyment”; museums aim to increase human knowledge and preserve cultural heritage for present and future generations (ICOM, 2007).
The demand for goods and services provided by museums is both private and social (Frey and Meier, 2006). The private demand comes from individuals interested in visiting the collections for entertainment, enjoyment or cultural curiosity, or for research proposals in the case of professional people. The social demand comes from local communities and the whole society, as museums can contribute to preserve and to define the cultural identity of a community and the humankind history, but also to promote the regeneration of depressed urban areas, and to enhance the tourism attractiveness of an area.
These differences concerning museum characteristics and services have institutional relevance. The ownership of museum buildings and collections can be public or private; generally, they are (or have to be, according to the definition provided by ICOM) non-profit oriented institutions; governmental ownership and management prevail in the Latin European countries, while private non-profit institutions benefitting from private tax-exempted donations prevail in the Anglo-Saxon countries.1 In both the Latin and the Anglo-Saxon countries, private subjects (individuals or companies) are usually involved as donors or financiers for the maintenance of museum buildings and collections; a more direct involvement of private companies occurs for the supply of complementary services to support the visit: such complementary services can be outsourced to external private (profit-oriented) companies, also by part of governmental museums.
In Italy, the possibility for governmental museums to resort to outsourcing services has been introduced in the mid-1990s (the so-called Ronchey Law in 1993), along with the adoption of a series of administrative and legislative acts permitting the involvement of the private sector in the supply of museum services; subsequent major reforms, in 2009 and in 2014, have provided State museums with a larger degree of managerial and technical-scientific autonomy. The mentioned reforms have aimed to simplify administration and to attribute museum directors the management of both the conservation and the valorization of their collections. However, the reform process has gone on (and it is still going on) quite slowly and only a small sub-group of governmental museums (superstars museums, monuments and archaeological sites like Galleria degli Uffizi, Caserta Real Palace, and Pompei, respectively) have a large degree of autonomy. The management of the other governmental museums still depends on the public sector administrations. In general, consider that governmental museums in Italy are still largely driven by a legislative-bureaucratic approach, though the recent reforms aimed to enhance the autonomy and the managerial perspective of museum directors (Zan et al., 2018).
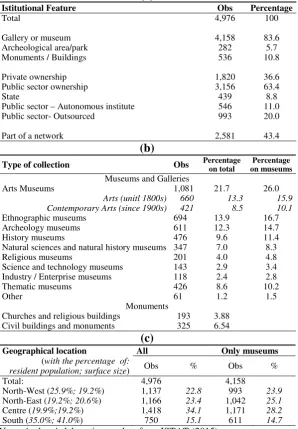
The picture of the universe of the museum institutions in Italy (as referred to 2015) is provided by Table 1. Museums are considered along similar cultural institutions, that is, archeological and historical parks and specific monuments and buildings. Data are provided by ISTAT, the Italian National Statistics Institute, and they are freely downloadable from the web (ISTAT, 2015).
1
Table 1 - Museums, monuments and archeological areas in Italy
(a)
Istitutional Feature Obs Percentage
Total 4,976 100
Gallery or museum 4,158 83.6 Archeological area/park 282 5.7 Monuments / Buildings 536 10.8
Private ownership 1,820 36.6
Public sector ownership 3,156 63.4
State 439 8.8
Public sector – Autonomous institute 546 11.0 Public sector- Outsourced 993 20.0
Part of a network 2,581 43.4
(b)
Type of collection Obs Percentage on total on museums Percentage
Museums and Galleries
Arts Museums 1,081 21.7 26.0 Arts (unitl 1800s) 660 13.3 15.9 Contemporary Arts (since 1900s) 421 8.5 10.1 Ethnographic museums 694 13.9 16.7 Archeology museums 611 12.3 14.7 History museums 476 9.6 11.4 Natural sciences and natural history museums 347 7.0 8.3 Religious museums 201 4.0 4.8 Science and technology museums 143 2.9 3.4 Industry / Enterprise museums 118 2.4 2.8 Thematic museums 426 8.6 10.2
Other 61 1.2 1.5
Monuments
Churches and religious buildings 193 3.88 Civil buildings and monuments 325 6.54
(c)
Geographical location All Only museums
(with the percentage of:
resident population; surface size) Obs % Obs %
Total: 4,976 4,158
North-West (25.9%; 19.2%) 1,137 22.8 993 23.9 North-East (19.2%; 20.6%) 1,166 23.4 1,042 25.1 Centre (19.9%;19.2%) 1,418 34.1 1,171 28.2 South (35.0%; 41.0%) 750 15.1 611 14.7
Note: Authors' elaboration on data from ISTAT (2015).
About 5,000 museums and similar institutions are operative in Italy. The ownership of these cultural institutions is mostly governmental (63.4%) – at the level of State, Regions, local public administrations (provinces and municipalities), public school and universities.2 The main part is represented by gallery or museum (84%) and, particularly, within museums, arts museums (26%), ethnographic museums (16.7%) and archeology museums (14.7%) – see Panels (a) and (b) of Table 1. Panel (c) provides information about the geographical
2
distribution of museums; museums are present in all regions, but the density (as related to resident population or surface size) is higher in Northern-Central regions and lower in Southern regions.
In this very articulated and fragmented institutional framework, competition in the museum sector may assume different meanings. Competition can be among policy-makers that consider the museums’ endowment and the establishment of new museums as tourism attractors; valorization and accessibility policies to larger audiences should be main goals for policy-makers. Competition can be also among (private and governmental) museum directors, concerning their ability in attracting visitors, but also concerning their scientific reputation among peers, based on activities concerning conservation, research projects, academic publications and exhibitions for niche audiences. Finally, competition can be among private enterprises to gain the grant for supplying the museum supporting services.
Clearly, the role played by museum services could be different according to the type of museum, the type of art collection and the consequent different degree of interactive fruition (let us think of fine arts museums versus science and technology museums).
The idea of the present investigation is to assess whether neighborhood effects do operate in the provision of museum services, and then to evaluate whether such effects can be related to the different levels of competition among museums. To this end, we take into account information concerning the specific services offered by the museums, as reported by the most recent ISTAT research.
3. Data and empirical research strategy
3.1 Data description
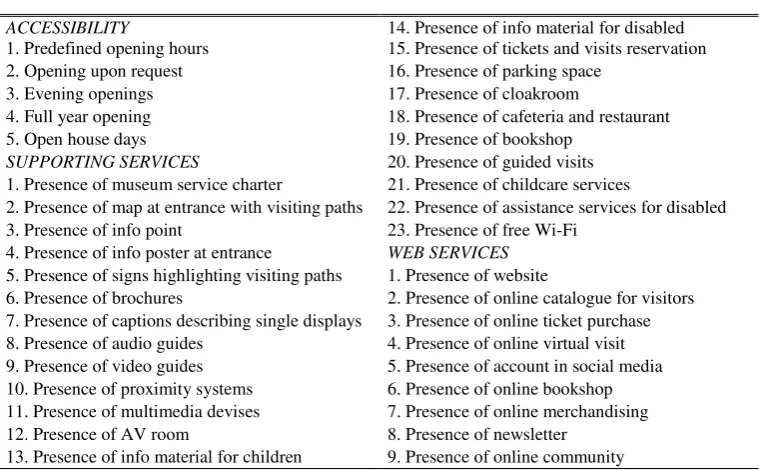
The dependent variable in our analysis is the total number of services (N_TOT_SERV) provided by museums and other similar institutions. As already mentioned, the census includes information on services related to the museum accessibility (N_SERV_ACCESS), services supporting visitors’ experience (N_SUPPORT_SERV), and the presence of web services (N_WEB_SERV) which increase museum visibility. Overall, a total of 37 services have been selected from the survey, 5 related to the museum accessibility, 23 to supporting services, and 9 to web services. Table 2 reports the detailed list of the services included in our analysis. Admittedly, in our present study on official data, we can simply observe the presence of these services, aimed to support accessibility and to enrich the visit experience; nothing can be said on how they really work, and their effectiveness in increasing the visitor enjoyment.
Table 2 - Museum services
ACCESSIBILITY 14. Presence of info material for disabled 1. Predefined opening hours 15. Presence of tickets and visits reservation 2. Opening upon request 16. Presence of parking space
3. Evening openings 17. Presence of cloakroom
4. Full year opening 18. Presence of cafeteria and restaurant 5. Open house days 19. Presence of bookshop
SUPPORTING SERVICES 20. Presence of guided visits 1. Presence of museum service charter 21. Presence of childcare services
2. Presence of map at entrance with visiting paths 22. Presence of assistance services for disabled 3. Presence of info point 23. Presence of free Wi-Fi
4. Presence of info poster at entrance WEB SERVICES 5. Presence of signs highlighting visiting paths 1. Presence of website
6. Presence of brochures 2. Presence of online catalogue for visitors 7. Presence of captions describing single displays 3. Presence of online ticket purchase 8. Presence of audio guides 4. Presence of online virtual visit 9. Presence of video guides 5. Presence of account in social media 10. Presence of proximity systems 6. Presence of online bookshop 11. Presence of multimedia devises 7. Presence of online merchandising 12. Presence of AV room 8. Presence of newsletter
13. Presence of info material for children 9. Presence of online community
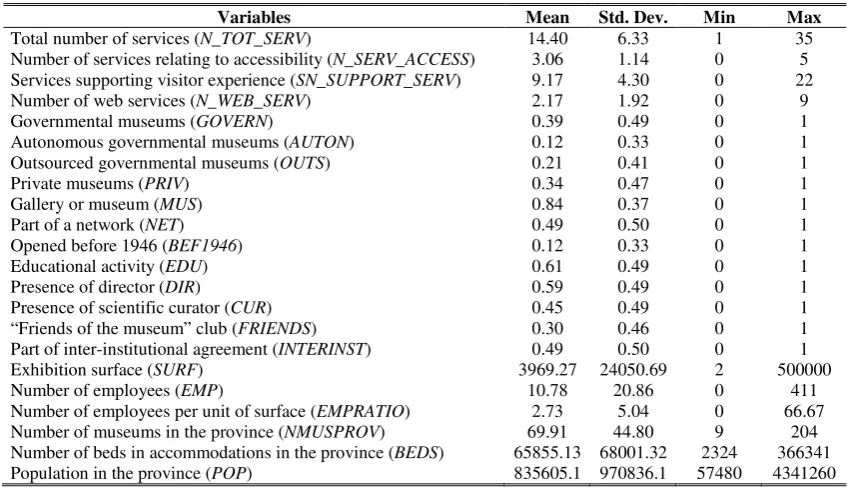
Table 3 - Descriptive statistics of the variables
Variables Mean Std. Dev. Min Max
Total number of services (N_TOT_SERV) 14.40 6.33 1 35 Number of services relating to accessibility (N_SERV_ACCESS) 3.06 1.14 0 5 Services supporting visitor experience (SN_SUPPORT_SERV) 9.17 4.30 0 22 Number of web services (N_WEB_SERV) 2.17 1.92 0 9 Governmental museums (GOVERN) 0.39 0.49 0 1 Autonomous governmental museums (AUTON) 0.12 0.33 0 1 Outsourced governmental museums (OUTS) 0.21 0.41 0 1
Private museums (PRIV) 0.34 0.47 0 1
Gallery or museum (MUS) 0.84 0.37 0 1
Part of a network (NET) 0.49 0.50 0 1
Opened before 1946 (BEF1946) 0.12 0.33 0 1 Educational activity (EDU) 0.61 0.49 0 1 Presence of director (DIR) 0.59 0.49 0 1 Presence of scientific curator (CUR) 0.45 0.49 0 1 “Friends of the museum” club (FRIENDS) 0.30 0.46 0 1 Part of inter-institutional agreement (INTERINST) 0.49 0.50 0 1 Exhibition surface (SURF) 3969.27 24050.69 2 500000 Number of employees (EMP) 10.78 20.86 0 411 Number of employees per unit of surface (EMPRATIO) 2.73 5.04 0 66.67 Number of museums in the province (NMUSPROV) 69.91 44.80 9 204 Number of beds in accommodations in the province (BEDS) 65855.13 68001.32 2324 366341 Population in the province (POP) 835605.1 970836.1 57480 4341260
Note: The table presents the descriptive statistics of the variables employed in the following empirical analysis. The sample is made of 2,165 observations.
The first group of regressors in our estimates concerns the ownership type and the organizational structure of museums (e.g., Bertacchini et al., 2018). Governmental museums (GOVERN) are museums owned and managed by the State or by other public (regional and local) public administrations, while private museums (PRIV) are owned by the private sector. Among the governmental museums, autonomous museums (AUTON) have their own budget and, thus, a certain degree of independence from the government; instead, outsourced museums (OUTS) are still owned by governments but their management is contracted out to an external contractor. In our dataset, 12% and 21% are autonomous museums and outsourced museums, respectively.
In our regression analysis, we also control for several characteristics of the museums and other similar institutes under scrutiny: MUS is a dummy variable equal to 1 if the subject is a “gallery or museum”, which represent the 84% of our sample (the remaining observations are monuments, buildings or archeological sites and parks); NET is a dummy variable equal to 1 if the institute is part of a network (49%), while BEF1946 is equal to 1 if it has opened before 1946 (12%). DIR and CUR are dummy variables equal to 1 if the institute has a specific director (59%) and a scientific curator (45%), respectively. FRIENDS and
to 1 if the institute organizes also educational activities (61%). Again, among the structural characteristics which we control for, SURF is the (log of) exhibition surface of the museum, which controls (at least in part) for the extent of the museum collection; EMP is the number of employees in the museum, which controls for the museum dimension (we also consider the number of employees per unit of surface, EMPRATIO, to control for potential nonlinearities in the production function of museums).
Moreover, we control for some characteristics of the environment where the museum is located. NMUSPROV is the total number of museums (also those not included in the final sample) in the same province, which controls for the extent of the potential competitive pressure in the local area. On average –though with a very large variability– there are about 70 cultural institutions in each Italian province. Then, we include the (log of) number of beds in accommodation (BEDS) and the (log of) population (POP) in the province; both variables are provided by ISTAT, and they are included to control for the potential demand (from both residents and tourists).3
3.2 Empirical research strategy
Our empirical strategy aims to evaluate the presence of spatial dependence in the number of services provided by museums. Our baseline regression model is the Spatial Auto-Regressive (SAR) model (e.g., Anselin, 1988):
(1)
where is the number of services (N_TOT_SERV) provided by museum i, is a vector of
the abovementioned control variables at the museum level, is a vector of the control
variables at the province level, and is a normally distributed error term .
is the term capturing the spatial lag of the number of services provided by museums, and it is shaped by the neighborhood effect implicitly assumed by the spatial weights matrix . The
element of the spatial matrix indicates the potential interaction effect between unit i
and j, and the strength of the spatial effect is given by the unknown spatial parameter that
3
needs to be estimated. The estimation of parameters of model (1), namely, , , , , , can
be carried out by maximum likelihood (e.g., Le Sage and Pace, 2009).
In our empirical application, the row-standardized spatial weights matrix in model
(1) is as follows:
(2)
where is the region where museum i is located and indicates the total number of
museums (in our final sample) located in region . According to (2), the spatial lag is the
average number of services provided by the other (with respect to i) museums in the same region. Then, we also consider the same spatial weights matrix at the province level:
(3)
where is the province where museum i is located and is the total number of museums (in
our final sample) located in province p. Therefore, the spatial lag in (3) is the average number of services provided by the other museums in the same province.
A potential limitation of model (1) is that our dependent variable yi is a count variable
(as it provides the number of services offered by museums), while the standard SAR model is more appropriate when dealing with continuous variables. Indeed, previous literature has shown that a count random variable can be well approximated by a normal random variable when the expected count is sufficiently large (such as, greater than 10), as the frequency distribution resembles a normal frequency distribution (e.g., Griffith, 2006). As can be seen in Table 3, the mean number of services in our sample is 14; therefore, the specification of the SAR model could be appropriate in our empirical application.
Nonetheless, to test the robustness of our results, we also estimate the auto-Poisson model (e.g., Besag, 1974), where the spatially lagged dependent variable is included in the intensity equation and the dependent variable conditional on its neighbors follows a
Poisson distribution, that is with
The auto-Poisson model appears to be the most intuitive way to introduce the SAR-like spatial structure in count-data modeling, and it has been used in a few applications dealing with count random variables (e.g., Mears and Bhati, 2006; Andersson et al., 2009). However, the auto-Poisson model suffers from the limitation that, with positive spatial autocorrelation (i.e., ), the spatially lagged dependent variable into the exponential function might cause
the process to be explosive (e.g., Besag, 1974; Cressie, 1993). As a result, it is usually stated that the auto-Poisson model can accommodate only negative spatial autocorrelation, which makes it of limited use (e.g., Besag, 1974; Cressie, 1993).
To overcome the limitation of the auto-Poisson model, a suggested route is to estimate the following auto-binomial model (e.g., Besag, 1974; Griffith, 2006):
(5)
where N is the upper limit of the count random variable, in our case 37 museum services. The auto-binomial specification for count-data exploits the fact that a Poisson random variable can be approximated by a binomial random variable, and entails the important advantage that it can fully accommodate positive spatial autocorrelation (e.g., Kaiser and Cressie, 1997; Griffith, 2006). The parameters of the auto-binomial model (5) can be consistently estimated by pseudo-likelihood estimation of the binomial model which includes the count autoregressive component as a covariate (e.g., Besag, 1974; Griffith, 2006).
Therefore, to test further the robustness of our results, in the following we provide estimates for the three empirical specifications (i.e., SAR, auto-Poisson, auto-binomial) using both spatial weights matrixes (2) and (3). It is worth noticing that the (marginal effect associated to the) spatial parameter ρ of the auto-binomial specification captures the dependence of the proportion of counts (over the upper limit) upon the neighbors’ counts, and has to be interpreted accordingly when compared to the estimates of the SAR and auto-Poisson model.
4. Results
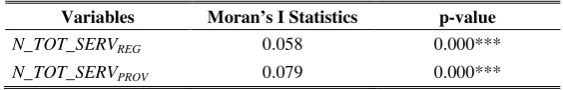
considering the regional or provincial spatial weight matrixes. This means that significant spatial dependence in data is present, both if the regional level is considered, and in the case of the provincial level.
Table 4 - Moran's I Tests
Variables Moran’s I Statistics p-value
N_TOT_SERVREG 0.058 0.000***
N_TOT_SERVPROV 0.079 0.000***
Table 5 reports the results from the SAR model; columns 1 to 3 (4 to 6) refer to spatial weights matrix at the regional (provincial) level. In the first specification (i.e., column 1 and 4) we include only the ownership and the organizational variables as covariates. In the second specification (i.e., column 2 and 5) we also consider other regressors at the museum level as covariates. Finally, the third specification (i.e., column 3 and 6) includes control variables at the province level. We find a positive and significant spatial dependence in the number of services provided by museums (SPATIAL LAGGED Y), even after controlling for our full set of covariates. The positive spatial dependence comes out with both spatial weights matrixes, though it is always higher when using spatial matrix at the regional level. More specifically, estimates in Table 5 suggest that a marginal increase in the average number of services provided by museums in a region is, ceteris paribus, associated with a significant increase of about 0.2-0.6 (according to specification) in the expected number of services offered by a single museum located in that region.
Table 5 - Number oftotal services offered: SAR models
(1)_ (2)_ (3)_ (4)_ (5)_ (6)_
SAR SAR SAR SAR SAR SAR
SPATIAL LAGGED YREG 0.602 0.298 0.312
(0.057)*** (0.055)*** (0.056)***
SPATIAL LAGGED YPROV 0.357 0.203 0.221
(0.042)*** (0.037)*** (0.039)*** AUTON 4.365 2.063 2.072 4.412 2.079 2.082
(0.401)*** (0.333)*** (0.333)*** (0.402)*** (0.334)*** (0.334)*** OUTS 0.776 1.575 1.512 0.912 1.618 1.541
(0.331)** (0.269)*** (0.271)*** (0.329)*** (0.267)*** (0.269)*** PRIV 0.015 0.808 0.806 0.048 0.827 0.826
(0.306)_ (0.228)*** (0.228)*** (0.306)_ (0.227)*** (0.228)***
MUS 2.911 2.925 2.956 2.975
(0.290)*** (0.290)*** (0.290)*** (0.291)***
NET 1.010 0.974 1.042 1.009
(0.207)*** (0.208)*** (0.208)*** (0.208)*** BEF 1946 -0.018 -0.039 0.010 0.034
(0.312)_ (0.313)_ (0.313)_ (0.312)_
EDU 3.593 3.605 3.627 3.628
(0.227)*** (0.227)*** (0.228)*** (0.228)***
DIR 1.425 1.469 1.472 1.504
(0.232)*** (0.235)*** (0.233)*** (0.235)***
CUR 1.619 1.617 1.598 1.591
(0.221)*** (0.222)*** (0.222)*** (0.222)*** FRIENDS -0.057 -0.036 -0.025 -0.031
(0.221)_ (0.221)_ (0.221)_ (0.222)_
INTERINST 1.479 1.488 1.530 1.528 (0.209)*** (0.209)*** (0.210)*** (0.210)***
SURF 0.970 0.979 0.973 0.968
(0.082)*** (0.083)*** (0.082)*** (0.083)***
EMP 0.041 0.041 0.039 0.040
(0.005)*** (0.006)*** (0.005)*** (0.006)*** EMP RATIO -0.013 -0.013 -0.012 -0.012
(0.023)_ (0.023)_ (0.023)_ (0.023)_
MUS IN PROV 0.008 0.012
(0.003)** (0.007)*
BEDS -0.099 -0.096
(0.129)_ (0.128)_
POP -0.211 -0.267
(0.169)_ (0.166)_
CONSTANT 5.022 -4.302 -0.208 8.504 -3.023 2.015 (0.809)*** (0.934)*** (2.236)_ (0.609)*** (0.775)*** (2.202)_
Observations 2165 2165 2165 2165 2165 2165 Log pseudolikelihood -6952.74 -6337.34 -6334.23 -6960.09 -6336.31 -6332.81 AIC 13917.47 12708.68 12708.47 13932.19 12706.60 12705.61 Note: Robust standard errors in brackets. * significant at 10%, ** significant at 5%, *** significant at 1%.
both professional profiles are more likely to be present in bigger museums.4 In this respect, we find evidence that, not surprisingly, museums with a larger exhibition surface (SURF) and more employees (EMP) provide a larger number of services. Instead, we do not find significant evidence for the number of employees per unit of surface (EMPRATIO); this piece of evidence –apart from considerations concerning the efficient use of inputs and their productivity– simply leads to the observation that the personnel is not used to improve the number of supplied services.
Finally, the explanatory power of the environmental factors at the province level is rather weak. This is also clearly indicated by model information criteria (i.e., Log-pseudo-likelihood and the Akaike Information Criterion) which suggest that no much improvement in the model explanatory power is gained once these controls are inserted in the equation specification. Only the number of museums in the same province (NMUSPROV) turns out to be positive and significant (at least at the 10% level), while the number of beds in the accommodation sector (BEDS) as well as the population (POP) in the province always display not-significant effects. This seems to suggest that the museums’ behavior in terms of services provided is not strongly influenced by the competitive pressure deriving from tourist inflow or resident population.
This latter result is also relevant for the interpretation of the spatial dependence we find in the estimates. Specifically, it may suggest that the spatial dependence in the number of services provided by museums could not be due to strategic interdependence induced by competition to attract more visitors, but it could be due to other reasons, that is, reputational concerns and/or common institutional factors.
As said above, though the pretty high number of total services under consideration (i.e., 37), and its mean value (around 14), could support the SAR model as an appropriate modeling choice, it is advisable to check for the result correctness, by resorting to alternative regression models, in front of the fact that the regressand variable is a count variable.
Table 6 reports the results from the auto-Poisson model, with the same six specifications as in Table 5. We still find a positive and significant spatial dependence in the number of services provided by museums; again, spatial dependence is always higher if using spatial weights matrix at the regional level. However, the spatial dependence which comes out
4
from the auto-Poisson model is slightly higher as compared to the outcome from the SAR model.
Table 6 - Number oftotal services offered: SAR models – Auto-Poisson models
(1)_ (2)_ (3)_ (4)_ (5)_ (6)_
POISSON POISSON POISSON POISSON POISSON POISSON SPATIAL LAGGED YREG 0.062 [0.892] 0.032 [0.462] 0.032 [0.466]
(0.006)*** (0.005)*** (0.005)***
SPATIAL LAGGED YPROV 0.041 [0.583] 0.022 [0.310] 0.023 [0.331]
(0.004)*** (0.003)*** (0.003)*** AUTON 0.266 0.118 0.119 0.269 0.121 0.121
(0.023)*** (0.019)*** (0.019)*** (0.023)*** (0.019)*** (0.019)*** OUTS 0.042 0.107 0.105 0.053 0.110 0.106
(0.021)** (0.017)*** (0.018)*** (0.022)** (0.018)*** (0.018)*** PRIV -0.002 0.056 0.057 0.001 0.058 0.059
(0.022)_ (0.016)*** (0.017)*** (0.022)_ (0.017)*** (0.017)***
MUS 0.200 0.201 0.202 0.204
(0.022)*** (0.023)*** (0.023)*** (0.023)***
NET 0.070 0.068 0.075 0.072
(0.014)*** (0.014)*** (0.014)*** (0.014)***
BEF 1946 -0.006 -0.007 -0.008 -0.007
(0.021)_ (0.022)_ (0.022)_ (0.022)_
EDU 0.277 0.278 0.279 0.280
(0.017)*** (0.018)*** (0.018)*** (0.018)***
DIR 0.117 0.119 0.115 0.119
(0.016)*** (0.017)*** (0.017)*** (0.017)***
CUR 0.112 0.112 0.111 0.112
(0.015)*** (0.015)*** (0.015)*** (0.015)***
FRIENDS -0.001 -0.001 -0.003 -0.001
(0.015)_ (0.015)_ (0.015)_ (0.015)_
INTERINST 0.104 0.105 0.107 0.107
(0.014)*** (0.014)*** (0.014)*** (0.014)***
SURF 0.070 0.070 0.069 0.070
(0.006)*** (0.006)*** (0.006)*** (0.006)***
EMP 0.002 0.002 0.002 0.002
(0.000)*** (0.000)*** (0.000)*** (0.000)***
EMP RATIO 0.001 0.001 0.001 0.001
(0.002)_ (0.002)_ (0.002)_ (0.002)_
MUS IN PROV 0.001 0.001
(0.000)* (0.000)*
BEDS -0.008 -0.006
(0.009)_ (0.009)_
POP -0.012 -0.012
(0.011)_ (0.012)_
CONSTANT 1.723 1.104 1.314 2.029 1.254 1.565 (0.094)*** (0.087)*** (0.168)*** (0.063)*** (0.066)*** (0.153)***
Observations 2165 2165 2165 2165 2165 2165
Log pseudolikelihood -7580.55 -6397.04 -6341.12 -7588.06 -6396.79 -6393.20 AIC 15171.10 12826.10 12722.24 15186.13 12825.58 12824.41 Note: Robust standard errors in round brackets, marginal effects (at means) in square brackets. * significant at 10%, ** significant at 5%, *** significant at 1%.
model. In particular, estimates of the environmental factors at the province level still confirm that their role in explaining museums’ behavior in the number of services provided is limited.
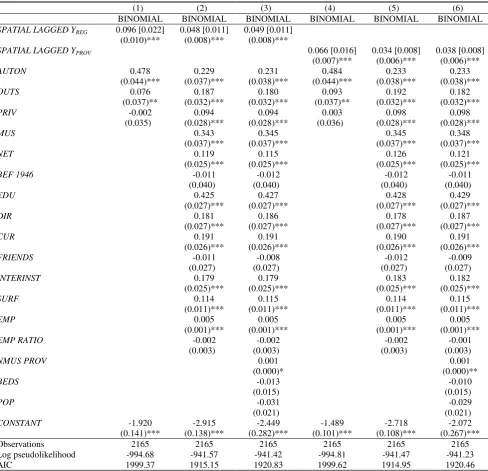
[image:18.595.77.566.187.658.2]Finally, Table 7 reports the results from the auto-binomial model which –as discussed in Section 3– overcomes the limitation of the auto-Poisson model.
Table 7 - Number oftotal services offered: SAR models – Auto-binomial models
(1)_ (2)_ (3)_ (4)_ (5)_ (6)_
BINOMIAL BINOMIAL BINOMIAL BINOMIAL BINOMIAL BINOMIAL SPATIAL LAGGED YREG 0.096 [0.022] 0.048 [0.011] 0.049 [0.011]
(0.010)*** (0.008)*** (0.008)***
SPATIAL LAGGED YPROV 0.066 [0.016] 0.034 [0.008] 0.038 [0.008]
(0.007)*** (0.006)*** (0.006)*** AUTON 0.478 0.229 0.231 0.484 0.233 0.233
(0.044)*** (0.037)*** (0.038)*** (0.044)*** (0.038)*** (0.038)*** OUTS 0.076 0.187 0.180 0.093 0.192 0.182
(0.037)** (0.032)*** (0.032)*** (0.037)** (0.032)*** (0.032)*** PRIV -0.002 0.094 0.094 0.003 0.098 0.098
(0.035)_ (0.028)*** (0.028)*** (0.036)_ (0.028)*** (0.028)***
MUS 0.343 0.345 0.345 0.348
(0.037)*** (0.037)*** (0.037)*** (0.037)***
NET 0.119 0.115 0.126 0.121
(0.025)*** (0.025)*** (0.025)*** (0.025)***
BEF 1946 -0.011 -0.012 -0.012 -0.011
(0.040)_ (0.040)_ (0.040)_ (0.040)_
EDU 0.425 0.427 0.428 0.429
(0.027)*** (0.027)*** (0.027)*** (0.027)***
DIR 0.181 0.186 0.178 0.187
(0.027)*** (0.027)*** (0.027)*** (0.027)***
CUR 0.191 0.191 0.190 0.191
(0.026)*** (0.026)*** (0.026)*** (0.026)***
FRIENDS -0.011 -0.008 -0.012 -0.009
(0.027)_ (0.027)_ (0.027)_ (0.027)_
INTERINST 0.179 0.179 0.183 0.182
(0.025)*** (0.025)*** (0.025)*** (0.025)***
SURF 0.114 0.115 0.114 0.115
(0.011)*** (0.011)*** (0.011)*** (0.011)***
EMP 0.005 0.005 0.005 0.005
(0.001)*** (0.001)*** (0.001)*** (0.001)*** EMP RATIO -0.002 -0.002 -0.002 -0.001
(0.003)_ (0.003)_ (0.003)_ (0.003)_
NMUS PROV 0.001 0.001
(0.000)* (0.000)**
BEDS -0.013 -0.010
(0.015)_ (0.015)_
POP -0.031 -0.029
(0.021)_ (0.021)_
CONSTANT -1.920 -2.915 -2.449 -1.489 -2.718 -2.072 (0.141)*** (0.138)*** (0.282)*** (0.101)*** (0.108)*** (0.267)***
Observations 2165 2165 2165 2165 2165 2165
Log pseudolikelihood -994.68 -941.57 -941.42 -994.81 -941.47 -941.23 AIC 1999.37 1915.15 1920.83 1999.62 1914.95 1920.46 Robust standard errors in round brackets, marginal effects (at means) in square brackets. * significant at 10%, ** significant at 5%, *** significant at 1%.
increase in the average number of services in a region is, ceteris paribus, associated with an increase of about 0.008-0.022 in the proportion of services over the total of 37, corresponding to an increase of about 0.3-0.8 in the number of services. Overall, the results from the auto-binomial model are fully in line with those from the auto-Poisson and the SAR models.
4.2 Public and private museums
In this section, we wonder whether the spatial dependence in museums’ behavior differs among public (that is, governmental) and private museums. This point is interesting per se, but, more importantly, it may provide further insights on the source of spatial dependence in museum services. In fact, if the spatial dependence is due to strategic interdependence induced by competition to attract more visitors, one would expect it is stronger (or, at least, not weaker) in private museums where competition should be fiercer and rules less strict than in the public sector; on the other hand, if the spatial dependence is due to reputational concerns and/or common institutional factors, one would expect it is stronger in public museums where reputational concerns should be more salient and institutional factors more stringent.
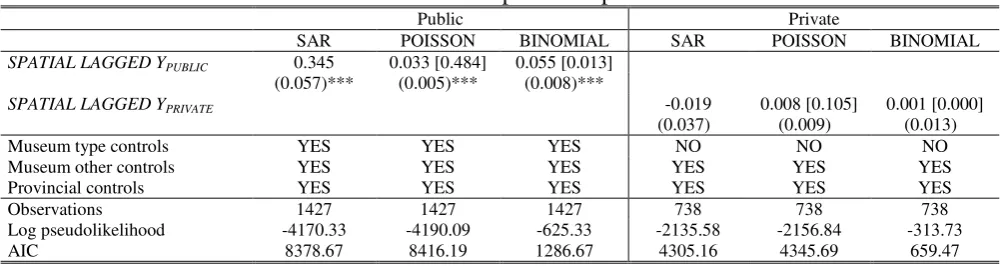
Table 8 reports the results from our three models (i.e. SAR, Poisson, auto-binomial) on the subsamples of public (columns 1 to 3) and private (columns 4 to 6) museums, and each estimate refers to the full specification (i.e., with the inclusion of all the regressors under consideration).5 Notice also that, as the use of subsamples reduces the number of neighbors for each museum, the spatial weights matrix at the provincial level turns out to be overmuch sparse; hence, all estimation exercises in Table 8 use spatial weight matrix at the regional level.
We find striking evidence of no spatial dependence in private museums, regardless of the model employed; on the contrary, estimates for public museums display positive and significant spatial dependence in all considered models. This is a core result in our present investigation: neighborhood effects hold for public, not for private, museum institutions. This outcome drives us to believe that the spatial dependence in museum service provision is due to reputational concerns and/or common institutional factors, rather than the pressure from competition.
5
Table 8 - Offered services: public vs. private museums
Public Private
SAR POISSON BINOMIAL SAR POISSON BINOMIAL
SPATIAL LAGGED YPUBLIC 0.345 0.033 [0.484] 0.055 [0.013]
(0.057)*** (0.005)*** (0.008)***
SPATIAL LAGGED YPRIVATE -0.019 0.008 [0.105] 0.001 [0.000]
(0.037)_ (0.009)_ (0.013)_
Museum type controls YES YES YES NO NO NO
Museum other controls YES YES YES YES YES YES
Provincial controls YES YES YES YES YES YES
Observations 1427 1427 1427 738 738 738
Log pseudolikelihood -4170.33 -4190.09 -625.33 -2135.58 -2156.84 -313.73 AIC 8378.67 8416.19 1286.67 4305.16 4345.69 659.47 Robust standard errors in round brackets, marginal effects (at means) in square brackets. * significant at 10%, ** significant at 5%, *** significant at 1%.
4.3 Categories of services
Finally, we investigate whether the spatial dependence differs among the three categories of museum services under consideration, namely, accessibility, supporting services, and web services. In principle, the underlying reasons which may induce spatial dependence, could be more or less relevant for the museums’ behavior in the three categories of services. For instance, accessibility services and supporting services are particularly important for competition in attracting visitors; web services are particularly important for the visibility of museums and for the valorization of the scientific content of the exhibitions, so they are relevant for the scientific competition among peers (museum directors) based on scientific research and reputation, publications and special exhibitions. However, common institutional factors might be more binding for the museums’ behavior related to the accessibility, and museum managers (in governmental museum without autonomy) cannot compete in this type of service.
Table 9 reports the results obtained by using the number of services related to (a) the museum accessibility (N_SERV_ACCESS), (b) services supporting visitors’ experience (N_SUPPORT_SERV), and (c) web services (N_WEB_SERV), as the dependent variable, respectively.6 For each service category, we provide the estimates from the three models under current consideration (i.e., SAR, auto-Poisson, auto-binomial), for the two sub-samples of public and private museums, again using the spatial weight matrix at the regional level. Overall, the results for the three categories of services do not significantly differ from those obtained when considering the total number of services, in terms of both the presence (significance) and the magnitude of the spatial dependence effects. For governmental
6
museums, all models provide spatial autocorrelation coefficients included in the interval (0.35, 0.55) in terms of marginal effect upon the number of offered services, for all the types of services under consideration.7 However, supporting services show a more limited spatial dependence, as compared to web and accessibility services.
Table 9 - Provision of specific services - Public vs. private museums
Public Private
SAR POISSON BINOMIAL SAR POISSON BINOMIAL
Accessibility; dependent variable: N_SERV_ACCESS SPATIAL LAGGED YPUBLIC 0.384 0.163 [0.521] 0.457 [0.101]
(0.082)*** (0.033)*** (0.090)***
SPATIAL LAGGED YPRIVATE 0.061 0.077 [0.215] 0.080 [0.018]
(0.119)_ (0.062)_ (0.129)_
Museum type controls YES YES YES NO NO NO
Museum other controls YES YES YES YES YES YES
Provincial controls YES YES YES YES YES YES
Observations 1427 1427 1427 738 738 738
Log pseudolikelihood -1999.82 -2367.69 -647.94 -1032.94 -1182.81 -345.42 AIC 4037.66 4771.39 1331.87 2099.88 2397.63 722.85
Supporting services; Dependent variable: N_SUPPORT_SERV SPATIAL LAGGED YPUBLIC 0.353 0.048 [0.459] 0.084 [0.019]
(0.071)*** (0.010)*** (0.016)***
SPATIAL LAGGED YPRIVATE -0.111 0.008 [0.067] 0.008 [0.002]
(0.094)_ (0.015)_ (0.023)_
Museum type controls YES YES YES NO NO NO
Museum other controls YES YES YES YES YES YES
Provincial controls YES YES YES YES YES YES
Observations 1427 1427 1427 738 738 738
Log pseudolikelihood -3704.13 -3710.89 -635.09 -1892.54 -1899.01 -318.48 AIC 7446.26 7457.79 1306.19 3819.08 3830.01 668.95
Web services; Dependent variable: N_WEB_SERV SPATIAL LAGGED YPUBLIC 0.368 0.261 [0.552] 0.351 [0.058]
(0.072)*** (0.046)*** (0.063)***
SPATIAL LAGGED YPRIVATE -0.110 0.020 [0.046] 0.001 [0.000]
(0.105)_ (0.059)_ (0.083)_
Museum type controls YES YES YES NO NO NO
Museum other controls YES YES YES YES YES YES
Provincial controls YES YES YES YES YES YES
Observations 1427 1427 1427 738 738 738
Log pseudolikelihood -2655.52 -2436.41 -528.19 -1341.34 -1258.71 -274.59 AIC 5349.04 4908.81 1092.39 2716.68 2549.43 581.19 Robust standard errors in round brackets, marginal effects (at means) in square brackets. * significant at 10%, ** significant at 5%, *** significant at 1%.
7
5. Discussion and final remarks
The main novelty of the present analysis rests in showing that spatial dependence –that is, a neighborhood effect– is relevant in museum services’ provision; however, the neighborhood effect is statistically significant for governmental museums and other similar cultural institutes, while it is not significant for private museums. The neighborhood effect, as captured by a statistically significant spatial autocorrelation coefficient, means that the number of services offered by a museum is influenced by the average number of services offered by the museums located in the same region or province.
We are interested in discussing whether the spatial dependence can be interpreted as a result of competition among museums. The evidence that spatial dependence holds for public, but not for private, museums, casts some doubts on the fact that neighborhood effects are motivated by true competition.
The institutional context in which public museums operate might suggest that spatial dependence is due to reputational concerns and/or common institutional factors, rather than sound competition. Some further elements could support this view.
In Italy, a conservative approach to the cultural heritage and museums’ collections still prevails; several rules for governmental museums are set at the central level, and several management decisions are taken by regional administrative bodies. The process towards the administrative and accounting autonomy of museums and archaeological sites has started later than in other European countries and appears to have been a stop-and-go process where administrative reforms to grant autonomy have been followed by legislative acts substantially dismantling the previous ones. Today, as a matter of fact, only a limited number of (outstanding) museums and sites benefit from a large degree of autonomy, while ‘autonomy’ in several cases concerns a limited set of financial and managerial choices: the comprehensive reform in 2014 has provided large financial and managerial autonomy only to the thirty most famous museums and archaeological sites; all other museums and cultural sites are directly or indirectly (if there is a director) managed by “regional museum hubs” and do not benefit from any real financial autonomy (Zan et al. 2018, p. 539). The autonomy of museums does not involve in any case the human resource management and, in a large part, the terms of accessibility (i.e. working hours, opening hours, etc.). Incentives and financing schemes8 of cultural sites do not promote the valorization really: the entrance fees go back to the central government; only autonomous museums and archaeological sites can keep (totally or
8
partially, according to the cases) their entrance fees for internal restoration and/or valorization programs. The financing schemes for museums and other cultural sites, designed by the public agency, are based on redistributive goals and the public agent totally or partially withdraws the revenues from the entrance fees to benefit and preserve the less known cultural heritage. This goal could be reasonable and well-founded; however, it is far from designing a scheme able to induce real competition among public museums; some incentive mechanisms can be introduced without losing this final meritorious goal.
Moreover, at present, the largest part of public administrators involved in the conservation and valorization of cultural goods, as well as public museums’ and archaeological sites’ directors, have a strictly legal and humanities formation background, and lack managerial skills. They usually believe that competition on scientific reputation (on scientific activities and publications) is more important than competition in attracting visitors.
Thus, the institutional framework drives managers to be more concerned with the conservation than the economic valorization of cultural heritage.
However, the more and more stringent public budget constraints, and the need to fill the gap with the different concepts of museums that are spreading in the world, have encouraged public administrators and public museum directors to allow the entrance of private enterprises to supply supporting and web services. Since 1993, when the Ronchey Law came into force, private firms have applied for granting the supply of supporting, web and, sometimes, accessibility services in governmental museums. Bertacchini et al (2018) not surprisingly find that the availability of such complementary services is larger in governmental museums that resort to outsource for providing such services: governmental museums with financial autonomy and outsourced services outperform public museums directly or indirectly run by the different layers of government.
However, private firms that provide such services have to serve a large number of museums and cultural institutions, in order to exploit economies of scale and to make the business of complementary service supply profitable.
Thus, spatial dependence in the provision of complementary services by part of public museums can be generated by the fact that the same set of services is offered by the same
public museum with outsourced complementary services has been extended for more than the four years initially established by the law, and, since 2009, the grants have been always attributed to the same private providers (Corte dei Conti, 2017); in other words, several doubts exist about the competitive nature of the market for museum service provision. New races should be implemented by the public sector to guarantee competition in the supply of complementary services for governmental museums, and the outsourcing schemes should be re-negotiated as far as the responsibility for the quality control and the sharing of the revenues concern.
These observations can support the view that the spatial dependence characterizing service provision in governmental museums could depend on the design of the race rules governing the grants for the outsourced provision of services to governmental museums, rather than sound competition among museums.
Borrowing the terminology proposed by Manski (2000), our discussion leads to argue that neighborhood effects can due to three types of interaction. (i) Peer effect and the search of scientific and social recognition drive museum directors to offer similar services as their neighbors. This is what Mansky labels as ‘endogenous interaction’: the propensity of an agent to behave in a given way varies with the behavior of the group to which he/she belongs. (ii) The similarity of personal characteristics of a large part of museum managers drives them to offer similar services: this is a form of ‘contextual interaction’, where individual behavior is determined by the exogenous features of the reference group. (iii) Common rules –at the national level, and especially at the regional level where public bodies make management choices for public museums with no autonomy– lead to ‘correlated effects’, which emerge in the case in which agents in the same group behave similarly simply because they share common institutional rules and incentives. Unfortunately, data limitation prevents us from disentangling the different sources of neighborhood effects; hopefully, future research could provide further insights on this issue, probably exploiting the time dimension of the longitudinal data concerning museums’ behavior. Nevertheless, let us underline that several motives supporting the neighborhood effects have little to do with sound competition among museums.
sound competition, entailing quality improvements. Perhaps, further legal and administrative reforms concerning governmental museums are necessary, along with a truly deep change in the feeling about the museum mission, to implement truly competitive processes among and within public and private museums.
References
Andersson R., Quigley J.M., & Wilhelmsson M. (2009). Urbanization, productivity, and innovation:
Evidence from investment in higher education. Journal of Urban Economics, 66(1), 2-15.
Anselin L. (1988). Spatial Econometrics: Methods and Models. Dordrecht: Kluwer Academic
Publishers.
Bertacchini E.E., Dalle Nogare C., & Scuderi R. (2018). Ownership, organization structure and public
service provision: the case of museums. Journal of Cultural Economics, 42(4), 619-643.
Besag J. (1974). Spatial interaction and the statistical analysis of lattice systems. Journal of the Royal
Statistical Society. Series B (Methodological), 36(2), 192-236.
Borowiecki K.J., & Castiglione C. (2014). Cultural participation and tourism flows in Italy: An
empirical investigation of Italian provinces. Tourism Economics, 20(2), 241-262.
Carey S., Davidson L., & Sahli M. (2012). Capital city museums and tourism flows: An empirical
study of the museum of New Zealand Te Papa Tongarewa. International Journal of Tourism
Research, 15(6), 554-569.
Cellini R. & Cuccia T. (2013). Museum & monument attendance and tourism flow: A time series
analysis approach. Applied Economics, 45(24), 3473-3482.
Cellini R. & Cuccia T. (2018). How free admittance affects charged visits to museums: An analysis of
the Italian case, Oxford Economic Papers, 70(3), 680-698.
Cressie N. (1993). Statistics for Spatial Data. New York: Wiley.
Desvallées A., & Mairesse F. (2010). Key concepts of museology. Paris: Armand Colin Editor &
ICOM.
Fernandez-Blanco V., & Prieto-Rodriguez J. (2011). Museums. In Towse R. (Ed.), A Handbook of
Cultural Economics - Second Edition. Northampton (Ma, US): Edward-Elgar Publshing, 290-296.
Frey B.S., & Meier S. (2006). The economics of museum. In V.A. Ginsburgh & D. Throsby (Eds.),
Handbook of the Economics of Art and Culture.Amsterdam:North Holland, 1017-1047.
Griffith D.A. (2006). Assessing Spatial Dependence in Count Data: Winsorized and Spatial Filter
Specification Alternatives to the Auto‐Poisson Model. Geographical Analysis, 38(2), 160-179.
Guccio C., & Lisi D. (2016). Thus do all. Social interactions in inappropriate behavior for childbirth
services in a highly decentralized healthcare system. Regional Science and Urban Economics, 61,
1-17.
Kaiser M.S., & Cressie N. (1997). Modeling Poisson variables with positive spatial dependence. Statistics & Probability Letters, 35(4), 423-432.
ICOM – International Council of Museums (2007). Statutes. Paris: ICOM.
ISTAT - Istituto Nazionale di Statistica (2015). Indagine sui musei e le istituzioni similari: Microdati
ad uso pubblico. Roma: ISTAT. https://www.istat.it/it/archivio/167566 (as accessed on Jan 5th, 2019).
Le Sage J.P., & Pace R.K. (2009). Introduction to Spatial Econometrics. New York: Chapman and
Hall - CRC.
Longo F., Siciliani L., Gravelle H., & Santos R. (2017). Do hospitals respond to rivals' quality and
Matlock K., Song J.J., & Goering C.Z. (2014). Spatial dependency and contextual effects on academic
achievement. International Journal of Educational Administration and Policy Studies, 6(3), 32-42.
Manski C. (2000). Economic analysis of social interactions. Journal of Economic Perspectives, 14(3),
115-136.
Mears D.P., & Bhati, A.S. (2006). No community is an island: The effects of resource deprivation on
urban violence in spatially and socially proximate communities. Criminology, 44(3), 509-548.
Zan L., Bonini Baraldi S., & Santagati M.E. (2018). Missing HRM: the original sin of museum