Resource localization and multimodal flight
control in Drosophila melanogaster
Thesis by
Seth A. Budick
In Partial Fulfillment of the Requirements for the
Degree of Doctor of Philosophy
California Institute of Technology
Pasadena, CA
2007
Acknowledgements
I wish to thank Titus Neumann for his assistance with the free-flight fly visualization system and with German language translation. I also thank Andrew Straw for his help in programming the pulse generating system used in the free-flight experiments and for his design of the fly visualization system used in the magnetically tethered flight experiments. I thank John Bender for
assistance with the magnetic tether apparatus and William Dickson for useful discussion on the mechanics of magnetically tethered flight. I thank Michael Dickinson and Michael Reiser for their assistance in building the rigidly tethered flight apparatus, Dan Rizzuto for his implementation of the non-parametric test for circular mean differences, and Don Lifke for suggestions on statistical
Abstract
Upwind flight is a common strategy among insects searching for the sources of attractive odors. While much is known about the behavior of male Lepidoptera tracking female pheromone plumes, data on odor localization in other taxa, including the model organism Drosophila melanogaster, have been relatively lacking. The work presented in this thesis provides a description of the multimodal control of forward flight in D. melanogaster, including olfactory mediated flight during the localization of attractive resources.
Here it is shown that D. melanogaster responds rapidly to the onset of olfactory stimulation by turning upwind and increasing its airspeed, yielding an upwind surge. Following plume loss, flies, like many moths, often cast—flying perpendicular to the wind while making iterated large-angle turns. Flies, however, are anemotactic even in the absence of odor, and unlike many
Lepidoptera, they also fly fast and straight upwind in a homogenous odor cloud. Though they respond rapidly to odor contact and loss, flies thus do not require intermittent olfactory stimulation in order to sustain upwind flight.
The results of tethered-flight experiments are largely in accord with those from free-flight. Pulsed and continuous olfactory stimuli elicit qualitatively similar responses in the wing kinematics of tethered flies, suggesting that the intermittency of the odor plume is not a key parameter in modulating flight behavior. At the same time, a tethered-flight analogue of casting may
The role of mechanosensory cues in the orientation of flying insects has been the focus of relatively little research. The results presented here suggest that a strong mechanosensory response orients flying flies into an oncoming wind, as would be experienced during forward flight. This response is mediated by the Johnston’s organs and may play an essential role during forward flight.
Contents
Acknowledgements iii
Abstract iv
List of Figures x
List of Tables xii
1 Introduction 1
1.1 Search strategies 1
1.2 Plume structure 2
1.3 Evidence from Lepidoptera 3
1.4 The Drosophila olfactory system and relevant comparisons to 5 other insect species
1.5 Visual control of Drosophila flight 7
1.7 Mechanosensation and the paradox of upwind flight 9
1.8 Plan for thesis 11
2 Experimental methods 12
2.1 Free-flight experiments 12
2.1.1 Wind tunnel 12
2.1.2 Odor 14
2.1.3 Animals 16
2.1.4 Tunnel illumination and fly visualization 17
2.1.5 Statistical analysis 18
2.2 Rigidly-tethered experiments 22
2.2.1 Animals, tethering 22
2.2.2 Odor delivery 22
2.2.3 Wingbeat analyzer 23
2.3 Magnetically-tethered experiments 25
2.3.1 Animals, tethering 25
2.3.2 Fly visualization and visual stimulation presentation 25
2.3.3 Wind velocity control 26
3 Free-flight responses to olfactory and visual stimuli 28
3.1 Anemotaxis 29
3.1.1 Experimental design 29
3.1.2 Results 29
3.2 Anemotaxis vs. object-mediated fixation 32
3.2.2 Results 32
3.3 Flight in a narrow banana odor plume 32
3.3.1 Experimental design 32
3.3.2 Results 34
3.4 Responses to a homogeneous odor plume 42
3.4.1 Experimental design 42
3.4.2 Results 42
3.5 Responses to pulsed and continuous plumes 44
3.5.1 Experimental design 44
3.5.2 Results 46
3.6 Discussion 51
4 Tethered flight responses to pulsed and continuous odor plumes 58
4.1 Responses to continuous and pulsed odor plumes 58
4.1.1 Experimental design 58
4.1.2 Results 59
4.2 Discussion 65
5 The role of visual and mechanosensory cues in structuring forward 69
flight
5.1 Effect of wind velocity on orientation 69
5.1.1 Experimental design 69
5.1.2 Results 70
5.2.1 Experimental design 70
5.2.2 Results 72
5.3 Antennal contribution to the orientation response 75
5.3.1 Experimental design 75
5.3.2 Results 78
5.4 Interaction of visual and mechanosensory stimuli 80
5.4.1 Experimental design 80
5.4.2 Results 81
5.5 Discussion 85
6 Concluding remarks 91
6.1 Significant results 91
6.1.1 Chapter 3: Free-flight responses to olfactory and visual
stimuli 91
6.1.2 Chapter 4: Tethered-flight responses to pulsed and
continuous odor plumes 92
6.1.3 Chapter 5: The role of visual and mechanosensory cues in
structuring forward flight 93
6.2 A multimodal approach to understanding resource localization in
D. melanogaster 94
6.3 Future directions 96
List of Figures
2.1 Schematic profile view of the full wind tunnel 13
2.2 Trajectory representations 19
2.3 Trajectory parameters subjected to analysis 20 2.4 Schematic representation of the wingbeat analyzer 24 2.5 Schematic view of visual arena and magnetic tether 27 3.1 D. melanogaster anemotactic response 30 3.2 Interaction between anemotaxis and object orientation 33 3.3 Trajectory examples of odor-mediated flight 35
3.4 Localization of banana odor plumes 36
3.5 Overall effects of plume contact on trajectory parameters 37 3.6 Overlaid examples of the plume contact response 39 3.7 Time-series analysis of short term kinematic responses to odor
contact 41
3.8 Effects of flight in a homogeneous plume on kinematic parameters 43 3.9 Trajectory examples in various odor conditions 45 3.10 Trajectory examples in pulsed and continuous large-diameter 47
plumes
5.1 Orientation responses to wind of varying velocity 71 5.2 Orientation traces in active and passive wind responses 73 5.3 Quantification of active and passive wind responses 74 5.4 Relative contributions of the active and passive orientation 76
responses
5.5 Saccadic contribution to wind-mediated orientation responses 77 5.6 Contribution of the Johnston’s organs to wind-mediated 79
orientation
5.7 Quantification scheme for wind vs. visual orientation 83 5.8 Orientation responses to combinations of visual and olfactory 84
stimuli
List of Tables
3.1 Fitting a mixture of von Mises distributions to mean heading 31 vectors of flies in a -odor, -wind environment
3.2 Fitting a mixture of von Mises distributions to mean heading 31 vectors of flies in a –odor, +wind environment
3.3 Comparisons of changes in mean trajectory values from baseline 42 in the narrow banana odor plume and a clean air control
CHAPTER 1
Introduction
Flying insects demonstrate a remarkable ability to localize the resources necessary for their survival and reproduction. In doing so successfully, they must integrate the input of multiple sensory modalities. Insects have thus served as model systems in neuroethological studies on the control of locomotion,
particularly with respect to the role of the visual and olfactory systems. The work in this thesis pertains to the multimodal control of flight in Drosophila melanogaster, but our understanding of flight control draws on a diverse literature, from the level of sensory input all the way to theoretical models of optimal search behavior.
1.1 Search strategies
Analyses of the search strategies used by insects to locate resources generally divide those searches into two main classes: those in which a
When a chemical stimulus is borne on a current, the range of detection becomes asymmetric. That is, the axis of the resulting plume lengthens along the direction of flow, creating an elongated active space. For a plume that is longer than it is wide, search becomes optimal at a course heading of 90º relative to the direction of the current, with the relative advantage of cross-current movement increasing as a function of flow velocity (Dusenberry, 1989a). It is thus not surprising that many flying insects apparently search for plumes by flying perpendicular to the wind line (Kennedy et al., 1981; Kuenen and Cardé, 1994; Zanen et al., 1994).
An additional complication arises, however, due to fluctuations in wind direction. In winds shifting over ±30º relative to the mean direction, the time-averaged plume becomes wider than it is long, and the optimal search orientation switches from cross-wind to one directed upwind or downwind (Dusenberry, 1989a; Sabelis and Schippers, 1984). In at least two species of Drosophila, this closely matches an observed change in search strategies in shifting winds (Zanen et al., 1994).
1.2 Plume structure
Time-averaged plume analyses imply a uniformity of the stimulus environment within that space. In fact, plume structure is often highly non-homogeneous, with filaments containing high concentrations of odorant
interspersed with large volumes of relatively clean air (Murlis et al., 1992). This distribution results from the two distinct mixing mechanisms that affect odorant molecules: molecular and turbulent diffusion. The root mean square (rms) 3-D
displacement of a molecule by molecular diffusion is equal to
(
6* *D t)
12, whereis the diffusion coefficient and is time. Even for a very small molecule like CO
D t
2, the rms displacement after one minute is only 7.6 cm, illustrating the
Turbulence, the fluctuating component of wind velocity, results in the mixing of air at a variety of spatial scales (Hanna and Insley, 1989; Murlis et al., 1992). When the ground is irradiated by the sun, convective energy is injected into giant vortices, whose energy is transferred to progressively smaller eddies. At large scales—hundreds to thousands of meters—eddies cause long-term shifts in wind direction. On the scale of meters, eddies may cause plumes to undulate and meander, yet still do relatively little to disrupt their fine spatial structure. This is because at a characteristic size, the Kolmogorov length, vortices lose their energy in the form of heat due to the air’s viscosity. Below the Kolmogorov length, mixing is a function of molecular rather than turbulent diffusion.
If a plume was to emanate from a point source, its width would expand, driven by molecular diffusion, until it reached the Kolmogorov length, at which point individual plume filaments may be stretched and stirred (Jones, 1983). Studies indicate that plumes may therefore often be composed of multiple coherent filaments, while the plume as a whole undulates due to large-scale eddies (Murlis et al., 1992; Murlis et al., 2000). An insect may thus be likely to encounter a plume as a series of discrete odor packets, and this realization has shaped a great deal of current research on olfactory localization (e.g., Mafra-Neto and Cardé, 1994; Murlis et al., 1992; Vickers and Baker, 1994).
1.3 Evidence from Lepidoptera
For a variety of reasons, not least their extremely robust responses to simple blends of pheromones, several species of Lepidoptera have served as behavioral and physiological models of olfactory mediated search (see papers in Cardé and Minks, 1997). It was using mosquitoes, however, that Kennedy (1940) first showed that insects, activated by an olfactory stimulus, fly upwind by using visual motion to maintain their groundspeed, a behavior known as “optomotor anemotaxis.” This finding was later extended to male moths tracking a
upwind, instead zigzagging while following a generally upwind trajectory (Marsh et al., 1978).
Interestingly, moths also counterturn following odor loss, but with
progressively larger magnitudes, leading to “casting”—flight directed across the wind-line with iterated large magnitude turns (Kennedy et al., 1980; Kennedy et al., 1981). These results led to the hypothesis that in addition to optomotor anemotaxis, pheromone contact triggers a self-steered counterturning program which nevertheless is also subject to modulation by additional stimuli, such as odor concentration (Kennedy, 1983; Kuenen and Baker, 1983).
While this general model of Lepidoptera flight is still largely accepted, recent results have suggested a greater role for plume fine structure in shaping flight trajectories (Baker et al., 1985). Baker & Haynes (1987), showed that male moths of the species Grapholita molesta surge upwind in response to individual instances of plume contact and rapidly shift to cross-wind flight following plume loss. This result led Baker (1990) to formulate a model for moth behavior whereby contact with an odor plume initiates both a phasic upwind surge and a tonically activated, long-lasting, internal counterturn-generating program. The rapidly adapting phasic response suppresses the tonic one, giving rise to upwind surges immediately following plume contact. On plume loss, the tonic program is expressed, yielding casting flight. This model also accounts for the observation that many moth species enter a period of sustained casting when flying in a homogenous plume (Kennedy et al., 1980; Willis and Baker, 1984). Interestingly, theoretical models for optimal search during upwind flight in an intermittent plume suggest that such a “surge and cast” pattern may maximize the efficiency of locating an odor source (Balkovsky and Shraiman, 2002).
applicability of this model to flight in other insect orders has yet to be extensively tested.
1.4 The
Drosophila
olfactory system and relevant comparisons to
other insect species
It is important to consider these behaviors in light of the function and constraints of insect olfactory systems. Enormous progress has been made in recent years in understanding how insects process olfactory stimuli. In
Drosophila, olfactory receptor neurons (ORNs) are located on the antennae (about 1200 ORNs) and maxillary palps (about 120 ORNs). These neurons are compartmentalized in olfactory sensillae with up to four ORNs housed within individual sensillae (de Bruyne et al., 1999; de Bruyne et al., 2001). Olfactant molecules enter the sensillae through cuticular pores and diffuse across the sensillar lymph, possibly with the aid of odorant binding proteins (Rützler and Zwiebel, 2005), before activating olfactory receptor proteins on the ORN dendrites. The 62 members of the odorant receptor family are seven
transmembrane domain G protein coupled receptors, and their activation triggers a transduction cascade that leads to depolarization of the ORN (Robertson et al., 2003).
The secondary olfactory neuropil, the antennal lobe (AL), is composed of about 43 discrete units, the glomeruli. With very few exceptions, a single ORN expresses only one olfactory receptor protein and, for the most part, a single ORN projects to just one glomerulus in the AL (Couto et al., 2005; Fishilevich and Vosshall, 2005). Furthermore, a given glomerulus receives ORN input from cells expressing only a single olfactory receptor, resulting in a precise spatial map of ORN activity in the AL. Individual olfactory receptor types are tuned to specific classes of odorants. For instance, multiple glomeruli have strong
receptors, and their corresponding ORNs, such that stimulation with even a single odorant evokes a broad pattern of activation across the AL (Wang et al., 2003; Wilson et al., 2004).
The question of how the brain is able to extract an odorant’s identity has been the subject of much recent research. In the glomeruli, ORNs synapse on projection interneurons (PNs) which project to downstream targets in the
mushroom bodies and lateral horn of the protocerebrum. A single PN innervates only one glomerulus, but local interneurons (LNs) make substantial lateral
inhibitory contacts between glomeruli. The degree to which PN output matches ORN input to its respective glomerulus is still somewhat unclear. Optical imaging of PN activity has indicated a relatively faithful transmission of the signal from ORN input to PN output (Ng et al., 2002; Wang et al., 2003). Electrophysiological recordings, however, have suggested that PNs are more broadly tuned and have very different dynamics than their corresponding ORNs, suggesting an important role for the LNs in integrating activity across the AL (Wilson et al., 2004).
The transduction mechanics of the olfactory system are especially
important to consider in regards to plume tracking. As mentioned above, recent studies have indicated that the behavioral response of a male moth tracking a pheromone plume may depend strongly on the precise frequency of interception of odorant pulses, at rates up to 10Hz (Mafra-Neto and Cardé, 1994; Vickers and Baker, 1994). The speed of the olfactory system and its “flicker-fusion” rate may thus play a central role in determining the moth’s behavioral response dynamics. In cockroaches for example, ORNs are able to track olfactory stimulation at rates up to 40Hz (Lemon and Getz, 1997) while PNs can track pulses at 5–10Hz
(Lemon and Getz, 1998). In the moth Antheraea polyphemus, olfactory receptors are able to detect individual pheromone pulses up to 10Hz (Rumbo and
1.5 Visual control of
Drosophila
flight
D. melanogaster has been a model organism in the study of the visual control of behavior. The optomotor response, for instance, was described very early in this species (Götz, 1964). In this paradigm, an animal responds to rotation of the visual field by turning syndirectionally, and at the same angular velocity as the stimulus, compensating for rotation that could otherwise have been generated by an unintended turn, perhaps due to a wind gust. Besides this large-field response to spatially extended patterns, D. melanogaster is also highly responsive to local visual stimuli, strongly fixating vertical edges in a tethered-flight paradigm (Götz, 1987). This response is mediated by a neural pathway that is distinct from the one underlying the large-field response, at least in the flies Musca domestica and Calliphora erythrocephala (Egelhaaf, 1985a; Egelhaaf, 1985b; Egelhaaf, 1987).
In recent years, another robust, visually evoked behavior has been
described in D. melanogaster: the expansion avoidance response. It has become apparent, both from free- and tethered-flight experiments, that visual expansion is an extremely potent aversive stimulus, eliciting avoidance responses in the form of saccades (high angular-velocity turns) when the angle subtended by an approaching object reaches a critical size (in tethered-flight) (Bender and
Dickinson, 2006b), or when the total visual expansion exceeds a threshold value (in free-flight) (Tammero and Dickinson, 2002b).
This expansion avoidance response would seem to be an intuitive behavioral strategy since it reduces the likelihood of collisions with looming
looming in front of the fly are relatively more likely to elicit landing, whereas those expanding laterally favor saccades (Tammero and Dickinson, 2002a).
Forward flight would thus appear to be a problematic goal for a fly intent on avoiding visual expansion. A fly translating forward will inevitably encounter expansion, the most potent stimulus for eliciting avoidance responses in tethered-flight. Recent work has demonstrated that this paradox may be partially
explained by considering behavior in a more realistic visual setting.
If a tethered fly is presented with a periodic pattern of vertical stripes expanding from a focus of expansion (FOE), its orientation towards the FOE depends on the temporal frequency of the stimulus. Thus, at an expansion rate above approximately 1 Hz, D. melanogaster orients instead towards a focus of contraction (FOC), but at lower temporal frequencies, the avoidance of the FOE largely disappears, or even reverses (Reiser, 2007). Thus, depending on realized expansion rates in free-flight, this dependence may help to explain real world behavior.
Further, it may be the case that in free-flight, a good deal of flight is “goal-directed” in that flight control may often be dominated by object fixation rather than large-field responses. Thus, when a vertical bar is superimposed on the FOE, that pole becomes much less aversive (Reiser, 2007). In this thesis, I will further explore the role that wind plays in overcoming this strong intrinsic aversion.
1.6 Olfactory mediated flight in
Drosophila
Despite its role as a model species in genetics, neurobiology, and behavior, odor tracking has been relatively unstudied in D. melanogaster. David (1982), showed that Drosophila hydei, in general, maintains a preferred groundspeed despite fluctuations in windspeed, as is also the case in mosquitoes (Kennedy, 1940). Wright & colleagues presented anecdotal evidence that D. melanogaster
responds to narrow odor plumes by flying convoluted upwind trajectories, and by flying straight upwind in a homogeneous plume (Kellogg et al., 1962; Wright, 1964). On odor loss, flies flew across or downwind.
When searching for the source of an attractive odor while flying in still air,
D. melanogaster increases its rate of saccades (high angular-velocity turns) when near the odor source, while decreasing its velocity (Frye et al., 2003). D.
melanogaster also executes saccades sooner when flying away from an odor source, suggesting perhaps that saccades are initiated in response to the perception of decreasing odor concentration (Frye et al., 2003). The
interpretation of results in still air is difficult, however, since the precise nature of the odor environment is hard to ascertain, making wind-tunnel studies with a well-defined plume structure desirable.
1.7 Mechanosensation and the paradox of upwind flight
Among the sensory modalities discussed thus far, vision has received perhaps the greatest degree of attention in studies of insects orienting with respect to the local environment. As mentioned earlier, Kennedy (1940) first showed that mosquitoes make use of visual cues to set their groundspeed during upwind flight by maintaining a consistent velocity relative to the visual
environment.
decomposed into its longitudinal and transverse components. In theory, an insect could thus maintain an upwind heading by minimizing transverse flow.
Alternatively, if the insect’s goal was to maintain a trajectory at some consistent angle relative to the wind, it could hold transverse flow at a constant value for a given wind velocity. In the case of a counterturning moth, the sign of the
transverse flow could then be iteratively reversed (David, 1986).
The role of mechanosensory cues in orienting insect flight has received relatively little attention however. A wind-borne insect cannot use
mechanosensory information to detect the direction or velocity of the ambient air (David, 1986). It is entirely possible however, and in fact quite likely, that insects do use mechanosensory cues to detect their own velocities relative to the ambient air, as well as yaw deviations from the direction of their thrust vectors.
The first indication that insects use mechanosensory information in flight orientation came from Weis-Fogh’s work on the paired beds of trichoid sensillae in Schistocerca gregaria (Weis-Fogh, 1948; Weis-Fogh, 1949). Weis-Fogh
observed that tethered insects, subjected to asymmetric wind stimulation on their heads, tended to orient into the direction of the oncoming wind. Thus, if a flying insect was temporarily yawed relative to its direction of motion, as appears to be the case in locusts, where an individual’s yaw may average 5.2º relative to its direction of flight (Baker et al., 1981), the resulting side-slip could induce a mechanical stimulus leading to an orientation response.
Gewecke (1970) demonstrated that locust antennae also contribute to wind detection. In insects that had their antennae glued at the level of the pedicellus-flaggellum joint (eliminating input to antennal mechanoreceptors), wing stroke amplitude showed a significantly smaller decline in response to increasing wind velocity than in control animals. Arbas (1986) showed that the antennae also act as wind direction sensors in Schistocerca gregaria, but in an apparently antagonistic capacity to the hair beds. Locusts with their antennae and sensillae immobilized tended to turn into the direction of an oncoming wind, while those with only the hair beds immobilized turned away from the wind.
1959), and Lepidotera (Gewecke and Niehaus, 1981; Niehaus, 1981).
Nevertheless, it has been difficult to ascribe the role of wind detection to any one sensory structure within the antennae. In most cases, multiple structures,
including the Johnston’s organs (JOs), campaniform sensillae, and other
chordotonal organs respond to deviations of the flagellum relative to the pedicel. Wind-mediated orientation in D. melanogaster, where the JO is the only
mechanoreceptive organ present at this junction, has not been tested however. Finally, as described above, flies avoid expanding visual stimuli in free- and tethered-flight, though recent experiments have indicated that this response is dampened under certain visual conditions. In tethered-flight however, wind-induced mechanical feedback cues are absent, and it is possible that these are required to suppress the powerful expansion avoidance response. That is, the perception of a headwind, as would be experienced during forward flight, may be necessary in order to tolerate the accompanying visual expansion.
1.8 Plan for thesis
The goal of this thesis is to describe the use of olfactory, visual, and mechanosensory cues in structuring the flight trajectories of D. melanogaster. In Chapter 2, I describe the methods used in free- and tethered-flight studies to test fly responses in naturalistic and controlled conditions. In Chapter 3, I document the free-flight behavior of flies responding to plumes of attractive odors. The results of these experiments have previously been published by Budick & Dickinson (2006). In Chapter 4, I examine the tethered-flight responses of flies exposed to odor plumes similar to those encountered in the free-flight
CHAPTER 2
Experimental methods
2.1 Free-flight experiments
2.1.1 Wind tunnel
An open-circuit, closed-throat wind tunnel was built commercially to custom specifications (Engineering Laboratory Design, Inc., Lake City, MN). At the intake end, air was drawn through a honeycomb and screen pack followed by a 6.25:1 contraction and then a 1.55 m long working section, constructed from acrylic, with a width and height of 0.305 m (Fig. 2.1A). The working section was followed by a diffuser and then the fan. At the upwind and downwind ends of the working section, 1 mm mesh prevented the flies from escaping from the tunnel. All ducts were fabricated of fiberglass-reinforced plastic.
The floor of the tunnel was painted black with acrylic paint to aid in fly visualization as described below. The walls of the tunnel were covered by a random pattern consisting of black and white squares of length 1.4 cm. At this size, a square normal to the fly would subtend 5° of visual space when viewed from the midline of the tunnel. The checkerboard patterns were perforated at half their height to allow for illumination via infrared diodes positioned outside the tunnel, again to aid in fly visualization.
In experiments utilizing wind, the velocity was set to 0.4 m sec-1. This
being inhibited at higher velocities. Furthermore, our own observations of wind velocities in an orange orchard in which Drosophila spp. were active indicated that this value was well within the normal range of variation both beneath individual orange trees and in the open spaces between trees (mean velocity 0.37±0.35 m sec-1).
2.1.2 Odor
Banana odor was produced by macerating ripe banana, together with distilled H2O and bakers yeast in the ratio 1g banana:1 ml H2O:0.02 g yeast.
This recipe was chosen on the basis of its demonstrated ability to lure wild flies to outdoor traps and is derived from standard Drosophila bait recipes (e.g., Carson and Heed, 1986). This mixture was allowed to ferment for 45 minutes at approximately 25°C and was then filtered through 0.1 mm mesh for an additional hour. The filtrate was produced in quantities of 0.5–1 L and frozen immediately for later use.
Fly responses were tested in three differently structured odor plumes. In ribbon plume experiments, air was bubbled through the banana mixture at a rate of 0.3 L min-1 by means of a volume flow controller (Sierra Side Trak, Monterey,
CA). The banana mixture was contained within a polypropylene vial with clean air passing into the vial via a 3 mm diameter brass tube that penetrated the vial’s lid. The tube descended slightly less than the height of the vial such that the air emerging from it bubbled through 50 mL of the banana mixture. The scented air then passed out of the vial via a PVC tube attached to the vial’s lid and passed into an acrylic tube of 3 mm diameter that penetrated the tunnel floor 13 cm from the upwind end of the working section, halfway between the two tunnel walls. This acrylic tube was bent 90° at a height of 15.25 cm, half the height of the tunnel, and a polypropylene nozzle, diameter 2 mm, was glued to the end of the tube. In wide plume experiments, air was injected into the banana mixture at 1.0 L min-1 and passed down a 3 mm diameter brass tube that
penetrated the tunnel floor in the same position as in the ribbon plume
mm diameter acrylic tube, 157 mm in length, parallel to the tunnel floor. This tube was perforated by a 1 mm diameter hole at its downwind end and three additional sets of 4 concentric holes, with one set each at 5, 10 and 15 cm along its length. Due to the pressure differential along the length of this tube, gas exiting the more proximal holes was projected further from the tube, resulting in a diffuse cylindrical plume. The wide plume was either produced continuously, or was pulsed via a three-way solenoid valve (Valve Driver II, General Valve Corp., Fairfield, NJ) controlled by custom software running on a PC. This valve was downstream of the flow controller and switched a clean air input between one output that led to the vial containing the banana odor and a second output which simply consisted of a PVC tube. Those two output lines were then reunited via a Y junction just prior to reaching the brass tube that passed through the tunnel floor, thus switching the odor and clean air inputs to the tunnel. In the pulsed plume, the banana odor alternated with clean air at 1 sec intervals. By switching the input to clean air, the odor was evacuated very rapidly from the tube following the truncation of each pulse, producing very sharp boundaries at both the leading and lagging edges of the pulse, as judged from smoke visualization.
To visualize the odor plume produced by these delivery systems, we generated a smoke plume by pumping mineral oil through a hypodermic needle across which we placed a high voltage that burned the oil. The smoke thus generated was then injected into the tunnel under the same conditions as in the odor plume experiments and the plume’s trajectory and dimensions were
Homogeneous odor cloud experiments used the same banana odor, but in this case, air was pumped into 100 mL of the filtrate at 25.5 L min-1. A large
cardboard box, 76 cm square, was inserted into the tunnel inlet and served as a mixing chamber for the odor. Four computer fans were positioned approximately equidistant from each other and from the walls of the cardboard box (Fig. 2.1D). Four PVC tubes carried the odor from the vial to the cardboard box where the odor was released immediately upstream of the four small fans and was mixed thoroughly in the mixing chamber (as judged by experiments with smoke
tracers). By the time it reached the working section however, the smoke plume was too diffuse to visualize. Normalizing the odor density of the ribbon plume to 100%, the calculated densities of the wide plume and homogeneous cloud were 18% and 11% respectively.
2.1.3 Animals
Experiments were performed at approximately 25°C on 3–5 day old female fruit flies, Drosophila melanogaster Meigen, descended from a wild-caught
population of 200 mated females. Animals were deprived of food, but not water, for 20–24 hours prior to experimentation in order to motivate flight. On the day of experimentation, approximately 100 flies were kept in a 50 ml vial beneath the tunnel where they acclimated for 10 minutes to two hours, depending on when they were introduced into the tunnel, as described below, with an experiment lasting approximately two hours. This vial was connected, via a stop cock, to an acrylic tube of diameter 5 mm that penetrated the floor of the tunnel at a
the imaging system from takeoff at the release tube or shortly after takeoff. Individual trajectories were often recorded as several trajectory fragments due to loss of the fly by the visualization system. As such, a single mean value based on all trajectory fragments was calculated for each trajectory parameter for each fly, except as noted below. In all experiments, flies were recorded until they landed. The flies were vacuumed out of the tunnel approximately every ten minutes.
2.1.4 Tunnel illumination and fly visualization
The tunnel was illuminated by a linear array of 10 halogen bulbs on each side yielding a luminance of 60 to 120 lux within the working section. IR LEDs (HSDL-4200, Hewlett Packard, Palo Alto, CA) positioned at the mid-height of the tunnel provided illumination for two near IR sensitive cameras (SSC-M350, Sony, Tokyo, Japan) positioned 1.27 m above the tunnel at a distance of 1.82 m from each other (Fig. 2.1E). The 3-dimensional flight trajectories were sampled at 60 frames s-1 and reconstructed with commercially available software, Trackit
3-D (Fry et al., 2000). In the pulsed plume experiments, the state of the solenoid valve was recorded at every time point together with the 3-dimensional fly
position. We were thus able to determine the location of all pulses in the tunnel at any given time as well as the fly’s position relative to them. This allowed us to determine the moment of plume entry and plume loss. The fly trajectories were smoothed to remove digitization errors by low-pass filtering with a fifth order Butterworth filter using a frequency cutoff of 7.5 Hz.
All analyses of fly trajectories made use of software written using Matlab (Mathworks). Only trajectories longer than 0.42 sec were analyzed in order to be of sufficient length for low-pass filtering. Flies approaching the odor source generally slowed down and ceased to respond with upwind surges, due either to the visual effects of the plume source, changes in plume dynamics, or both. Because of these qualitative changes in flight trajectories as the animals
visualize the distribution of flies within the wind tunnel, individual trajectories (Fig. 2.2A) were overlaid (Fig. 2.2B), and plotted as pseudocolor transit
probability histograms (Fig. 2.2C). Flight trajectories were described in terms of a number of variables that were calculated at every frame in the flight trajectory (Fig. 2.3). Groundspeed was determined from the distance that the animal traveled in the horizontal plane between samples. Cross-wind velocity and
upwind velocity were the components of groundspeed directed across the width of the tunnel and up its long axis, respectively. Vertical velocity was determined from the distance that the animal traveled in the vertical plane between samples. Three-dimensional heading was the angle formed by the tangent to the flight trajectory and the long axis of the tunnel, such that 0° corresponded to straight upwind and 180° was straight downwind. Three-dimensional heading is thus intentionally underdefined in that a value of 90° could correspond to any vector within the transverse vertical plane of the fly. Heading (track angle) was the projection of three-dimensional heading in the horizontal plane of the fly and is equivalent to the angle between the groundspeed vector and the long axis of the tunnel. Airspeed was calculated trigonometrically using groundspeed, wind speed, and heading and is the velocity of the animal in the horizontal plane relative to the wind. Finally, plume distance was defined as the shortest absolute 3-D distance between the fly and the plume. Substantial variability in the
overall shape of flight trajectories, relative to published trajectories for moths, made it difficult to assign meaningful parameters to the counterturning behavior, such as turn frequency or inter-reversal distance.
2.1.5 Statistical analysis
All linearly distributed trajectory parameters were compared using heteroscedastic t-tests whereas count data were compared with χ2 tests.
Heading data were circularly distributed and thus required treatment with the appropriate statistical methods. For each trajectory, a mean heading was
then: Ci =cosθi andSi =sinθi. Summing over the entire trajectory and dividing
by trajectory length yields the rectangular coordinates of the mean vector:
1 1 n i i C C n = =
∑
, 1 1 n i i S n ==
∑
S . The angle of the mean vector,θ , is then calculated as:1
1
tan ( / ) if 0 tan ( / ) 180 if 0 90 if 0 and 0 270 if 0 and 0.
S C C
S C C
C S C S θ − − ⎧ > ⎪
+ ° < ⎪
= ⎨
° = > ⎪
⎪ ° = <
⎩
The length of the mean vector, , is calculated as r r=⎡⎣C2+S2⎤⎦1/ 2. This value
varies between 0 and 1 and is a measure of the dispersion around the mean heading (Batschelet, 1981). The mean angular deviation, a quantity equivalent to the standard deviation in linear statistics, is then defined as . Circular means are thus reported here as mean± while means of linear
parameters are reported with the standard deviation.
(
)
1/ 22 1
s=⎡⎣ −r ⎤⎦ s
To test for differences in mean direction between experimental conditions, we implemented the non-parametric test for common mean direction suggested by Fisher (1993, Pp. 115–117). To test for differences in the angular dispersions of two samples about their respective means, we used the non-parametric test suggested by Batschelet (1981, Pp. 124–126). Non-parametric tests were used due to their limited assumptions about angular distributions, namely that the data need not be fit by von Mises distributions.
In several cases, mean trajectory headings did not appear to be unimodally distributed so we tested the fit of one or more von Mises distributions using the method of moments suggested by Fisher (1993, Pp. 100–102). A von Mises distribution is described by two parameters, μ and κ. For a given distribution, the maximum likelihood estimate of μis θ while κ is estimated as the solution of the equation: where , the ratio of two modified Bessel functions. We begin by fitting a single von Mises distribution (1VM) to a sample of mean heading vectors, estimating μ and κ and testing the goodness of fit (gof) of a unimodal model. The goodness of fit statistic is calculated
as:
1(κ) =
A r A x1( ) = ( ) / ( )I x1 I x0
2
U
2 2
1
1
( (2 1) / 2 ) ( ) (1/12
2 n
i i
U z i n n z
=
⎡ ⎤
=⎢ − − ⎥− − +
22
the zi are the cumulative frequency values of the individual mean trajectory
headings rearranged into ascending order. In successive iterations, we fit a model containing one additional mode (2VM, etc.), estimate the values of μ and κ for each mode and the proportion of the total sample represented by each. The gof
of the new model is calculated to obtain . To assess the significance
probability of the fit, we generate 100 parametric bootstrap samples of the same size as the original dataset. For each sample, we estimate μ and κ and calculate the corresponding gof. The significance probability of the fit (P
2
VM
U
VM) is then
estimated as 2 100 U VM
N
P = where is the number of bootstrap samples for which
the gof exceeds . All statistical analyses were conducted using custom routines written in Matlab.
2 U N 2 VM U
2.2 Rigidly-tethered experiments
2.2.1 Animals, tethering
All experiments used female flies 3–5 days post-eclosion from the same population as that described in §2.1.3. Flies were deprived of food, but not water, for 4–6 hours prior to experimentation. Flies were anaesthetized by chilling to approximately 4ºC and tethered to 0.1 mm diameter tungsten rods with UV sensitive glue (see Dickinson et al., 1993; Lehmann and Dickinson, 1997). Flies were mounted in a wingbeat analyzer (described below) that was itself placed within the wind tunnel described in §2.1.1, such that the fly was positioned halfway between the tunnel walls at a height of 36 cm (approximately half the tunnel’s height) and 26.7 cm from the downwind end of the tunnel. Experiments were performed at approximately 25ºC.
2.2.2 Odor delivery
23
of the banana mixture at 1.0 L min-1. The odor dispenser again consisted of a 3
mm diameter brass tube which now penetrated the tunnel floor 34.9 cm upwind of the fly. This tube was inserted in and glued to a 7 mm diameter acrylic tube, 5.1 cm in length, parallel to the tunnel floor. The acrylic tube was laterally perforated at its downwind end by 4 orthogonal 1.9 mm holes. The odor was thus distributed in the form a large diameter turbulent plume, as determined by smoke visualization, that fully engulfed the tethered fly. As in the free-flight experiments, flow through the delivery system was controlled via a three-way solenoid valve (Valve Driver II, General Valve Corp., Fairfield, NJ) which was now controlled by a digital stimulator (PG4000, Neuro Data Instruments Corp.).
The duration of plume pulses was set by programming the digital
stimulator. For a variety of reasons, including the latency in opening and closing the solenoid valve, the actual pulse durations did not match those output by the digital stimulator, particularly at the shortest durations. In order to quantify the pulse durations, we used a digital camera running at 100 Hz (A602f, Basler, Ahrensburg, Germany) to visualize smoke pulses produced under identical conditions. Mean realized pulse durations were calculated based on
measurements of five presentations of each nominal pulse duration.
2.2.3 Wingbeat analyzer
The wingbeat amplitude and frequency of tethered flies were measured via a wingbeat analyzer that has been used extensively in studies of wing kinematic responses to visual stimuli in D. melanogaster (Fig. 2.4) (Dickinson et al., 1993; Tammero et al., 2004). Briefly, flies are tethered such that an infrared light source illuminates the fly from above, casting shadows of the two wings on a pair of infrared photodiodes positioned below the fly. The fly is positioned such that the sensors are maximally adumbrated by the wings when they are in their most ventral position (at the end of the downstroke) and least obscured when the wings are in their most dorsal position (at the end of the upstroke). The photodiode thus produces a periodic voltage signal where successive peaks
25
circuit to identify individual wing strokes (based on a peak detection algorithm). The amplitude of each downstroke can thus be measured in the form of a voltage signal (based on the fraction of the mask occluded by the wing), as well as the wingbeat frequency. While this quantification of wing stroke amplitude is a simplification of 3-D wing kinematics, the signal is proportional to true wing stroke amplitude (Dickinson et al., 1993). Importantly, subtracting the right wingbeat amplitude from the left (L–R) yields a signal that is proportional to yaw torque (Tammero et al., 2004) and thus to a fly’s rotational response to visual or olfactory stimuli. Statistical analyses of these signals made use of SPSS (SPSS, Inc.).
2.3 Magnetically-tethered experiments
2.3.1 Animals, tethering
Females aged 3–5 days post-eclosion, derived from the same population as in §2.1.3, were deprived of food, but not water, for 4–6 hours prior to
experimentation. For experiments, flies were glued to steel pins and positioned between two magnets, allowing rotation around the functional yaw axis as described in Bender & Dickinson (2006b) except that in this study, the magnet located beneath the flies consisted of a stack of five 3.8 cm diameter ring
magnets. Briefly, the end of the steel pin was positioned in a sapphire V-aperture bearing that was glued to the upper magnet, minimizing friction and allowing the fly to rotate around an axis parallel to the magnetic field lines.
2.3.2 Fly visualization and visual stimulus presentation
26
except that the arena used in the present experiments had a circumference of 160 and a height of 24 LEDs. A detailed technical description of the modular display system is provided in Reiser & Dickinson (in review). The 24 columns of LEDs at the up and downwind ends of the arena were removed to allow wind to flow through the arena, impinging on the tethered fly (Fig. 2.5).
The visual arena was placed in a wind tunnel based on the one described in §2.1.1. The only differences here were that the length of the working section was 91.4 cm, the floor was transparent, the walls were covered with white paper, and no lighting, besides that from the visual arena and the IR LEDs, was
provided. Flow through the arena appeared laminar when visualized with a smoke plume. Experiments were performed between 23.5 and 25ºC.
The fly visualization system used by Bender & Dickinson (2006b) was modified so that the camera, positioned under the floor of the plexiglass tunnel, directly visualized the fly through the hole in the center of the circular magnets at a framerate of 100Hz. The visual arena was controlled, as described in Reiser & Dickinson (in review), by a dedicated controller board operating under the command of a PC. All statistical analyses of fly orientation were performed using SPSS (SPSS, Inc.) or JMP (SAS Institute, Inc.).
2.3.3 Wind velocity control
27
28
CHAPTER 3
Free-flight responses to olfactory and visual
stimuli
A great deal is known about mechanisms of olfactory mediated flight in a variety of species of Lepidoptera, but this topic has been the subject of relatively little research in other insect orders. While the effects of olfactory stimulation on
Drosophila free-flight trajectories have been studied in still-air (Frye et al., 2003), it is somewhat difficult to relate behavior to short-term olfactory experience in this paradigm, since the precise distribution of the olfactory stimulus is unknown. For this reason, we studied the free-flight behavior of Drosophila melanogaster in a low velocity wind tunnel, where the interaction between the animal and odor plume could be described with better precision. This chapter describes the results of those free-flight experiments.
Since the effect of wind alone on the flight behavior of Drosophila has not previously been described, we first tested the impact of wind on flight trajectories in the absence of odor. We then compared the relative strength of wind-based orientation to a visually mediated orientation mechanism, object fixation, in structuring flight trajectories.
29
emphasis on the influence of intermittent olfactory stimulation on flight trajectories, we examined Drosophila flight within homogeneous odor plumes. The results of four experiments are thus presented. In all experiments involving odor, flies were restricted to one treatment per day to avoid odor contamination. The results presented in this chapter have been previously published (Budick and Dickinson, 2006).
3.1 Anemotaxis
3.1.1 Experimental design
Flies were flown in two conditions: (a) no wind, no odor, or (b) 0.4 m s-1
wind, no odor.
3.1.2 Results
In a low-velocity wind (0.4 m s-1), hungry flies readily took flight and flew
upwind in the wind tunnel. In still air, flies tended to remain in the vicinity of their emergence point into the tunnel (Fig. 3.1A), while in the presence of wind, flies were distributed relatively uniformly along the length of the wind tunnel (Fig. 3.1B). In both cases, flies preferentially flew down the center of the tunnel, reminiscent of the “centering response” described by Srinivasan and colleagues in honeybees (Srinivasan et al., 1991). Because this centering response could have resulted from an attraction to the visually conspicuous fly or odor releasing
30
31
distributed around an upwind orientation (Fig. 3.1E). To quantify these
distributions, we tested unimodal and bimodal fits of von Mises distributions to the mean heading data in the presence and absence of wind (Tables 3.1 and 3.2). In both cases, the data were significantly better fit by bimodal distributions, although in the absence of wind, the mode directed towards upwind
(-2.91±28.30º) accounted for only 58% of the data (Table 3.1) while in its presence, 93% of the data were captured by the mode with its mean at
1.46±13.67º (Table 3.2). Non-parametric circular tests indicated that the mean trajectory orientation did not differ between the two treatments (d.f.=1,
Y2=0.025, P=0.87), but headings were significantly more dispersed around their
[image:43.612.104.568.352.407.2]mean in still air (N=80, U=2730, P<0.0001).
Table 3.1. Fitting a mixture of von Mises distributions to mean heading vectors of flies in a -odor, -wind environment
Mode gof ( 2)
U P μ1 s p1 μ2 s p2
1VM 0.644 <0.01 1.26±178.3 74.51º 1.00 - - - 2VM 0.098 0.16 -2.91±6.55º 28.30º 0.58 177.72±8.83º 32.45 0.42
For each model, a goodness of fit was calculated and significance tested against a parametric bootstrap as described in the methods. The mean direction of each mode (μ±95%CI) as well as the angular standard deviation (s) and proportion of data fit by that mode (pn) are shown. The fitting of mixtures was stopped when the probability exceeded 10%. P represents the probability that the data are better fit by a model containing the corresponding number of modes than by a model containing additional modes.
Table 3.2. Fitting a mixture of von Mises distributions to mean heading vectors of flies in a –odor, +wind environment (details as in Table 3.1)
Model gof (U2) P μ
1 s p1 μ2 s p2
[image:43.612.102.577.611.671.2]32
3.2 Anemotaxis vs. object-mediated orientation
3.2.1 Experimental design
Flies were flown in two conditions, in both, a black post, 1.27 cm in diameter and spanning the full height of the working section, was positioned halfway along the length of the tunnel and 6.35 cm from the nearest wall. Flies were flown with (a) no wind, no odor, or (b) 0.4 m s-1 wind, no odor.
3.2.2 Results
The structure of the visual environment, particularly the presence of high-contrast objects, clearly plays a substantial role in shaping flight trajectories, even in the presence of odor (Frye et al., 2003). Because the anemotactic response is also able to exert a powerful effect on orientation, we tested the relative strength of this behavior, and the preference for conspicuous visual objects, in structuring flight. In the absence of wind, flies were clearly drawn to a black post positioned halfway along the tunnel’s length, with 26% of all transit in the wind tunnel occurring within a cylindrical volume of radius 14.5 cm
surrounding the post (from which distance, the post would subtend 5º on the fly’s retina (Fig. 3.2A). When the wind velocity was increased to 0.4 m s-1 however,
this attraction was largely suppressed by the anemotactic response, with only 11% of fly transit occurring within the same volume as the flies largely ignored the post while they flew upwind (Fig. 3.2B).
3.3 Flight in a narrow banana odor plume
3.3.1 Experimental design
Flies were flown in two conditions: (a) 0.4 m s-1 wind, clean air ribbon
34
3.3.2
Results
When exposed to a narrow plume of banana odor, flies rapidly took flight and flew upwind, generally landing on either the odor release tube or the screen at the upwind end of the wind tunnel. The highly reproducible flow structure within the wind tunnel allowed us to quantify fly behavior as a function of contact with the odor plume. The odor plume was modeled, based on smoke visualization experiments, as a 1 cm diameter cylinder that descended slightly along the length of the working section.
While the effects of plume contact were often dramatic, they were also somewhat variable, as indicated by the eight trajectory examples shown in Fig. 3.3. In some cases, flies proceeded relatively straight upwind while increasing their airspeed (e.g., Fig. 3.3A, D, F), while in others the trajectories were somewhat sinuous, or manifested looping turns during flight in a generally upwind direction (e.g., Fig. 3.3C, G). In some cases, upwind flight was also interrupted by cross-wind casting, as flies flew roughly perpendicular to the wind line, executing large magnitude turns (e.g., Fig. 3.3A, B, D). Despite this
variability, however, it is clear that flies tended to respond to plume contact, in the short term, by shifting from cross-wind to upwind flight and simultaneously increasing their airspeeds.
It is useful to visualize the effects of plume contact by plotting transit probability histograms of flight trajectories in the presence and absence of the narrow banana plume. We partitioned flight trajectories into “pre-contact” and “post-contact” fragments with histograms of the “post-contact” portions shown in Fig. 3.4. It is clear that flies were able to track the banana plume along its entire length as they followed it to its source (Fig. 3.4A, B). In a clean air plume, flies did not systematically fly in the center of the wind tunnel, indicating that this response cannot be explained by the turbulence created by the plume or by a visual, centering response (Fig. 3.4C, D).
38
(Fig. 3.5A), whereas post-contact flight was unimodally directed upwind (Fig. 3.5B). Because this cross-wind component tends to be obscured when taking mean trajectory headings (i.e., flight with iteratively reversing cross-wind legs yields a mean orientation of 0º), the instantaneous heading angles are plotted in Fig. 3.5. Because those headings are not statistically independent, tests on their distributions are not valid. Nevertheless, fitting a mixture of three Von Mises distributions to these data yielded modes oriented towards 0.00±18.16º, 84.77±49.35º and -80.89±41.79º; that is, either across or upwind. A non-parametric test of the dispersion of mean pre- and post-contact trajectory headings, based on all episodes of plume contact for each fly, indicates that precontact flight was significantly more highly dispersed around its mean of -4.98±47.21º than was flight following plume contact around its mean of 4.52±22.03º (N=138, U=5507, P<0.0001).
In addition to the significant effect on heading, flight following plume contact had significantly higher upwind velocity (pre-contact: 0.090±0.140 m sec -1, post-contact: 0.153±0.083 m sec-1) (t=4.53, d.f.=223.11, P<0.0001) and
airspeed (pre-contact: 0.55±0.11 m sec-1, post-contact: 0.59±0.08 m sec-1) (t=3.71,
d.f.=250.94, P<0.001), as well as being significantly closer to the plume (pre-contact: 0.053±0.024 m, post-(pre-contact: 0.037±0.023 m), (t=5.46, d.f.=273.31,
P<0.0001) (Fig. 3.5C). Thus, flies were able to track the odor plume while simultaneously increasing their flight velocities.
40
there were few consistent trends in trajectory structure either before or after “contact” with a clean air plume (Fig. 3.6B). This again suggests that the
behavioral responses observed in the context of the narrow banana plume were in fact the consequence of contact with an attractive odor.
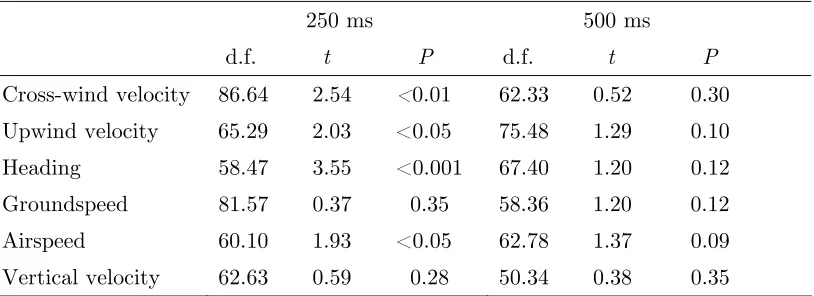
The short-term effects of plume contact on a variety of trajectory parameters were quantified in order to extract a profile of the mean plume contact response. The time-series averages for the first episode of plume contact by each fly, aligned relative to the moment of plume contact, are plotted in Fig. 3.7. It is apparent that while there are substantial changes in a variety of these parameters following plume contact, they are often accompanied by slower changes, with the same sign, in the control group. It probably should not be surprising that similar effects are evident in both groups, simply as a result of tunnel geometry. For instance, in both groups, cross-wind velocity apparently peaked at the time of plume contact. In order to encounter the plume, an insect flying upwind needs to displace laterally (or vertically, though that is apparently less common, see Fig. 3.6), yielding an increase in cross-wind velocity. This trajectory modification is likely to evoke a collision avoidance response as the fly approaches the tunnel wall, with the resulting turn tending to be biased towards upwind as a result of the anemotactic response described earlier.
Nevertheless, to test for significant differences between these two groups, we compared the changes from baseline, in all parameters, 250 and 500 ms after plume contact. These time points were selected since they represented the approximate latencies at which the changes in trajectory parameters were most apparent in the experimental and control groups respectively. In the presence of odor, flies significantly decreased their cross-wind velocity and increased their upwind velocity within 250 ms of plume contact, a period corresponding to roughly 50 wingbeats (Table 3.3). The combined effect of these responses was to orient the flies significantly more upwind. Flies also significantly increased their airspeeds during this “upwind surge.” Groundspeed and vertical velocity
meanwhile were not significantly changed relative to controls, suggesting
42
group in any of these metrics. Thus, while the experimental group manifested a rapid surge response to odor contact, the changes to the trajectory were
eventually matched by the control group, indicating that visual reflexes were able to produce a slower, “surge-like” response under the appropriate conditions. This visually mediated behavior is likely to also have been a component of the
[image:54.612.107.514.284.432.2]response to odor contact.
Table 3.3. Comparisons of changes in mean trajectory values from baseline in the narrow banana odor plume and a clean air control for six flight parameters at 250 and 500 following plume contact
250 ms 500 ms d.f. t P d.f. t P
Cross-wind velocity 86.64 2.54 <0.01 62.33 0.52 0.30 Upwind velocity 65.29 2.03 <0.05 75.48 1.29 0.10 Heading 58.47 3.55 <0.001 67.40 1.20 0.12 Groundspeed 81.57 0.37 0.35 58.36 1.20 0.12 Airspeed 60.10 1.93 <0.05 62.78 1.37 0.09 Vertical velocity 62.63 0.59 0.28 50.34 0.38 0.35
All values are calculated using one-tailed, heteroscedastic t-tests.
3.4 Responses to a homogeneous odor plume
3.4.1 Experimental design
Flies were flown in two conditions: (a) 0.4 m s-1 wind, no odor, or (b) 0.4
m s-1 wind, homogenous banana odor plume.
3.4.2 Results
44
a homogeneous odor cloud was superimposed on that wind stimulus, flies flew upwind with trajectories that were even less dispersed around their mean orientation of 0.49±21.98º than in wind alone (-1.16±31.16º; N=80, U=2995,
P<0.05) (Fig. 3.8A, B). Indeed these trajectories were directed the most
consistently upwind of those that we observed in any condition. While flying in the homogeneous plume, flies also significantly increased their upwind velocities relative to the clean air control (clean air: 0.053±0.105 m sec-1, homogeneous
cloud: 0.131±0.120 m sec-1) (d.f.=171.84, t=4.57, P<0.0001) (Fig. 3.8C). It
should be noted that while smoke visualization indicated that the plume had been mixed to the limits of visual resolution, it is possible that some fine structure remained intact.
The effects of the homogenous plume can be seen in a few “post-contact” trajectories (where contact is defined based on the position of the narrow plume) where flight tended to be oriented more directly upwind than in clean air (Fig. 3.9A, B). Further, flies in the homogenous plume rarely performed the cross-wind “casts” that were often conspicuous in the narrow banana plume (Fig. 3.9C). The fact that casts were apparently elicited in the presence of the narrow banana plume, and not in the homogenous cloud, suggests that they were not a consequence of sustained plume contact, but were instead causally related to plume loss.
3.5 Responses to pulsed and continuous plumes
3.5.1 Experimental design
Flies were flown in three conditions: (a) 0.4 m s-1 wind, clean air, pulsed,
large-diameter plume, (b) 0.4 m s-1 wind, banana odor, pulsed, large-diameter plume,
45
46
3.5.2 Results
Flies were allowed to fly in large-diameter pulsed or continuous odor
plumes, in order to test the effects of plume truncation on flight behavior. Pulses were generated for 1 second with a 50:50 duty cycle. Flies were significantly more likely to land on the plume source when flying towards a pulsed odor plume (40%) than towards a pulsed clean air control (14%), (d.f.=1, χ2=11.49,
P<0.001). Flies were equally likely, however, to land on the plume source regardless of whether the odor plume was pulsed or continuous (46%) (d.f.=1,
χ2=1.90, P=0.17).
In order to test whether plume truncation was associated with cast initiation, casts were defined as a series of six consecutive velocity vectors with angles whose absolute values were between 50º and 130º. Flies were also required to travel at least 3 cm across the tunnel during a cast. While this definition is somewhat arbitrary, it captures the qualitative change in trajectory structure that an observer can subjectively identify as a cast. An automated
implementation of this algorithm searched for casts that occurred following truncation of the pulsed plume, and for casts that were initiated while the fly remained within the continuous plume, allowing for the possibility that the cast itself may have carried the animal outside of the plume. The algorithm only searched for casts that occurred after the first episode of plume contact for each fly.
49
to cast initiation following an equal duration spent in a continuous plume prior to “pseudo-plume truncation” (Fig. 3.11B) We further required that casts
initiate with a latency of at least one frame (16.7 ms) following plume truncation in order to ensure that the animal had exited the plume.
Following actual or pseudo-plume truncation, some animals landed, were lost by the visualization system, or had already initiated casting, and thus were no longer “eligible” to initiate casting according to the definition provided above. Flies could also become ineligible to cast if, in a pulsed plume, they encountered a subsequent odor pulse, or exited a continuous plume. Thus, we calculated the probability of cast initiation in 50 ms bins following plume truncation only among those flies that were still competent to initiate casting. That is, we divided the number of casts initiated in each 50 ms bin by the number of flies that had not yet been excluded for any of the above reasons (Fig. 3.11D).
Flies were significantly more likely to initiate casting in the first second following plume loss due to plume truncation than due to pseudo-plume
truncation of a continuous plume (d.f.=1, χ2=8.96, P<0.01). Following plume
truncation, 17 flies (29.6%) casted within 1000 ms of plume loss with a mean latency of 330±140 ms (Fig. 3.11D). In the continuous plume, only 3 flies (3.6%) initiated casting over the same duration. We carried out an analogous analysis within flies by comparing the probability of cast initiation following plume truncation to that following plume contact (while the fly still remained within the plume). The probability of cast initiation following plume contact was then calculated in every 50 ms bin following contact for those flies that had not yet suffered plume truncation. Flies were significantly more likely to initiate casting following plume loss than plume contact (d.f.=1, χ2=6.66, P<0.01) with only three flies (7.7%) casting within 1000 ms of plume contact.