© 2019, IRJET | Impact Factor value: 7.211 | ISO 9001:2008 Certified Journal | Page 7928
Disease Prediction for the Wearable Sensor Data using ANN and Fuzzy
Classification
Vidya Patil
1, Vidhi Agarwal
2, Shivi Bahuguna
3, Manoj Kumar
4, Tanushree Upadhay
51
Professor, Dept of Computer Engineering, DIT Pimpri
2,3,4,5Student, Dept of Computer Engineering, DIT Pimpri
---***---Abstract -
Health monitoring through the wearable sensoris very common in today's life and it becomes a kind of trend. Many wearable sensors are like smart watches, Activity trackers and many more provides the health parameters like pulse rate, Blood pressure, calorie burnt and many more on a daily basis or on fixed time slot. Just by monitoring the health parameters users or patients cannot predict their health status for the future nor they predict any ill health conditions that eventually lead to some diseases. Many methodologies are existed to predict a particular disease based on the past dataset using the deep learning technique. Most of these techniques using the huge amount of data for deep learning to predict one or two types of diseases. There is a need of the hour to predict the disease proneness using the wearable sensor's moderate amount of data. So that the users of these devices can have more chance to improve their health conditions rather than just monitoring. So as a tiny step towards this proposed model uses the K means clustering and Artificial neural network to predict the disease proneness status and this process is powered with Fuzzy Classification model to classify the data into different diseases.
Key Words
:
Wearable Sensor data, K means Clustering,
Artificial neural network, Fuzzy Classification.1. INTRODUCTION
The objective of prognostic analytics is to assist organizations modification data into vital bits of knowledge which will enhance the business selection. Increased worldwide competition and therefore the demand for reparable development are pushing progressively organizations to regulate analytical technologies for business insights. Healthcare organizations like never before area unit being seen using analytics to devour, differentiate and apply new insights from data. Innovative systematic methods area unit being utilized to drive clinical and operational enhancements to fulfill business challenges. During the last few decades, the advances in high-throughput technologies have led to an explosion in the availability of health data, which subsequently increased the understanding of how those data can be utilized to improve human life. The analysis of such a huge amount of data can help us in
revealing and explaining the complex mechanisms that characterize biological and medical conditions. However, this goal can only be achieved if appropriate analytical tools are designed to fully exploit the large quantity of available information and extract relevant knowledge.
Statistical-based and computational methodologies have been extensively applied for data analysis in the field of health data, trying to underline difficult biological and medical processes. However, due to the simplicity of these approaches (e.g. linear models or univariate techniques), the amount and the kind of information that can be extracted from the data is limited. Machine learning represents a powerful alternative that can offer better, more robust and flexible solutions and is currently rising in the field of health data. The advantageous position of machine learning techniques is given by the use of complex multivariate knowledge representations that allow, when mining the data, to discover interesting patterns that are often missed by simpler approaches. Thanks to such a rich and diverse knowledge representation, machine learning methods are well suited for the analysis of biomedical data that often are characterized by: large dimensionality (high number of variables), class imbalance distribution (e.g. many more healthy patients than sick), vast number of samples, information collected from different sources etc.
Electronic health records (EHR) since adopted by large healthcare organizations in the last decade, has enabled the accumulation of large electronic patient data. EHR has helped researchers use traditional statistical approaches such as logistic regression or random forests for computational healthcare. However, with the growing size of patient records and the development of powerful computing resources, it seems that now is the right time to introduce deep learning techniques to computational healthcare. However, in healthcare, the interpretation of the model outcome is vital. Therefore, although typical deep learning models show impressive predictive performance, their black box nature makes it difficult for them to be readily used in healthcare. Deep learning models need to be interpretable without sacrificing its prediction accuracy in order to be actively adopted in healthcare
© 2019, IRJET | Impact Factor value: 7.211 | ISO 9001:2008 Certified Journal | Page 7929
collection of data, data sharing, and data analytics. Differenttechnologies are used for data collections and data sharing of medical records. The generated data can be utilized to extract useful data for finding a disease that can be occurring to a patient in the future. The concealed information in the healthcare data is utilized for advance decision making for patient health. The major challenge is how to extract the information from these data because the amount is very large so some data mining and machine learning method can be used. If the illness is often foreseen than early treatment are often given to the patients which may scale back the chance of life and save a lifetime of patientsand price to get treatment of diseases can be reduced up to some extent by early recognition. The electronic health record created the abundance of new data about patients, which is useful in the understanding of human health.
Disease prediction by applying data mining and machine learning on data of patient treatment history and health record is an ongoing struggle for the past decades. Lots of works in this field applied data mining methods to medical profiles or pathological information for prediction of particular diseases. These techniques tried to predict the happening of disease.
This research paper dedicates section 2 for analysis of past work as literature survey, section 3 deeply elaborates the proposed technique and whereas section 4 evaluates the performance of the system and finally section 5 concludes the paper with traces of future enhancement.
2. LITERATURE SURVEY
This section of the literature survey eventually reveals some facts based on thoughtful analysis of many authors work as follows.
Prof. Dhomse Kanchan B. and Mr. Mahale Kishor M. [1] present heart disease prediction SVM, by using Decision tree and Naive Bayes. These algorithms applied on dataset with or without using PCA. They used PCA to minimize the attributes number. SVM outperforms Decision Tree and Naive Bayes after lesser the dataset size. A GUI system software may be constructed using SVM and this dataset to expect the possibility of cardiovascular disease in a patient and for diabetes facts prediction, the main goal of this paper is to are expecting diabetes sickness by using WEKA data mining tool. They used WEKA tools to implement their algorithms and to analyze their algorithm accuracy. These algorithms compare classifier accuracy to every other on the premise of correctly classified instances, time taken to build model, mean absolute error and ROC place. So, the usage of exceptionally observations, they can conclude that most ROC area means method great predictions performance as compared to different algorithms.
Dinu A.J., Ganesan R, Felix Joseph and Balaji V[2], presents an idea of recent artificial intelligent systems available for detection and diagnosis of different diseases. The system analyzes the relevant medical imagery and associated point data to make an inference that can help the doctor make a decision in a clinical situation. The AI system just works as an interface between clinical image flow and archived image data. The AI system does not require application-specific engineering to apply it. The various disease diagnosis using AI systems can increase the speed of decision making, and it can lower the false-positive rates. It can be clearly observed that different AI algorithms provide enhanced accuracy on detection of various diseases.
Po-Han Chiang and Sujit Dey [3] proposed a data-driven model to investigate the effect of individual health behavior on BP using devices that are wearable and BP monitors. Their ML model can provide not only daily prediction of SBP and DBP but also importance score of health behavior factors on individual’s daily BP. By extracting the time-series related data and integrating the RF depend feature selection technique, they enhance the prediction accomplishment of the original RF model. They proved that their method outperforms present methods in terms of MAE and MSE. They also proved that if users changed their health behaviour as per suggestion given by their model, significant changes in BP were noticed.
Norazhar Abu Bakar and A. Abu-Siada [4] proposed a new fuzzy logic approach that utilizes data gathered mainly from insulating oil assessment such as furan, DGA, interfacial tension (IFT), water content, and operating temperature in evaluating the remnant life and health condition of power transformer. The key advantage of the model proposed over previously published models is that all input parameters proposed in the model can potentially be measured on-line or on-site which facilitates a proper and timely maintenance action depend on the model output. The model also considers the rate of increase of key parameters that significantly affecting transformer health condition such as 2-FAL, carbon monoxide (CO), and IFT. As reported in the generation rate of furans derivatives in transformer oil is more important in identifying paper health condition than its absolute level.
© 2019, IRJET | Impact Factor value: 7.211 | ISO 9001:2008 Certified Journal | Page 7930
estimates - Lift, Leverage and P-Value, it is understood thatthe proposed technique has given a good model. This model is able to predict all the types of outliers present in PID data set. Hence, the proposed technique is able to figure out the exact risk factors like Age, Glucose, DPF, BMI, and BP along with the correct hazardous values of it to predict pre-diabetes in an improved way than the crisp method
Fahad P K and Pallavi M S [6] proposed CNN-MDR with the help of back propagation algorithm depend on CNN (convolutional neural network). In which the hospital data is taken and analyzed. In the market there is only single type data is being analyzed, now in this they have seen that two types of data is being used, that is both unstructured and structured data. They are able to achieve a prediction rate of 96.4% and in the future, they are even trying to enhance the prediction rate.
Alhaytham Y. Alqudsi and Ayman H. ElHag [7], introduced an approach for reducing the cost of computing the HI. This was done by reducing he required condition monitoring test features. Exhaustive feature-based search validated the use of ANN in a feature reduced platform to predict the HI value. Moreover, the search technique indicating the capability of the predictor model to sufficiently use a single feature such as furan or IFT to predict the HI value with an acceptable accuracy. Finally, the reduced features resulted in significant reduction of the total cost of computing the HI in the TAM industry.
Zeyu Zheng and Karen Ruggiero [8] presents comparison between four ML models to find out obesity in high school students in Tennessee using their health-related risk and protective factors as reported on the YRBSS. The results show that, compared to logistic regression, IDT, weighted KNN, and ANN models yielded better performance in classifying and predicting the obesity. Although this study examined adolescent obesity in Tennessee, the ML models that have been built and presented can be applied and used to further their understanding of fatness in other southern states, where the rate of fatness among high school students has also increased. The findings of the present study suggest that healthy lifestyle habits, including regular physical activity and healthy eating, can lower the danger of obesity and related health conditions between high school students.
Thao P. Ho-Le, Jacqueline R. Center, John A. Eisman, Tuan V. Nguyen, and Hung T. Nguyen [9] introduced a series of ANN (artificial neural network) models for finding hip fracture in postmenopausal women. The model with BMD calculations and non-invasive clinical risk factors yielded the highest discrimination and accuracy. Thus, neural networks can predict fracture for individual women more accurately than the existing predictive models like FRAX® and the Garvan Fracture Risk Calculator. In future, they will validate their model in an external cohort. They are planning to incorporate genetic variants as input variables for predicting
hip fracture, as approximately 50% of hip fracture susceptibility is attributable to genetic factors. They will also consider the application of deep learning to enhance the predictive performance of fracture prediction.
Kumari Deepika and Dr. S. Seema [10] presents the effective technique to find the chronic disease by data mining of past health records. They used SVM, Naïve Bayes, Decision Tree and ANN classifiers to diagnose heart disease and diabetes. They also present the different classifiers comparative study to measure the performance of their system based on accuracy.
Muammar Sadrawi, Jiann-Shing Shieh, Shou Zen Fan, Chien Hung Lin, Koichi Haraikawa, Jen Chien Chien and Maysam F. Abbod [11] presents the evaluation of the intermittent blood pressure has been investigated. With the input of the extracted PPG continuous signal by multiscale entropy, the diastolic and systolic blood 2016 IEEE EMBS Conference on Biomedical Engineering and Sciences (IECBES) 358 pressures are predicted. The experimental result reveals that the ensemble model produces better result than the single best model of neural networks. The ensemble model may become a better model while facing the variety of the testing data. This study has limitation in recognizing the sudden big changes in the signal both for training and testing.
Zhe Yang, Piero Baraldi and Enrico Zio [12] present a BP-ANN based and an ELM-based direct prognostic model for RUL prediction. Run-to-failure turbofan engine trajectories have been used for the comparison of the model performances from the point of view of RUL prediction accuracy, stability and training and execution times. The analysis of results prove that the ELM depend model performance is lower than BPANN model in stability and accuracy terms. Thus, the ELM-depend model can be attractive for the development of prognostic models when it is required to use prognostic models easy and fast to train. unavoidable.
[image:3.595.310.559.589.748.2]3. PROPOSED METHODOLOGY
© 2019, IRJET | Impact Factor value: 7.211 | ISO 9001:2008 Certified Journal | Page 7931
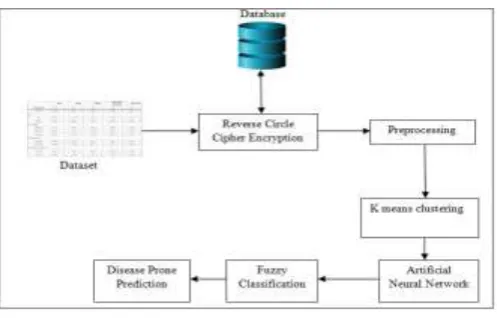
The proposed methodology of disease prediction using thedaily data collected through the fitness wearable sensors is depicted in figure 1. And the methodology of the proposed model is described in the below mentioned steps.
Step 1: Dataset collection and storage : A fitness dataset is
collected through the URL
https://www.kaggle.com/aroojanwarkhan/fitness- data-trends . The dataset contains some attributes which are measured through the wearable devices. The dataset is stored in a workbook format that contains some attributes like Id, date, Step count, mood, Calories burned, hours of sleep, bool of active, weight in kg and BMI. The stored data in the workbook are read into a double dimension list using the JXL API and then it is stored in the database by encrypting the same using Reverse circle cipher algorithm.
In the Reverse circle cipher algorithm the plain text is divided into block size of 10 and these blocks are stored in a list. Then this block string is rotated based on the list indices of the blocks. These rotated blocks are replaced with the other ASCII bytes to convert the plain text to cipher text. The concatenated cipher text blocks yields the complete cipher text for the input plain text.
Step 2: Preprocessing- This is the step where the stored encrypted data is decrypted and the rows are selected for the user defined ID of a particular user. Out of this data, selected attributes are identified and stored in a list to call as preprocessed list. This preprocessed list contains four attributes like Step count, Calories burned, hours of sleep and BMI.
Step 3: K Means Clustering - The preprocessed list is subjected to cluster using the K means algorithm and the steps involved in this clustering is explained with the below mentioned steps.
Distance Evaluation - The preprocessed list rows tend to evaluate the distance between all other rows for the four selected attributes. The distance is evaluated for a row using Euclidean distance is, then appended at the end of the row to call as the RD. The Average of all row distances RD is termed as the Average Distance of the preprocessed list to refer as ADIST.
Sorting - This preprocessed list, which is appended with the RD is now sorted in ascending order using the bubble sort technique.
Data point selection - Random data points are selected based on the percentage of the data size. These data points are normalized according to dataset size to identify the number of cluster centers , then these data points are stored in a list.
Boundary Formation - To form the boundaries of the clusters first the row distance RD need to extract for the estimated data points. These RD is referred as the centroids and then
these centroids are used to evaluate the boundaries of the clusters using the ADIST which can be shown in the below equation 1.
____(1)
Cluster Formation - Once these boundaries are formed, then the clusters are formed according to these boundaries for the preprocessed list which is appended by RD .
Step 4: ANN- The created clusters are subjected to form the neurons based on the mean and standard deviation of the RD. Then for the three conditions of the mean and standard deviation three neurons are formed for each of the clusters. Then these neurons are set to estimate the probability of the disease prone row of the neurons. And this can be shown with the below mentioned algorithm 1.
Algorithm 1: Disease Probability List Formation
// Input : Neurons NU
// Output : Disease Probability List DL Function : disease_Probability(NU) Step 0: Start
Step 1: for i=0 to size of NU Step 2: SG = NUi
Step 3: for j=0 to size of SG Step 4: ROW=SGj
Step 5: Count =0
Step 6: for k=0 to size of ROW
Step 7: If (ROWK ∈ PRL ) [ Protocol List ] Step 8: count++
Step 9: End for
Step 10: If ( Count > = 2 ) Step 11: DL= DL+ ROW Step 12: End for Step 13: End for Step 14: return DL Step 15: Stop
___________________________________________
Step 5: Fuzzy Classification and Disease Prediction - The disease probability list is used to find the similar data in the second half of the preprocessed list to ensure the disease proneness rows are existed in the recent days. And a list is prepared for this to refer as the optimized list.
This optimized list is used to extract the four parameters from its each row to evaluate the respective counts. For example, if step count is less than 300 then a count is estimated as SC, if calorie burned is less than 20 then a count is estimated as CB. If hours sleep is less than 5 then a count is estimated as HS. If the BMI is less than 18 or greater than 25 then a count is estimated as BM.
© 2019, IRJET | Impact Factor value: 7.211 | ISO 9001:2008 Certified Journal | Page 7932
which are equally distanced from 0 to size of optimized set.And then the respective count of SC,CB,HS and BM are subject to find their position in the fuzzy crisp set. Once their indices are identified, they are subjected to decide the respective diseases like Diabetes, Insomnia, Obesity , Anxiety and Hypertension.
4. RESULT AND DISCUSSION
The proposed system of disease proneness prediction is deployed in windows machine. The Machine is equipped with a Pentium processor of Core i5 and Primary memory of 6GB. To develop the model Java programming language is used with Netbeans 8.0 as the IDE and Mysql as the Database Server. The model is put under hammer for conducting some experiment to measure the effectiveness of the proposed model as described below.
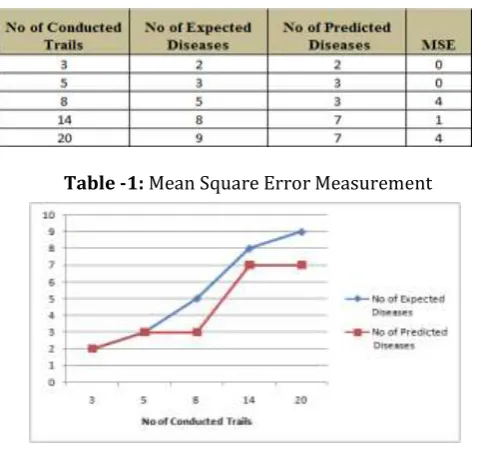
To measure the effectiveness of the proposed model Root mean square (RMSE) is used. RMSE is defined as the error rate in precision between the two continues correlation entities. The two continues correlation entities are the Actual disease proneness and the predicted Disease proneness. To measure this more effectively, experiment is conducted to record the output as shown in the below table 1. And RMSE can be represent with the below equation 2.
___(2)
Where
- Summation
( Zfi - Zoi )2 - Differences Squared for the Expected Diseases and Predicted Diseases
N - Number of Trials
[image:5.595.37.276.523.748.2]
Table -1: Mean Square Error Measurement
Figure 2
: The Graph between the Expected Diseases v/sPredicted Diseases
5. CONCLUSIONS
The proposed model of disease prediction for the dataset of the wearable sensor devices is carried out for the 21 individuals. The model efficiently encrypts the data to store in the database to enhance the security. And the proposed model uses the K means clustering for the purpose of semantic grouping of the disease prone factors in the dataset. Using of the Artificial neural network and Fuzzy classification yields the best possible results for the input data. On further evaluation of the system as discussed in the past section, it yields around 1.34 of RMSE , which is indeed a good outcome in the first attempt of the proposed technique.
The proposed system can be enhanced in the future for using more attribute of the real time sensors like ECG,EEG and many more.
REFERENCES
[1] Hualong Ma, Xiande Wang, Jianfeng Hou and Yunjun Lu, “Study Of Machine Learning Algorithms For Special Disease Prediction Using Principal Of Component Analysis”, DOI: 978-1-5090-0467-6/16/$31.00 ©2016 IEEE.
[2] Dinu A.J., Ganesan R, Felix Joseph and Balaji V, “A study on Deep Machine Learning Algorithms for diagnosis of diseases”, International Journal of Applied Engineering Research ISSN 0973-4562 Volume 12, Number 17 (2017) pp. 6338-6346.
[3] Po-Han Chiang and Sujit Dey, “Personalized Effect of Health Behavior on Blood Pressure: Machine Learning Based Prediction and Recommendation”, DOI: 978-1-5386-4294-8/18/$31.00 ©2018 IEEE.
[4] Norazhar Abu Bakar and A. Abu-Siada, “Fuzzy Logic Approach for Transformer Remnant Life Prediction and Asset Management Decision”, IEEE Transactions on Dielectrics and Electrical Insulation Vol. 23, No. 5; October 2016.
[5] A. M. Rajeswari, M. Sumaiya Sidhika, M. Kalaivani and C. Deisy, “Prediction of Prediabetes Using Fuzzy Logic Based Association Classification”, DOI: 978-1-5386-1974-2/18/$31.00 ©2018 IEEE.
[6] Fahad P K and Pallavi M S, “Prediction of Human Health using Machine Learning and Big Data”, DOI: 978-1-5386-3521-6/18/$31.00 ©2018 IEEE.
© 2019, IRJET | Impact Factor value: 7.211 | ISO 9001:2008 Certified Journal | Page 7933
[8] Zeyu Zheng and Karen Ruggiero, “Using MachineLearning to Predict Obesity in High School Students”, DOI: 978-1-5090-3050-7/17/$31.00 ©2017 IEEE.
[9] Thao P. Ho-Le, Jacqueline R. Center, John A. Eisman, Tuan V. Nguyen, and Hung T. Nguyen, “Prediction of Hip Fracture in Post-menopausal Women using Artificial Neural Network Approach”, DOI: 978-1-5090-2809-2/17/$31.00 ©2017 IEEE.
[10] Kumari Deepika and Dr. S. Seema, “Predictive Analytics to Prevent and Control Chronic Diseases”, DOI: 978-1-5090-2399-8/16/$31.00_c 2016 IEEE.
[11] Muammar Sadrawi, Jiann-Shing Shieh, Shou Zen Fan, Chien Hung Lin, Koichi Haraikawa, Jen Chien Chien and Maysam F. Abbod, “Intermittent Blood Pressure Prediction Via Multiscale Entropy And Ensemble Artificial Neural Networks”, DOI: 978-1-4673-7791-1/16/$31.00 ©2016 IEEE.