https://doi.org/10.1007/s10921-019-0651-0
Multiple Wavemode Scanning for Near and Far-Side Defect
Characterisation
L Xiang1·R S Edwards1
Received: 25 September 2019 / Accepted: 27 December 2019 © The Author(s) 2020
Abstract
The combination of ultrasonic inspections using different wavemodes can give more information than is available with single mode inspection. In this work, the response of shear and Rayleigh waves to surface-breaking defects propagating on the near-side and far-side of a sample is investigated. The directivity of shear waves generated by a racetrack coil electromagnetic acoustic transducer (EMAT) is identified and used to set an ideal separation for a pair of transmit-receive EMATs. Defects are indicated by a reduction in the transmitted Rayleigh wave amplitude, and by blocking of the shear wave. Used together, these can identify features in the bulk wave behaviour which are due to near-face surface-breaking defects, and give a full picture of both surfaces. By using a combination of the two wavemodes, the angle of propagation and length of any near-side defects can additionally be identified. A scanning method for samples is proposed.
Keywords Ultrasonics·EMAT·Directivity·Surface defect detection
1 Introduction
Non-contact ultrasonic testing offers several benefits over standard contact ultrasonic non-destructive testing (NDT) techniques, with the potential of repeatable performance through removal of variations in couplant, and simplified large field automated scans, albeit often with a reduced effi-ciency [1–3]. Electromagnetic acoustic transducers (EMATs) are non-contact ultrasound transducers and are gaining more attention. An EMAT typically consists of a permanent mag-net to introduce a static magmag-netic field, and a coil of wire through which an alternating current is pulsed [2]. This cur-rent pulse induces a dynamic mirror curcur-rent in a nearby electrically conducting sample. In non-magnetic materials, the Lorentz force mechanism is used to generate and detect the elastic wave motion, with the generation force given by
F=J×B, (1)
whereJis the induced eddy current density andBincludes the external static magnetic field and the coil self-generated dynamic field. The ultrasonic wavemodes which are
gener-B
R S Edwards1 University of Warwick, Coventry, UK
ated or detected depend on the configuration of the magnetic field and the coil.
Various ultrasound techniques have been developed for testing samples for surface-breaking defects. For near-side defects (where defect and transducer access is from the same side of the sample) Rayleigh waves have shown great promise [3–8]. Reflected and/or transmitted waves can be used to give a calibration for defect depth [4,8]. The transmitted wave amplitude drops as the defect depth increases, with the exact behaviour dependent on the bandwidth of the Rayleigh wave. In addition, enhancement of the signal occurs at a defect due to constructive interference of the incident, reflected and mode-converted waves, and can be used as a fingerprint of a defect [9,10]. The geometry of the defect, for example if it is angled relative to the surface, has a significant effect on the transmission and enhancement [11,12]. Phased arrays have been developed for detecting near-surface defects, using a wedge to generate a Rayleigh wave [13].
is imaged [16–19]. A line-focusing shear-vertical (SV) wave EMAT has recently been proposed for targeting small flaws positioned on the material back wall, using reflections from the defect back to the transducer [20,21].
A key advantage of EMATs is their adaptability in design, including that multiple wavemodes can be generated simul-taneously. In some cases this can offer unwanted features that need to be removed [14], however, by combining information from multiple wavemodes more information can be obtained about the sample. In this paper we implement scanning using a Rayleigh and a shear wave to identify surface-breaking defects on two sides of a sample. The transmitted Rayleigh wave can be used to measure the depth of the near-side sur-face defect, while blocking of the shear wave can be used to indicate a far-side defect, using standard methods. When used in combination, however, the behaviour of the Rayleigh wave can also be used to classify a defect as near- or far-side, enabling spurious results from the shear wave interacting with a near-side defect to be corrected for. In addition, any asymmetry in the blocking of the shear wave by a near-side defect can be used to characterise its depth and angle of prop-agation, giving a more accurate measure than when using the Rayleigh wave alone.
Earlier papers have studied the directivity of a range of EMAT coil designs, primarily considering spiral, linear, meander, or coils generating SH waves [22–26]. Hu et al. considered a racetrack design [24], however, they applied an aperture to the coil so that only a linear part of the design was active. A similar racetrack coil was used by Wu et al., but they used a compound magnet such that their magnetic field switched direction on either side of the coil, resulting in a force than similar to that generated by a linear coil [25]. This paper is split into the following sections: directiv-ity measurements and modelling are presented to ensure a suitable separation of EMATs; confirmation of the abil-ity of each wavemode to characterise defects; analysis of defects detected during a B-scan; and use of both wavemodes together to fully characterise the near-side defects. This con-siders a sample where defects may occur on both faces, but access is limited to a single side.
2 The transmit-Receive EMAT System
2.1 EMAT Configuration
The EMAT design considered in this paper is illustrated in Fig.1a and b. For the generation EMAT, copper wire of diam-eter 0.1 mm was wound into a racetrack coil shape, with the coil centered underneath a cuboidal NdFeB block magnet of side lengths 25 mm. The current flow direction is reversed on either side of the centre of the coil and hence a dipolar body force is induced. The width of the generation coil was 1.5 mm.
Detection EMATs used two different designs; a linear coil for directivity measurements [22], and a matched racetrack design to the generation coil for scanning bar samples, to ensure the same spatial frequency response [27]. Both were hand-wound using 0.08 mm diameter wire. For both linear and racetrack detection coil designs, EMATs sensitive to pri-marily either the in-plane (IP) or out-of-plane (OP) velocity components were used [4,28]. These are produced by careful choice of the direction of the magnetic field from the perma-nent magnet. For a magnetic field directed into the sample, perpendicular to the surface, wave motion in the in-plane direction along the sample will give a Lorentz force which is parallel to the EMAT coil, and hence will give a detectable current. Conversely, for a magnetic field directed parallel to the sample surface in the direction of wave propagation, a suitable current direction will be generated by wave motion which is out-of-plane (perpendicular to the sample surface). All samples tested were aluminium, with the sample and machined surface cracks detailed in the relevant sections. The surface was smooth but not polished, with the top 3 mm machined off to remove the different grain structure at the sur-face. The Rayleigh wavelengths used are significantly larger than any roughness. The generation EMAT was driven by a high energy pulser built in-house with a maximum voltage output of approximately 600 V. This pulser enables control of the centre frequency (20 kHz to 10 MHz) and the number of cycles in the sinusoidal driving pulse; for normal oper-ation, either 1-cycle (broadband) or 3-cycles (narrowband) was used. The captured signal was passed through an ampli-fier and a 2.5 MHz low pass filter before being recorded by an oscilloscope, with 32 times averaging. The racetrack EMAT design can generate several different wavemodes. Figure1c shows a typical A-scan obtained from the EMAT system on an aluminium bar sample, for three-cycle operation at 1.0 MHz. The Rayleigh and shear waves have a high signal to noise ratio and are well separated in time for the chosen transducer separation, thus analysis of each can be done sep-arately.
2.2 Shear Wave Directivity
To optimise the set-up of the transducer pair, the direc-tivity of the shear wave generated by a racetrack coil was first investigated. Due to the antisymmetry of the Lorentz force across the central part of the racetrack coil, similar to a 2D view of a spiral coil, the in-plane component of the shear wave will have zero amplitude directly opposite the generation EMAT. A critical angle is expected where there is maximum amplitude due to constructive interference of the shear and head waves [22].
Fig. 1 Schematic of racetrack EMAT.aTop view of coil,bcut-through of EMAT.cExample A-scan.Riis the incident Rayleigh wave andS Sis the shear wave reflected from the far-side of the sample
Fig. 2 Experimental set-up for measuring the directionality of shear wave. OP and IP refer to the out-of-plane and in-plane directions relative to the sample surface
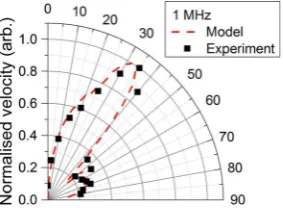
Fig. 3 Normalised shear wave directionality pattern of the racetrack coil at 1 MHz
Fig.2, operated at 1 MHz. A semi-cylindrical aluminium sample with a 70 mm radius was used for the test. The generation EMAT was positioned at the centre of the sam-ple flat surface, and the linear-coil detection EMAT was moved around the curved side of the sample. Experimen-tal results are plotted in Fig.3. Note that the waves will be bidirectional due to the symmetry of the EMAT; as the set-up used is pitch-catch this will not cause any issues with the experiment. The commercial finite element (FE) package PZFlex was used to verify the beam profile. An iden-tical two dimensional sample was modelled, quadrilaterally
meshed with an element size of 75μm (approximately 21 elements per wavelength when the frequency is 2.0 MHz). The racetrack coil was modelled as an ideal pressure source, with the pressure applied identically to each element over a length matching the width of the coil used in exper-iments. Each load was defined as a standard sinusoidal burst with three periods and 1.0 MHz central frequency. The modelled x and y velocity data were output from the model, and the in-plane and out-of-plane velocity compo-nents relative to the curved surface were calculated at each detection position from these two orthogonal velocity out-puts. Figure3shows that there is overall a good agreement between modelling and experimental results. The OP sig-nals show primarily noise, as expected for a shear wave. The IP signals show a peak at around 30-40◦ for operation at 1 MHz.
This confirms that a racetrack coil is able to provide a shear wave where the majority of the energy is directed at an angle of 30–40◦ relative to the sample surface. This direc-tivity can be used to optimise the separation between the transmit-receive EMAT pair for a given sample thickness to ensure the largest signal is obtained, with a limitation on the minimum separation and angle; a sufficient sep-aration is required such that the wave arrival times are outside the dead-time following the generation pulse, and to ensure that the Rayleigh and shear waves are separated in time.
[image:3.595.85.516.53.158.2] [image:3.595.53.290.205.375.2] [image:3.595.100.242.428.532.2]corre-Fig. 4 EMAT separation analysis.aSchematic of the testing set-up.bMagnitude of the shear wave for in-plane velocity component
sponds to an angle range of 36◦ – 43◦, in agreement with the directivity and with good wave separation. Some fre-quency dependence was observed. The transducer separation was set as 102 mm for all further experiments, correspond-ing to a 40.3◦ incident angle for a 60 mm thick bar. Only the IP detector was used for the following experiments as this gave a good signal to noise ratio for both wave-modes.
3 Calibration of Surface Defect Detection
It is essential to calibrate the EMAT behaviour, and two methods which are reported in the literature were used. The depth calibration curve had to be obtained for the EMATs and frequencies of operation, while the thresh-old value to be used for shear-wave analysis was also tested.
3.1 Near-Side Defects: Rayleigh Transmission
Figure 5 shows an example of such a calibration for the EMATs used here, for 3-cycle driving frequencies of 0.6 MHz
Fig. 5 Depth gauging using Rayleigh wave. Normalised peak to peak value of the transmitted Rayleigh wave for different crack depths
and 1.0 MHz. This shows that the range of depth sensitiv-ity depends on the frequency chosen, due to the different Rayleigh wavelengths.
3.2 Far-Side Defects: Blocking of Shear Wave
Figure6a illustrates the ray path of the shear wave, showing the shadow region where direct reflections cannot reach the detection EMAT, and no signal is received at the expected arrival time [16]. The crack depth affects the duration of the shadow region, with the depthdrelated to the length of the regionxby
d = x
2 tanθ, (2)
[image:4.595.86.511.56.215.2] [image:4.595.99.244.569.685.2]Fig. 6 Far-side defect detection. aBlocked region.bNormalised peak to peak voltage of the shear bulk wave for defects of depths
d=15 mm andd=4 mm for two frequencies. The x-axis corresponds to position relative to the crack centre
Fig. 7 EMAT scanning path in dual-wave mode, and defect geometry
Fig. 8 Section of the B-scan over the near-side surface angled defect.aShows the time period between 32.27 and 42.8μs, containing the Rayleigh wave, whilebshows the time period between 48.12 and 58.65μs, containing the shear wave
4 Double-Sided Defect Detection via Dual
Wavemode Operation
The strength of the technique comes from combining results from both wavemodes in order to obtain more information than when using just a single mode. To demonstrate this, a sample with machined defects on both sides was used. The sample is shown in Fig.7, with an angled near-side and a vertical far-side defect. The EMAT pair was scanned using an X-Y scanning stage with a step size of 0.5 mm. Platform control and data acquisition were achieved through a Lab-VIEW programme. A 1 MHz single cycle pulse was used to drive the generator, chosen to give good time resolution for the waves.
4.1 B-Scans from Automated Scanning
The results are presented as B-scans in Figs.8and9, with the colour scale corresponding to signal amplitude (normalised).
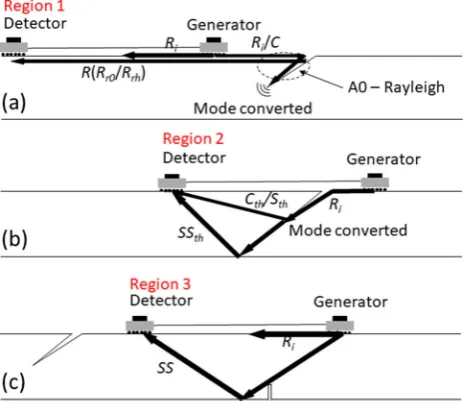
The B-scans are separated into four; two time regions to show in detail the arrival times of the (a) Rayleigh and (b) shear waves, and two spatial regions to show the interaction with the near- and far-side defects. Arrival times of different wave-modes are plotted on Fig.8in region 1 (where both EMATs are on the same side of the near-side defect prior to inter-action), region 2 (where the EMATs are on opposite sides of the near-side defect) and region 3 (where the EMATs have both passed over the near-side defect).r corresponds to a reflected wave,i to an incident wave,t to a transmitted wave, and h to a mode converted wave. The effects of the near-side defect are clearly shown in Fig.8by the reduced amplitude in both the Rayleigh and shear waves, and the far-side defect in Fig. 9 by the blocked shear wave. The behaviour of the Rayleigh wave in the region of the defect is as expected [10–12]. In region 1, the incident and reflected Rayleigh waves Ri and Rr0/Rr h (denoting reflection as a
[image:5.595.120.546.55.461.2]Disper-Fig. 9 Second half of the B-scan, over the far-side crack, foraRayleigh wave region,bshear wave region
Fig. 10 Wave paths used for calculations for B-scan arrival times
sive features have been highlighted in the dashed circle, due to the mode conversion between the Rayleigh and a Lamb-like mode (A0—Rayleigh) within the wedge region [10]. In region 2 the Rayleigh wave is mostly blocked, but some mode-converted waves are observed, including a Rayleigh to longitudinal (Ct h) and a Rayleigh wave to shear (St h) from
the crack tip.S St h corresponds to a wave which has been
mode converted from Rayleigh to shear, and reflected off the back of the sample. In region 3 Rayleigh waveRi is
recov-ered. The wave paths are summarised in Fig.10. Arrival times have been calculated using the equations presented in refer-ences [10,11].
4.2 Study of the Crack Geometry
[image:6.595.310.539.208.389.2]The waves were analysed by measuring the peak-to-peak amplitude at each position during the scan, normalised to the average ‘no defect’ signal (Fig.11). Several features are of note;
Fig. 11 Normalised amplitudes of the Rayleigh and shear waves at each point in the scan shown in Fig.8and9
– The normalised signal where there are no defect indi-cations behaves similarly for both shear and Rayleigh waves, and can be used to check whether changes in the measured amplitude are due to changes in EMAT lift-off or sample composition, which should affect both wave-modes similarly.
– The Rayleigh wave shows a single dip, indicating a single surface-breaking defect. The transmitted signal is small, indicating that the defect is deep compared to the wave-lengths used for the inspection.
– The shear wave shows a feature at around 25 mm, which corresponds to interference with a reflected Rayleigh wave.
– Additionally, the shear wave shows three dips.
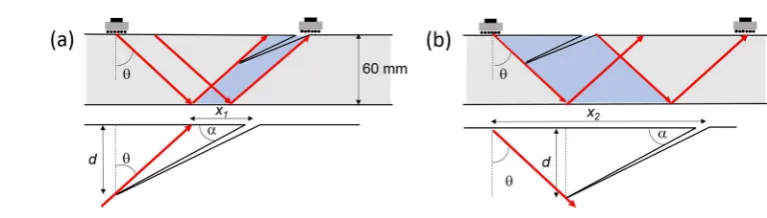
[image:6.595.54.286.210.411.2]Fig. 12 Origin of the asymmetry in the shear wave blocking for an angled surface-breaking defect
is no near-surface defect. Applying a threshold of 0.33 gives a predicted depth of 16.8 mm, which is close to the actual depth of 15 mm.
Further information can be obtained from the non-symmetric response of both waves at the start and end of the defect. The large signal enhancement of the Rayleigh wave as the first transducer passes over the defect, and no enhancement when the second transducer passes over it, sug-gests that the defect is angled [4]. The asymmetry in the shear wave blocked region widths confirms this assumption. Fig-ure12explains the origin of this asymmetry in the region of an angled surface-breaking defect. For a surface crack prop-agating at an angleαto the surface, with a vertical depthd, the length of the blocked region shown in Fig.12a is given by
x1=d
1
tanα −tanθ
, (3)
where the dimensions are shown in the figure. Similarly, in (b), the length of the blocked region is
x2=d
1
tanα +tanθ
. (4)
In Fig.11, the first shear wave dip hasx1 =8.5, andx2 =
18.5, after applying the 0.33 threshold. Asθis known, taking the ratio ofx1tox2gives a measurement of tanα=0.437,
corresponding to an angle of 23.6◦. Substituting that into the above equations gives a vertical depth of 5.9 mm, and a length of 14.7 mm. These correspond well with the angle and length measured from the side of the sample, which are 20◦and 15 mm respectively. The ability to obtain this angle is only possible when using both wavemodes to confirm that it is a near-side defect affecting the shear wave and causing this asymmetric dip feature, and the accuracy on the angle and depth is much higher than when just using the Rayleigh wave enhancement and transmission [4].
5 Conclusions
This work has presented a method to simultaneously monitor both faces of a sample. By taking advantage of multi-mode
generation from a single EMAT, a metallic sample with lim-ited access to the back face can be inspected thoroughly from a fast near-side B-scan by using both Rayleigh and shear wavemodes.
The directivity patterns of the shear wave generated by the chosen generation EMAT have been investigated. There is a good agreement between experimental and modelling results, which confirm steering of the beam primarily over a region around 30−40◦, enabling a suitable EMAT separation to be chosen. The scans show a pronounced sensitivity for detecting surface defects using the Rayleigh wave, with the shear wave also being affected when the generation or detec-tion EMAT is directly over the defect. For far-side defects, locating a flaw is straightforward, but the conclusion can sometimes be misguided by disturbances due to the presence of a near-side crack.
The combination of inspection using a Rayleigh and a shear wave gives several advantages. Firstly, it gives a higher accuracy to identification of the location of defects, enabling confirmation of whether defects are present on the near-side or far-side of the sample. Additionally, any asymmetry in the shear wave blocking can be used to identify the angle of propagation of the near-side defect, as well as its depth, and this can be used in combination with the Rayleigh waves for high accuracy characterisation of near-side defects when only a single side of the sample is accessible.
It should be noted that with this technique there exists a shadow zone for the shear wave when there is a surface crack, as indicated in Fig.12, where a far-side defect may not be detected, or may be mis-sized. This can be overcome by taking advantage of the fact that the shear wave directivity is not a tight beam, but that different propagation angles could be chosen if signal to noise ratio was sufficient. Using two or more detectors at different positions (giving a different angle of propagation of shear wave) would overcome this issue, by giving different shadow zones. Full analysis would use the position with the highest signal to noise ratio for the shear wave, while the other position(s) could be used as a check against missing features.
or angled defects on the far-side. Multiple separations of EMATs, and hence directions ofS S, could be used to allow for far-side defects that fall within the shadow region from near-side defects.
Open Access This article is licensed under a Creative Commons Attribution 4.0 International License, which permits use, sharing, adap-tation, distribution and reproduction in any medium or format, as long as you give appropriate credit to the original author(s) and the source, provide a link to the Creative Commons licence, and indi-cate if changes were made. The images or other third party material in this article are included in the article’s Creative Commons licence, unless indicated otherwise in a credit line to the material. If material is not included in the article’s Creative Commons licence and your intended use is not permitted by statutory regulation or exceeds the permitted use, you will need to obtain permission directly from the copy-right holder. To view a copy of this licence, visithttp://creativecomm ons.org/licenses/by/4.0/.
References
1. Hutchins, D.A.: Ultrasonic generation by pulsed lasers. Phys. Acoust.18, 21–123 (1988)
2. Hirao, M., Ogi, H.: Electromagnetic Acoustic Transducers: Non-contacting Ultrasonic Measurements Using EMATs. Springer, Berlin (2017)
3. Hernandez-Valle, F., Dixon, S.: Initial tests for designing a high temperature emat with pulsed electromagnet. NDT & E Int.43, 171–175 (2010)
4. Rosli, M.H., Edwards, R.S., Fan, Y.: In-plane and out-of-plane mea-surements of rayleigh waves using emats for characterising surface cracks. NDT & E Int.49, 1–9 (2012)
5. Viktorov, I.A.: Rayleigh and Lamb Waves: Physical Theory and Applications. Springer, Berlin (1967)
6. Georgious, G.A., Bond, L.J.: Quantitative studies in ultrasonic wave-defect interaction. Ultrasonics25, 328–334 (1987) 7. Shan, Q., Dewhurst, R.J.: Surface-breaking fatigue crack detection
using laser ultrasound. Appl. Phys. Lett.62, 2649 (1993) 8. Edwards, R.S., Dixon, S., Jian, X.: Characterisation of defects in
the railhead using ultrasonic surface waves. NDT & E Int.39, 468– 475 (2006)
9. Edwards, R.S., Jian, X., Fan, Y., Dixon, S.: Signal enhancement of the in-plane and out-of-plane rayleigh wave components. Appl. Phys. Lett.87, 194104 (2005)
10. Edwards, R.S., Dutton, B., Clough, A.R., Rosli, M.H.: Enhance-ment of ultrasonic surface waves at wedge tips and angled defects. Appl. Phys. Lett.99, 094104 (2011)
11. Dutton, B., Clough, A.R., Rosli, M.H., Edwards, R.S.: Non-contact ultrasonic detection of angled surface defects. NDT & E Int.44, 353–360 (2011)
12. Hernandez-Valle, F., Dutton, B., Edwards, R.S.: Laser ultrasonic characterisation of branched surface-breaking defects. NDT & E Int.68, 113–119 (2014)
13. Ohara, Y., Oshiumi, T., Nakajima, H., Yamanaka, K., Wu, X., Uchi-moto, T., Takagi, T., Tsuji, T., Mihara, T.: Measurement of the ultrasonic scattering matrices of near-surface defects using ultra-sonic arrays. AIP Adv.7, 065214 (2017)
14. Petcher, P., Dixon, S.: A modified hough transform for removal of direct and reflected surface waves from b-scans. NDT & E Int.44, 139–144 (2011)
15. Nowers, O., Duxbury, D., Drinkwater, B.: Ultrasonic array imaging through an anisotropic austenitic steel weld using an efficient ray-tracing algorithm. NDT & E Int.79, 98–108 (2016)
16. Meyer, R.M.: NDE techniques used in PARENT open round robin testing, Pacific Northwest National Laboratory report PNNL-23387
17. Uchimoto, T., Takagi, T., Ichihara, T., Dobmann, G.: Evaluation of fatigue cracks by an angle beam emat-et dual probe. NDT & E Int. 72, 10–16 (2015)
18. Pei, C., Demachi, K., Fukuchi, T., Koyama, K.: Cracks measure-ment using fiber-phased array laser ultrasound generation. J. Appl. Phys.113, 163101 (2013)
19. Kimoyo, K., Ueno, S., Hirose, S.: Image-based sizing of surface-breaking cracks by SH-wave array ultrasonic testing. Ultrasonics 45, 152–164 (2013)
20. Ogi, H., Hirao, M., Ohtani, T.: Flaw detection by line-focusing elec-tromagnetic acoustic transducers. In: IEEE Ultrasonic Symposium Proceedings (1997)
21. Ogi, H., Hirao, M., Ohtani, T.: Line-focusing of ultrasonic SV wave by electromagnetic acoustic transducer. J. Acoust. Soc. Am.103, 2411 (1998)
22. Jian, X., Dixon, S., Baillie, I., Edwards, R.S., Morrison, J., Fan, Y.: Shear wave generation using a spiral electromagnetic acoustic transducer. Appl. Phys. Lett.89, 244106 (2006)
23. Pardee, W.J., Thompson, R.B.: Half-space radiation by emats. J. Nondestr. Eval.1, 157–181 (1980)
24. Hu, J.K., Zhang, Q.L., Hutchins, D.A.: Directional character-isitcs of electromagnetic acoustic transducers. Ultrasonics26, 5–13 (1988)
25. Wu, D., Li, M., Wang, X.: Shear wave field radiated by an electro-magnetic acoustic transducer. Chin. Phys. Lett.23, 3294 (2006) 26. Hill, S., Dixon, S.: Frequency dependent directivity of periodic
permanent magnet electromagnetic acoustic transducers. NDT & E Int.62, 137–143 (2014)
27. Thring, C.B., Hill, S.J., Dixon, S., Edwards, R.S.: The effect of emat coil geometry on the Rayleigh wave frequency behaviour. NDT & E Int.99, 105945 (2019)
28. Jian, X., Dixon, S., Quirk, K., Grattan, K.T.V.: Electromagnetic acoustic transducers for in- and out-of plane ultrasonic wave detec-tion. Sens. Actuators A148(1), 51–56 (2008)