1
A Structural Vector Autoregressive Model of Technical Efficiency and Delays with an
Application to Chinese Airlines
Mike G. Tsionas, Zhongfei Chen and Peter Wanke
Abstract:
This study reports on the performance assessment of Chinese airlines from
2006-2014 using a stochastic distance function where technical efficiency and a measure of flight
delays follow a joint structural autoregressive process. This model is used to investigate
whether technical efficiency causes flight punctuality or the other way around. The model,
however, yields a non-trivial likelihood function and is not amenable to estimation using least
squares or standard maximum likelihood techniques. To estimate the model therefore, we
propose and implement maximum simulated likelihood with importance sampling. The results
suggest a mutual dependence (feedback) between technical efficiency and delays. Policy
implications are derived.
Keywords:
stochastic distance function; SVAR; China; airlines; technical efficiency; delays.
1.
Introduction
The complexity of air transport operations and their underlying services represents a
growing study field in light of the innumerous challenges derived from increased airline
competition and airport (de)regulation verified in the past decades (Graham, 2008). In fact,
although the need for continuous performance measurement and monitoring is
well-acknowledged by academics and practitioners (Bitzan et al., 2016), there is still room opened
for including negative externalities imposed to customers when assessing performance levels
of air transport operations (Assaf et al., 2014).
2
Baltagi et al., 1995); (iii) Tornquist total factor productivity index (Coelli et al., 2003; Barbot
et al., 2008); (iv) Data Envelopment Analysis or DEA models (Merkert and Hensher, 2011;
Barros et al., 2013; Barros and Peypoch, 2009; Barros and Couto, 2013; Wanke and Barros,
2016b); and (v) multi-criteria decision-making models such as TOPSIS (Barros and Wanke,
2015; Wanke et al., 2015). All these papers analyzed airlines from the US (Barros et al., 2013;
Greer, 2008; Sjögren and Söderberg, 2011), Canada (Bauer, 1990; Assaf, 2009), Europe
(Distexhe and Perelman, 1994; Greer, 2008; Barros and Peypoch, 2009), Asia (Baltagi et al.,
1995; Wanke et al., 2015), Africa (Barros and Wanke, 2015), and Latin America (Wanke and
Barros, 2016b).
Given the relative importance of China to the world economy, it is possible to affirm
that Chinese airlines consist of a relatively understudied topic. As a matter of fact, only a few
studies were devoted to this particular industry (Chow, 2010 and Wu et al., 2013; Wanke et
al., 2015).
On the other hand, it is worth noting that, within the airline efficiency ambit,
DEA-based studies are the most numerous when compared to the SFA-DEA-based methods and other
minor approaches used (Wanke et al., 2015; Barros and Wanke, 2015; Wanke and Barros,
2016a, 2016b). This not only replicates a pattern that is found in papers focused on efficiency
analysis in other industries such as ports and banking (e.g. Wanke et al., 2016a, 2016b), but
may be also derived by the flexibility provided by DEA models in handling two-stage analysis
where scores are computed first and statistically tested subsequently. In fact, several different
issues have been addressed by DEA-based airline research studies in different countries or
regions. Besides efficiency rankings and slack comparisons, it is possible to point out, for
instance, that the impacts of network size, ownership, and regulatory measures on the
performance of the airline industry have been addressed by regressing efficiency scores onto
contextual or environmental variables (Barros et al., 2013; Barros and Wanke, 2015).
3
service quality, different from the classical trade-off between efficiency and service where
higher levels of service are obtained to the detriment of lower levels of efficiency.
Therefore, this paper builds upon the existing body of knowledge by presenting a novel
SVAR model for technical efficiency and delays in the ambit of the Chinese airline industry.
Not only is China one of the fastest growing areas in the world, which justifies the relevance
of this study, but this paper also fills a literature gap by presenting and developing a novel
stochastic distance function where delays—the quality measure used in this research—are
simultaneously computed with airline technical efficiency scores in a single-stage procedure.
This is particularly important due to the endogenous nature of some quality metrics: they do
not only affect the efficiency levels of the productive process, but they are also affected by
them in a feedback loop. In fact, flight delays are rather studied within the ambit of airport
operations as an undesirable output by means of DEA and its variants, thus suggesting the
opportunity to address this phenomena at the airline level using stochastic autoregressive
models (Yu, 2004; Yu, 2010; Lozano and Gutierrez, 2011; Lozano et al., 2013; Assaf et al.,
2014).
This research also lends a contribution to the business or practical side or air transport
operation. From a customer service viewpoint, flight delays not only impose costs on
passengers but also on airlines, by forcing both to use more resources to accomplish the same
output: flying in a timely manner (Assaf et al., 2014). In fact, passengers may obtain less value
from a trip as they are forced to wait out delays in airports, while increasing the potential
switching decision to move to another airline and negative word of mouth (Gustafsson, 2009;
Aaker et al., 2004).
The paper is structured as follows: after this introduction, the background on the
Chinese aviation industry is presented including a description of the Chinese airlines. The
literature survey is then presented followed by the methodology section where the SVAR
model for technical efficiency and delays is further discussed. Section 5 presents the
discussion of the results. Conclusions are presented in Section 6.
2. Background on Chinese Airlines
4
of few airlines that existed decades ago moved from a tight state control and ownership to a
large number different players embedded in a more flexible regulatory environment. Such huge
changes over the course of a couple of decades impose the need to assure that the current
governance/regulatory combination practices lead to the best performance in the air
transportation industry (Assaf et al., 2014). In fact, as further depicted, it appears that negative
externalities, such as flight delays, are rapidly increasing in the Chinese airline industry. They
should be taken into consideration in order to provide an accurate picture in terms the relative
performance of their companies. The correct acknowledgment of these undesirable effects are
relevant for the establishment of sound regulatory/governance policies.
[image:4.595.118.482.445.668.2]The Chinese civil aviation industry was relatively undeveloped until 1978, at which
time the government embarked on a policy of reform by opening it up and switching it to a
market-oriented economy. During the last three decades, China has witnessed the blossoming
of its economy, increased trade with other countries around the world, and rapid growth of civil
aviation. The economic globalization and regionalization of production after entering the
World Trade Organization (WTO) has driven the growth of Chinese aviation business to a
further wave of development (cf. Figure 1). At present, China has been the second largest
aviation market in the world in terms of the volumes of passengers and air cargo moved in its
domestic market since 2007 (Jiang and Zhang, 2016; Chen et al., 2017).
Figure 1: The development of Chinese civil aviation (mil = million)
The quick development of the airline sector has greatly contributed the prosperity of
the Chinese civil aviation industry nowadays. However, before the year of 1978, air
transportation was fully and tightly controlled by the central government under the CAAC,
0 1 2 3 4 5 6 7
0 50 100 150 200 250 300 350 400 450 500
1979 1980 1981 1982 1983 1984 1985 1986 1987 1988 1989 1990 1991 1992 1993 1994 1995 1996 1997 1998 1999 2000 2001 2002 2003 2004 2005 2006 2007 2008 2009 2010 2011 2012 2013 2014 2015
5
which operated in a military or semi-military style, collaborating with the Air Force of China
(Shaw et al., 2009; Wang et al., 2016). After 1978, the government successively established
six state-owned airline companies
1, which were separated from the CAAC and reduced
government intervention. To decrease the monopoly power of the civil aviation industry, some
new airline companies founded by the local governments or government-owned enterprises
also entered the market during this stage (Jiang and Zhang, 2016). Meanwhile, the CAAC
allowed airlines to adopt price discrimination to improve competition in 1997. Foreign
investment in the civil aviation sector was also permitted. In 2005, the CAAC further
deregulate the Chinese civil aviation sector and opened it to private investors and the number
of private airlines has grown rapidly (Wang et al., 2016), including a low-cost carrier. To
enhance efficiency and competitiveness, market-driven consolidation also took place during
this period, especially after the Asian financial crisis as well as the global financial crisis that
broke out since 2007. Through merging and acquisition, the "Big three", i.e. Air China, China
Southern, and China Eastern, have seized most of the market share in the domestic civil
aviation sector (Lei and O’Connell, 2011).
Despite experiencing high-speed development of civil aviation business and great
improvement on corporate governance of airline companies, the flight delays have been one of
the major sources of passenger complaints in China, and the civil aviation authority has
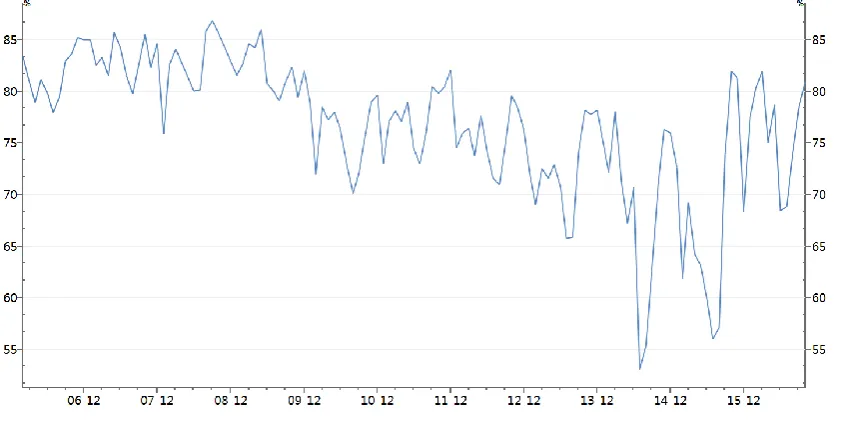
determined to improve the situation (Vlachos and Lin, 2014). As shown by Figure 2, the overall
punctuality of Chinese civil aviation has significantly dropped down during recent years,
especially after 2009. Moreover, punctuality has gotten even worse from 2014 to 2015,
reaching levels lower than 60%. Flight delay is not only one of the main drivers to service
quality and customer loyalty (Vlachos and Lin, 2014; Zhang et al., 2015), but it also is an
important indicator suggesting the status and performance of airline companies (Fan et al.,
2014).
1 Included Air China, China Eastern Airlines, China Southern Airlines, China Southwest Airlines, China Northwest Airlines,
6
Figure 2
: overall punctuality of Chinese civil aviation.
Sources: WIND database.
3. Literature Review
7
Flight delays have been given much attention by some civil aviation management
scholars (Vlachos and Lin, 2014; Jiang and Zhang, 2016). Fan et al. (2014) employs a
directional distance function to evaluate the technical efficiency within a joint production
framework of desirable and undesirable output (i.e. flight delays). However, it only examined
twenty major Chinese airports from 2006 to 2009, rather than the airline companies.
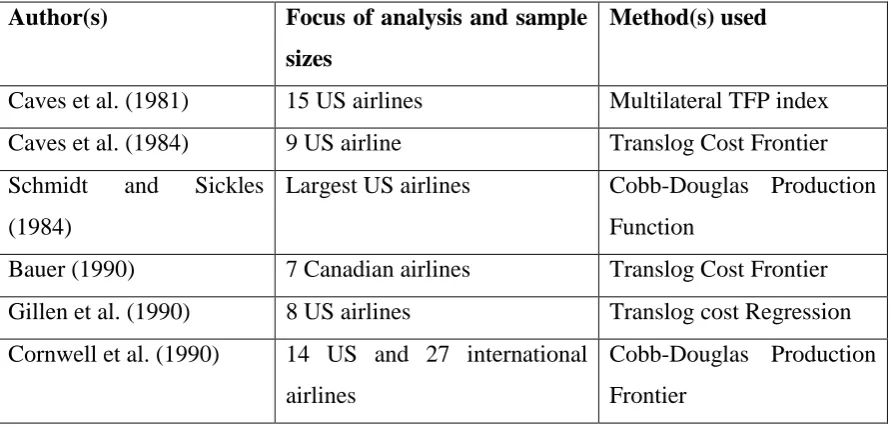
[image:7.595.79.526.546.759.2]In fact, research on Chinese airline efficiency represents a small fraction of the overall
research produced with respect to airline efficiency in different countries or regions. A
literature review synthesis is presented in Table 1, which enumerates the objects of analysis
and the models used in each paper over the last three decades of studies on airline efficiency.
Taking a closer look within each paper, one can easily note that the most common inputs are
labor, capital, and materials or capacity, while the most frequent outputs include revenues,
profits, movements, and passengers. Therefore, in this research and in consonance with
previous researches, the inputs used are number of employees, total number of planes, and the
fuel consumed. The outputs are the total number of passengers carried and the total cargo
transported. Furthermore, it should be noted that thus far no paper has adopted a method that
simultaneously computes airline efficiency scores considering flight delays in a stochastic
fashion. Furthermore, except for Wanke et al. (2015), no paper has performed an efficiency
analysis focusing also on service quality within the ambit of the airline industry, which is an
additional contribution of this paper.
Table 1
: Literature review
Author(s)
Focus of analysis and sample
sizes
Method(s) used
Caves et al. (1981)
15 US airlines
Multilateral TFP index
Caves et al. (1984)
9 US airline
Translog Cost Frontier
Schmidt
and
Sickles
(1984)
Largest US airlines
Cobb-Douglas Production
Function
Bauer (1990)
7 Canadian airlines
Translog Cost Frontier
Gillen et al. (1990)
8 US airlines
Translog cost Regression
Cornwell et al. (1990)
14 US and 27 international
airlines
8
Windle (1991)
Largest US airlines
Multilateral TFP Index and
Cost Function
Windle (1991)
Largest US airlines
Multilateral TFP Index and
Cost Function
Good et al. (1993)
9 US, 15 European and 9 Asian
airlines
Cobb-Douglas Production
Frontier
Distexhe and Perelman
(1994)
US and European airlines
DEA-CCR and Malmquist
Index
Good et al. (1995)
US airlines
Cobb-Douglas Production
Frontier and DEA-CCR
Baltagi et al. (1995)
8 US, 8 European and 7 Asian
Translog Variable Cost
Function
Oum and Yu (1995)
32 international airlines
Multilateral TFP Index
Coelli et al. (1999)
11 US airlines
Translog
Production
Frontier
Liu and Lynk (1999)
18 international airlines, 20
international airlines
Cobb-Douglas
Cost;
Malmquist
Productivity
Index
Inglada et al. (2006)
39 International airlines
DEA-BCC and TFP Index
Barbot et al. (2008)
14 US airlines
DEA-BCC and TFP Index
Greer (2008)
8 US airlines
DEA-CCR and Two Stage
Regression
Greer (2009)
29 European airlines
Malmquist Index
Barros
and
Peypoch
(2009)
12 US airlines
DEA-CCR and two Stage
regression
Assaf (2009)
7 Canadian Airlines
Stochastic
Production
Bayesian Frontier
Ouellette et al. (2010)
50 largest airlines
Technical Efficiency and
Allocative Efficiency
Chow (2010)
Chinese airlines, 2003-2007
Efficiency analyzed with
9
analyzed with Malmquist
Index
Sjögren and Söderberg
(2011)
18 major UK airlines
Input Distance Function
Merkert
and
Hensher
(2011)
15 US airlines
DEA Two Stage
Barros and Couto (2013)
23 European airlines
Malmquist and Luenberger
Productivity Measures
Bilotkach and Huschelrath
(2012)
Airline alliances
Conceptual Approach
Barros et al. (2013)
11 USA airlines from 1998
to 2010
B-convex DEA Model
Wu et al. (2013)
Chinese airlines, other Asian
airlines, USA airlines and
European airlines, 2006-2010
Efficiency with CCR and
BCC DEA Model and a
Second-stage
Regression
explaining efficiency.
Tavassoli et al. (2014)
Iranian airlines in 2010
SBM-NDEA
Model
(Slacks
Based
Measure
Network Data Envelopment
Analysis)
Lee
and
Worthington
(2014)
Several airlines, 1994-2011
DEA and SFA and
Second-Stage Regression
Barros and Wanke (2015)
African airlines, 2010-2013
TOPSIS
and
Neural
Networks in a Two-stage
Approach
Wanke et al. (2015)
Asian airlines, 2006-2012
TOPSIS
and
GLMM-MCMC in a Two-stage
Approach
Wanke and Barros (2016)
Latin American airlines,
2010-2014
10
4. Methodology
4.1. The Data
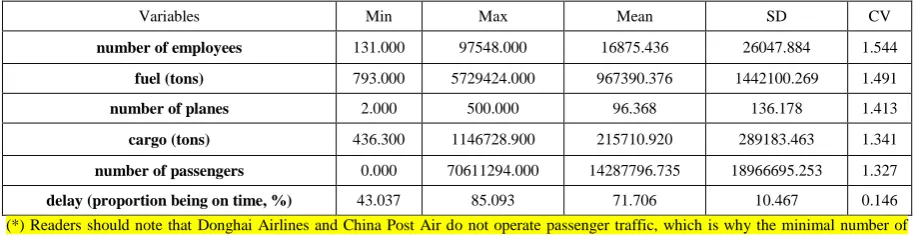
[image:10.595.69.530.308.426.2]The data on nine selected Chinese airlines were obtained from the Wind
(www.wind.com.cn/) database and their annual financial reports on the website of Shanghai
Stock Exchange (www.sse.com.cn) and Shenzhen Stock Exchange (www.szse.cn) for the
period 2006 to 2014. The descriptive statistics for their productive resources—inputs and
outputs as depicted in Section 3—and their average flight delays are presented in Table 2.
Table 2
: Descriptive statistics for the Chinese airlines productive resources and delays (*)
Variables Min Max Mean SD CV
number of employees 131.000 97548.000 16875.436 26047.884 1.544
fuel (tons) 793.000 5729424.000 967390.376 1442100.269 1.491
number of planes 2.000 500.000 96.368 136.178 1.413
cargo (tons) 436.300 1146728.900 215710.920 289183.463 1.341
number of passengers 0.000 70611294.000 14287796.735 18966695.253 1.327
delay (proportion being on time, %) 43.037 85.093 71.706 10.467 0.146
(*) Readers should note that Donghai Airlines and China Post Air do not operate passenger traffic, which is why the minimal number of
passengers is zero.
4.2. Econometric Model
The first model is a standard output distance function of the form:
( , )
1,
D x y
(1)
where
x
R
Kdenotes the inputs and
y RMdenotes the outputs in log form. Using linear
homogeneity with respect to outputs and introducing and error term along with technical
inefficiency, we have:
1,it ( 1),it, it it it, 1,..., , 1,..., ,
y f y x v u i n t T
(2)
11
(Kumbhakar and Lovell, 2000). In Model I we assume:
uit ~N a0 a z1 it, u2. In particular,
we assume p = 1 and z is delay, which is a measure of quality.
In Model II we use a more elaborate model to investigate the direction of causality between
delays and technical inefficiency using a dynamic model, which is estimated along with (2).
The dynamic model has the following form:
10 11 , 1 1 , 10 11 , 1
...
1 , ,1,
it i t L i t L it i t L i t L it
z
c
z
z
u
u
u
(3)
20 20 21 , 1 2 , 21 , 1
...
2 , ,2,
it it i t L i t L i t L i t L it
u
c
z
z
z
u
u
(4)
where
it it,1, it,2is an error term. This system is a structural vector autoregression
(SVAR) relating technical inefficiency and delays. Apart from that, we complete (2) using a
reduced form equation for
y
( 1),itas follows:
( 1),it x it w it z it ( 1),it
,
y
x
w
z
1
(5)
where
w
itR
qis a vector of exogenous variables (firm and time dummies),
xis an
M K
matrix,
wis an
M
q
matrix,
zis a scalar coefficient, and
1
is a vector of ones
in
R
M 1.
The endogenous variables are
y
1,it,
y
( 1),it,
zitand
uit. We assume that inputs are
predetermined as we use an output distance function. The Jacobian of transformation in the
system consisting of (2), (3), (4), and (5) is
20 10
1
.
J
(6)
If we assume
2~ 0,
it v
v iidN
,
it ~iidN2(0, ),
( 1),it~
iidN
M 1(0, )
12
2
2
/2 /2
2 1
1, ( 1), 20 10
1 1 2
1/2 /2 1
1 2
( 1)/2 /2 1
1
( 1), ( 1), 2
; 2 exp ( , ) 1
2 exp ( ) ( )
2 exp ,
nT
v
nT n T nT
v i t it it it it
R nT
it it
M nT
it it it x it
L Y y f y x u
y W y W du
(7)
where
10 11 , 1 1 , 10 11 , 1 1 ,20 20 21 , 1 2 , 21 , 1 2 , ,2
...
...
it i t L i t L it i t L i t L
it
it it i t L i t L i t L i t L it
z
c
z
z
u
u
u
u
c
z
z
z
u
u
,
,
,
,
,
,
it it it it x w z
W
x w z
1
, and the integration is with respect to
u
u
itR
nT.
Here,
R
dis the entire parameter vector and
Ydenotes the data. The multivariate
integration is quite complicated because of the dynamic dependence in (3a) and (3b). A
standard translog for flexibility was chosen for the functional form
f y
(
( 1),it, )
x
it.
To maximize (6) we use importance sampling followed by a Gauss-Newton numerical
maximization procedure. Importance sampling is based on the idea that when we must compute
an integral of the form
I L( )u udwe can always write it in the form:
( )
( ) , ( )
L
I q d
q
u
u u
u
(8)
where
q
( )
u
is an importance density. If a sample of random numbers
u( )s,s 1,...,Scan be
drawn from the importance density
2, then
( ) 1 ( ) 1 ( ) ( ) s S s s L I S q u
u
. To construct our importance
density, we use a multivariate truncated normal distribution
u
N
nTm V
,
and we optimize
,
m V
so that it is as close to (6) as possible in the Kullback-Leibler sense, so we first solve the
problem:
13 ( )
1
( ) 1
,
( ) ( )
min : ( )log log ,
( ) ( )
s S
s s
q q
q d S
L L
m V
u u
u u
u u
(9)
where
u( )s,s 1,...,Sis a sample from
q
( )
u
, the density of
N
nTm V
,
in this instance,
and
L
( )
u
is the integrand in (6).
It is worth mentioning that the proposed model is a novel one that couples a distance
function with a vector autoregressive model for technical inefficiency and a vector of covariates
z. This removes the assumption that technical inefficiency is static as we adopt a dynamic
framework and it relates it explicitly, and in a dynamic way, to certain covariates z. The
traditional model simply assumes that technical inefficiency is i.i.d. In other contexts,
inefficiency has been assumed to depend on certain covariates (Battese–Coelli model) and,
finally, there are the Tsionas (2002, 2006) models where technical inefficiency follows an
autoregressive scheme. Here, we nest all these models by proposing a novel SVAR model for
z and technical inefficiency to compute impulse response functions, which is what we really
need in our context. Codes were developed in Fortran 77.
5. Analysis and Discussion of Results
14
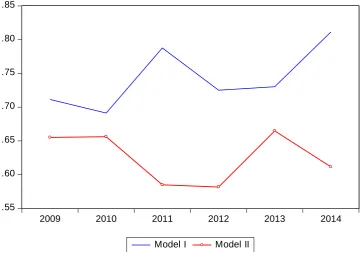
.55 .60 .65 .70 .75 .80 .85
2009 2010 2011 2012 2013 2014
[image:14.595.134.499.73.327.2]Model I Model II
Figure 3.
Average efficiency over time.
15
-.1 .0 .1 .2 .3 .4
1 2 3 4 5 6 7 8 9 10 GIRF of U to U
-.1 .0 .1 .2 .3 .4
1 2 3 4 5 6 7 8 9 10 GIRF of U to Z
-1.0 -0.5 0.0 0.5 1.0 1.5 2.0
1 2 3 4 5 6 7 8 9 10 GIRF of Z to U
-1.0 -0.5 0.0 0.5 1.0 1.5 2.0
1 2 3 4 5 6 7 8 9 10 GIRF of Z to Z
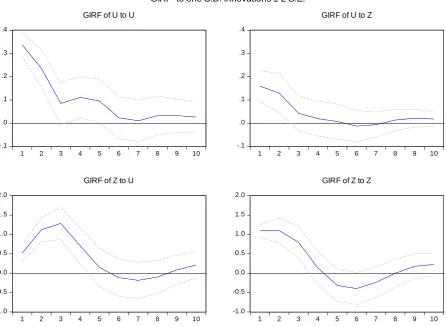
[image:15.595.77.525.79.406.2]GIRF to one S.D. innovations ± 2 S.E.
Figure 4.
Generalized impulse response functions of z
tand u
t.
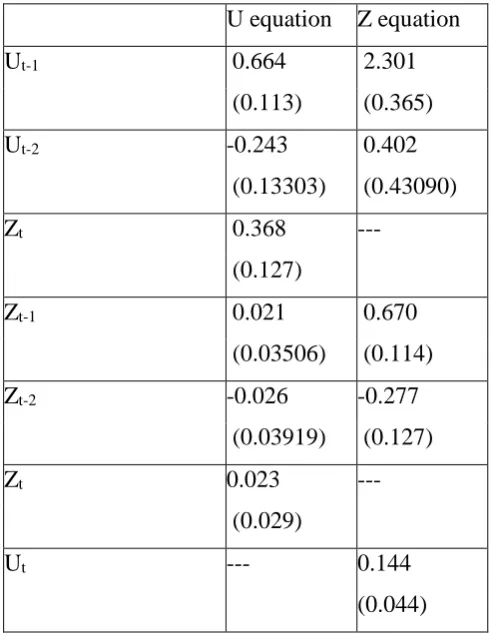
We found it necessary to use two lags after using a BIC criterion. Our estimates of (3) and
(4) are provided in Table 3. We see that current-period effects estimated at 0.368 and 0.144 are
statistically significant indicating that there is a feedback effect between inefficiency and
quality. It is well known that in SVAR systems the parameters do not have structural
interpretation, so we resort to generalized impulse response functions provided in Figure 4. The
off-diagonal generalized impulse responses show a) the effect of a one-standard-deviation
shock in Z on inefficiency (upper left graph) and b) the effect of a one-standard-deviation shock
in inefficiency on Z. Both effects are statistically significant as shown by the 95% error bands.
Specifically, the effect of Z on inefficiency is positive and significant for up to two periods and
declines over time. The effect of inefficiency on Z lasts 4-5 years, it is positive, and statistically
significant.
16
may only produce effective results on airline technical efficiency levels in a couple of years.
The reverse may also be true, should the airlines adopt benchmarking levels for improving their
productive resources in light of the best practices. It may take a couple of years until flight
delays can be reduced. Differential measures such as financial incentives could be adopted in
airport fares and ticket fees to ensure flight punctuality. New flight control and navigation
technologies could be adopted in Chinese airports to allow landings and take-offs on foggy
days, thus speeding-up the materialization of the trade-in between technical efficiency and
reduction in flight delays.
Table 3:
Results for the structural vector auto-regressive model (standard errors – SE - are
given within brackets in the subsequent line)
U equation Z equation
U
t-10.664
2.301
(0.113)
(0.365)
U
t-2-0.243
0.402
(0.13303)
(0.43090)
Z
t0.368
---
(0.127)
Z
t-10.021
0.670
(0.03506)
(0.114)
Z
t-2-0.026
-0.277
(0.03919)
(0.127)
Z
t0.023
---
(0.029)
U
t---
0.144
(0.044)
[image:16.595.72.318.328.645.2]17
This paper presents an analysis of the efficiency of Chinese airlines during 2006-2014
using a novel SVAR model for technical efficiency and delays. This model makes it possible
to compute simultaneously the impact of delays on the residuals of the stochastic distance
function, thus presenting a higher discriminatory power, with technical efficiency scores less
biased towards one. Results suggest a mutual dependence relationship between airline technical
efficiency scores and delays, thus building upon scant previous papers that addressed this issue,
treating delays as an undesirable output within the ambit of airport operations.
A failure to include flight delays in airline operations planning may lead to wrong
decisions in terms of how much outputs to produce (passengers and cargoes to carry), when to
produce them, and how to produce them, yielding higher operational costs to the airlines and
lower service levels to its customers. For instance, airlines may decide upon a wrong
combination between capital (number of planes) and labor (number of employees), which
would have been different if delays were taken into consideration. Flight delays do not only
keep airlines stuck on the ground but also require additional ground personnel more intensively
to manage customer expectations and relocate passengers to upcoming flights.
Putting the last paragraph into other words, the impact on policy implications suggests
that managers and regulators should pay more attention to flight delays when benchmarking
the performance of airline companies. In the air transport operations, passenger and cargo
transportation will be inevitably associated with flight delays. It is necessary to take account of
it so as to improve the unbiased estimation of technical efficiency of airlines and to depict how
their scores fluctuate more precisely over the course of time within and between airlines.
Additionally, considering the impact of flight delays into the input/output mix will not only
help in optimizing airline resource allocation but also in designing customer service measures
to remediate the loss of utility caused by them.
18
References
Aaker, J.L., Fournier, S.F., and Brasel, S.A. (2004). When good brands do bad. J. Consum. Res. 31(1), 1-16. doi:10.1086/383419
Assaf, A. (2009). Are US airlines really in crisis? Tour. Manag. 30(6), 916–921.
doi:10.1016/j.tourman.2008.11.006
Assaf, A. G., Josiassen, A., & Gillen, D. (2014). Measuring firm performance: Bayesian estimates with good and
bad outputs.J. Bus. Res.67(6), 1249-1256.doi:10.1016/j.jbusres.2013.04.005
Baltagi, B.H., Griffin, J.M., and Rich, D.P. (1995). Airline deregulation: the cost pieces of the puzzle. Int. Econ. Rev. 36(1) 245–259. doi: 10.2307/2527435.
Barbot, C., Costa, A., and Sochirca, E. (2008). Airlines performance in the new market context: a comparative
productivity and efficiency analysis. J. Air Transp. Manag. 14(5) 270–274. doi:
10.1016/j.jairtraman.2008.05.003
Barros, C.P., and Couto, E. (2013). Productivity analysis of European airlines, 2000–2011. J. Air Transp. Manag. 31, 11-13. doi: 10.1016/j.jairtraman.2012.10.006
Barros, C.P., Liang, Q.B., and Peypoch, N. (2013). The technical efficiency of US Airlines. Transp. Res. Part A: Policy and Pract. 50, 139–148. doi: 10.1016/j.tra.2013.01.019
Barros, C.P., and Peypoch, N. (2009). An evaluation of European Airlines’ operational performance. Int. J. Prod.
Econ. 122(2), 525–533. doi: 10.1016/j.ijpe.2009.04.016
Barros, C.P., and Wanke, P. (2015). An analysis of African airlines efficiency with two-stage TOPSIS and neural networks. J. Air Transp. Manag. 44/45, 90-102. doi:10.1016/j.jairtraman.2015.03.002
Bauer, P.W. (1990). Decomposing TFP growth in the presence of cost inefficiency, nonconstant returns to scale,
and technological progress. J. Prod. Anal. 1(4), 287–299. doi: 10.1007/BF00160047
Bilotkach, V., and Huschelrath, K. (2012). Airline alliances and antitrust policy: The role of efficiencies. J. Air Transp. Manag. 21, 76-84. doi: 10.1016/j.jairtraman.2011.12.019
Bitzan, J.D., Peoples, J.H., and Wilson, W.W. (2016) Airline Efficiency (Vol. 5). Bingley, UK: Emerald.
Caves, D.W., Christensen, L.R., and Tretheway, M.W. (1981). US Trunk Air Lines, 1972–1997: a multilateral
comparison of total factor productivity. In: T.G. Cowing and R.E. Stevenson (Eds.), Productivity
Measurement in Regulated Industries (Chap. 3, pp. 47-77). New York: Academic Press.
Caves, D.W., Christensen, L.R., and Tretheway, M.W. (1984). Economies of density versus economies of scale:
why trunk and local service airline costs differ. The RAND J. Econ. 15(4), 471–489.
Chen, Z., Barros, C., and Yu, Y. (2017). Spatial distribution characteristic of Chinese airports: A spatial cost
function approach. J. Air Transp. Manag. 59, 63-70.doi:10.1016/j.jairtraman.2016.11.011
Chow, C.K.W. (2010). Measuring the productivity changes of Chinese airlines: the impact of the entries of
non-state owned carriers. J. Air Transp. Manag. 16(6), 320-324. doi:10.1016/j.jairtraman.2010.04.001
Coelli, T.J., Estache, A., Perelman, S., and Trujillo, L. (2003). A primer on efficiency measurement for utilities
and transport regulators. Washington DC: World Bank Institute.
Coelli, T., Perelman, S., and Romano, E. (1999). Accounting for environmental influences in stochastic frontier models: with application to international airlines. J. Prod. Anal. 11(3), 251–273. doi: 10.1023/A:1007794121363
Cornwell, C., Schmidt, P., and Sickles, R.C. (1990). Production frontiers with cross-sectional and time-series
19
Cui, Q., and Li, Y. (2015). The change trend and influencing factors of civil aviation safety efficiency: The case
of Chinese airline companies. Saf. Sci. 75, 56-63.doi:10.1016/j.ssci.2015.01.015
Distexhe, V., and Perelman, S. (1994). Technical efficiency and productivity growth in an era of deregulation: the
case of airlines. Swiss J. Econ. Stat. 130(4), 669–689.
Fan, L. W., Wu, F., and Zhou, P. (2014). Efficiency measurement of Chinese airports with flight delays by
directional distance function. J. Air Transp. Manag. 34, 140-145.doi:10.1016/j.jairtraman.2013.10.002
Gillen, D.W., Oum, T.H., and Tretheway, M.H. (1990). Airline cost structure and policy implications: a multi-product approach for Canadian airlines. J. Transp. Econ. Policy, 24(1), 9-34.
Good, D., Nadiri, M., Roller, L.H., and Sickles, R.C. (1993). Efficiency and productivity growth comparisons of
European and US air carriers: a first look at the data. J. Prod. Anal. 4, 115–125. doi:10.1007/BF01073469
Good, D., Roller, L.H., and Sickles, R.C. (1995). Airline efficiency differences between Europe and the US: Implications for the pace of EC integration and domestic regulation. Eur. J. Oper. Res. 80(2), 508–518. doi: 10.1016/0377-2217(94)00134-X.
Gustafsson, A. (2009). Customer satisfaction with service recovery. J. Bus. Res. 62 (11), 1220-1222. doi:10.1016/j.jbusres.2008.11.001
Graham, A. (2008). Airport Planning and regulation in the United Kingdom. In C. Winston & G. De Rus (Eds.), Aviation infrastructure performance: A study in comparative political economy. Washington DC: Brookings.
Greer, M.R. (2008). Nothing focuses the mind on productivity quite like the fear of liquidation: changes in airline productivity in the United States, 2000– 2004. Transp. Res. Part A: Policy Pract. 42(2), 414–426. doi:10.1016/j.tra.2007.11.001
Greer, M.R. (2009). Is it the labor unions’ fault? Dissecting the causes of the impaired technical efficiencies of the legacy carriers in the United States. Transp. Res. Part A: Policy Pract. 43(9/10), 779–789. doi: 10.1016/j.tra.2009.07.007
Inglada, V., Rey, B., Rodriguez-Alvarez, A., and Coto-Millan, P. (2006). Liberalisation and efficiency in
international air transport. Transp. Res. Part A: Policy Pract. 40(2), 95–105.
doi:10.1016/j.tra.2005.04.006
Jiang, H., and Zhang, Y. (2016). An investigation of service quality, customer satisfaction and loyalty in China's
airline market. J. Air Transp. Manag. 57, 80-88.doi:10.1016/j.jairtraman.2016.07.008
Kumbhakar, S.C., and Lovell, C.A.K. (2000). Stochastic Frontier Analysis. Cambridge UK: Cambridge
University Press.
Lee, B.L., and Worthington, A.C. (2014). Technical efficiency of mainstream airlines and low-cost carriers: New evidence using bootstrap data envelopment analysis truncated regression. J. Air Transp. Manag. 38, 15-20. doi: 10.1016/j.jairtraman.2013.12.013
Lei, Z., and O’Connell, J. F. (2011, October). Aviation policy in China: an analysis of recent developments,
eAnalyst (Key Policy Issue).Retrieved from
http://www.iata.org/whatwedo/Documents/economics/Lei-OConnell-Aviation-Policy-in-China.pdf
Liu, Z., and Lynk, E.L. (1999). Evidence on market structure of the deregulated US airline industry. Appl. Econ. 31(9), 1083–1092. doi:10.1080/000368499323562
Lozano, S., and Gutiérrez, E. (2011). Slacks-based measure of efficiency of airports with airplanes delays as
undesirable outputs. Comput. Oper. Res. 38, 1, 131-139. doi:10.1016/j.cor.2010.04.007
Lozano, S., Gutiérrez, E., and Moreno, P. (2013). Network DEA approach to airports performance assessment
20
Merkert, R., and Hensher, D.A. (2011). The impact of strategic management and fleet planning on airline efficiency: a random effects Tobit model based on DEA efficiency scores. Transp. Res. Part A: Policy
Pract. 45(7), 686–695. doi: 10.1016/j.tra.2011.04.015.
Ouellette, P., Petit, P., Tessier-Parent, L.-P., and Vigeant, S. (2010). Introducing regulation in the measurement of efficiency, with an application to the Canadian air carriers industry. European J. Oper. Res. 200(1), 216–226. doi: 10.1016/j.ejor.2008.11.041
Oum, T.H., and Yu, C. (1995) A productivity comparison of the world’s major airlines. J. Air Transp. Manag. 2(3/4), 181–195. doi: 10.1016/0969-6997(96)00007-5
Schmidt, P., Sickles, R.C. (1984). Production frontiers and panel data. J. Bus. Econ. Stat. 2(4), 367–374.
Shaw, S. L., Lu, F., Chen, J., and Zhou, C. (2009). China’s airline consolidation and its effects on domestic airline
networks and competition. J. Transp. Geogr. 17(4), 293-305.doi:10.1016/j.jtrangeo.2009.02.005
Sjögren, S., and Söderberg, M. (2011). Productivity of airline carriers and its relation to deregulation, privatisation and membership in strategic alliances. Transp. Res. Part E: Logist. Transp. Rev. 47(2), 228–237. doi: 10.1016/j.tre.2010.09.001
Tavassoli, M., Faramarzi, G.R., and Saen, R.F. (2014). Efficiency and effectiveness in airline performance using a SBM-NDEA model in the presence of shared input. J. Air Transp. Manag. 34, 146-153. doi: 10.1016/j.jairtraman.2013.09.001
Tsionas, E.G. (2002). Stochastic frontier models with random coefficients.Journal of Applied Econometrics,
17:2, pp. 127-147.
Tsionas, E.G. (2006). Inference in dynamic stochastic frontier models. J. Appl. Econ. 21 (5), 669-676. doi:10.1002/jae.862
Vlachos, I., and Lin, Z. (2014). Drivers of airline loyalty: Evidence from the business travelers in China. Transp.
Res. Part E: Logist. Transp. Rev. 71, 1-17.doi:10.1016/j.tre.2014.07.011
Wang, J., Bonilla, D., and Banister, D. (2016). Air deregulation in China and its impact on airline competition
1994–2012 J. Transp. Geogr. 50, 12-23.doi:10.1016/j.jtrangeo.2015.03.007
Wang, K., Fan, X., Fu, X., and Zhou, Y. (2014). Benchmarking the performance of Chinese airlines: An investigation of productivity, yield and cost competitiveness. J. Air Transp. Manag. 38, 3-14. doi:10.1016/j.jairtraman.2013.12.012
Wanke, P., Barros, C., and Chen, Z. (2015). An analysis of Asian airlines efficiency with two-stage TOPSIS and
MCMC generalized linear mixed models. Int. J. Prod. Econ. 169, 110-126.
doi:10.1016/j.ijpe.2015.07.028
Wanke, P., Barros, C.P., Nwaogbe, O. R.. (2016a). Assessing productive efficiency in Nigerian airports using
Fuzzy-DEA. Transp. Policy, 49, p. 9-19.doi:10.1016/j.tranpol.2016.03.012
Wanke, P., and Barros, C.P. (2016b). Efficiency in Latin American airlines: A two-stage approach combining Virtual Frontier Dynamic DEA and Simplex Regression. J. Air Transp. Manag. 54, 93-103. doi:10.1016/j.jairtraman.2016.04.001
Windle, R.J. (1991). The World’s Airlines: a cost and productivity comparison. J. Transp. Econ. Policy, 25, 31– 49.
Wu, Y., He, C., and Cao, X. (2013). The impact of environmental variables on the efficiency of Chinese and other non-Chinese airlines. J. Air Transp. Manag. 29, 35-38. doi:10.1016/j.jairtraman.2013.02.004
Yu, M-M. (2010). Assessment of airport performance using the SBM-NDEA model. Omega, 38 (6), 440–452.
doi:10.1016/j.omega.2009.11.003
Yu, M-M. (2004). Measuring physical efficiency of domestic airports in Taiwan with undesirable outputs and
21