Phosphorus (P) is an essential nutrient for plants that can considerably affect the yield level and yield stability of many crops. Its interaction with nitrogen significantly contributes to optimum crop yield and nitrogen use efficiency (Usherwood and Segars 2001). Phosphorus can also be a harmful pollutp-ing agent of surface waters (Schröder et al. 2011). It was reported several times that the system-atic phosphorus fertilization increases the plant extractable soil phosphorus content (Lásztity and Csathó 1995, Blake et al. 2000, Izsáki 2009, Ma et al. 2009). The accumulation rate was found to be dependent on the soil type, cropping system, climatic conditions, as well as on the phosphorus dose. In European field experiments (three sites with different soils in the humid oceanic and humid continental climatic regions), where the annual P fertilizer dose ranged between 23 and 35 kg/ha, the soil phosphorus content did not increase sig-nificantly (Blake et al. 2000). On a chernozem soil (Hungary: temperate climate) a 100 kg/ha increase of the P balance raised the AL-P content of the ploughed layer by 3.1–4.4 mg/kg/year, when the different P fertilizer levels were compared (Izsáki
2009). At different sites in China having different soil types, with 65.5 kg/ha/year P fertilization dose accumulation rates of POlsen content varying between 0.95 and 1.24 mg/kg/year were observed (Ma et al. 2009).
The total soil P content (inorganic and organic forms) is usually divided into different pools (e.g. stable, labile, available) to ease the modelling of soil phosphorus balance (Jones et al. 1984). The primary purpose of crop simulation models is to describe the processes of the very complex atmosphere-soil-plant system using mathematical tools and to simulate them with the help of computers. There are many well-developed, user friendly software packages available (e.g. DSSAT, Jones et al. 2003). Though, there are some exceptions (Daroub et al. 2003, Dzotsi et al. 2010); many crop models do not include phosphorus, and therefore the effect of this nutrient is neglected during calculations.
In this study the 4M crop simulation model is presented and tested against measured data. Since 4M is a clone of the CERES model (Ritchie et al. 1998) originally, it did not have a P module, similarly to its ancestor. The objectives of this
Modeling the phosphorus balance of different soils
using the 4M crop model
G. Máthé-Gáspár, N. Fodor
Institute for Soil Sciences and Agricultural Chemistry, Centre for Agricultural Research,
Hungarian Academy of Sciences, Budapest, Hungary
ABSTRACT
Our study focuses on the phosphorus (P) balance in two long-term fertilization experiments which were carried out in characteristic soils of Hungary with four fertilization treatments and four main crops. The objectives of this study are: (1) to quantify the P accumulation rate in the upper soil layers and (2) to calibrate and validate the P-bal-ance module of the 4M crop model.The concentration of ammonium-lactate soluble P (AL-P) increased with time in both soils. The mean AL-P accumulation rates in the 0–20, 20–40 and 40–60 cm soil layers were 3.7, 0.7, 0.1 and 3.7, 4.3, 0.6 mg/kg/year in the chernozem and the sandy soil, respectively. The P accumulation rates in the top layers (0–20 cm) changed significantly in time as these gradually decreased from around 6.5 mg/kg/year to zero in about 26 years in both soils. The model results of the phosphorus content in different soil layers, as well as the plant phos-phorus uptake were in good agreement with the observed values.
Keywords: long-term experiments; topsoil; plant; accumulation; migration
Supported by the Hungarian Scientific Research Foundation, Projects No. OTKA K68884 and K67672.
-study are: (1) to quantify the P accumulation rate in three soil layers (0–20, 20–40, 40–60 cm) of two Hungarian soils in two long-term fertilizer experiments and (2) to calibrate and validate the newly developed P-balance module (Fodor et al. 2012) of the 4M crop model.
MATERIAL AND METHODS
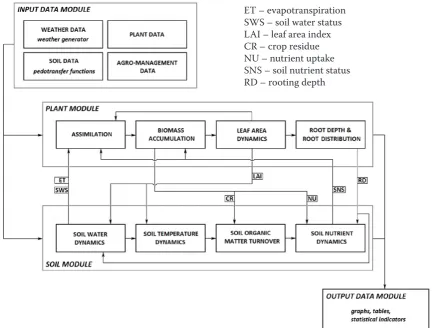
4M is a daily-step, deterministic crop simula-tion model (Fodor and Kovacs 2005, Fodor and Pásztor 2010). It simulates the major processes of the atmosphere-soil-plant system including human activities (Figure 1). The P module of 4M, which was based on the work of Jones et al. (1984), is able to handle a practically infinite number of soil lay-ers. Since every described pool and process occur in every single layer, for the sake of simplicity, the following description refers to one particular layer and day. The phosphorus turnover model breaks up the soil-plant system into three pools (Figure 2): (i) a stabile pool that comprises any phosphorus form that cannot be taken up by plants; (ii) a plant extractable nutrient pool that is postulated to be equivalent with the AL soluble soil phosphorus fraction; and (iii) a plant nutrient pool. Within
the module, the following processes are described between the pools: (1) the plant nutrient uptake determined by the demand-supply relations. The P demand depends on genetic factors as well as on the development stage of the plant, while the supply of the soil depends on the amount of phosphorus in the extractable pool, as well as on the soil water content and temperature; (2) the aging of the ‘fresh’ soil phosphorus content; (3) the nutrient immobili-zation and release of nutrients. Though phosphorus is usually considered to be an immobile element in the soil in coarse textured soils P leaching can-not be neglected (Matula 2009). Thus, the down-ward movement of phosphorus is also simulated. A detailed description of the phosphorus turnover module can be found in Fodor et al. (2012).
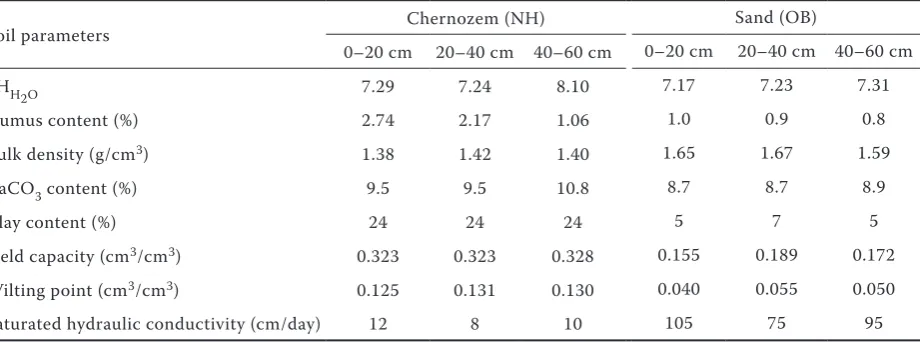
Data for calibrating and validating the phos-phorus balance module were collected from two experimental sites having calcareous chernozem soil at Nagyhörcsök (NH) and calcareous sandy soil at Őrbottyán (OB) (Table 1). Daily maximum and minimum temperature and precipitation were measured at the sites. As required by the 4M model, daily global radiation was estimated using these variables by the S-shape method (Fodor 2012).
Crops of the long-term experiment (1984–2008) were maize, winter wheat, spring barley and
win-Figure 1. Simplified flowchart of the 4M crop model
[image:2.595.82.518.420.748.2]ter rape. Four fertilization treatments were set up receiving uniform 44 kg P/ha and 166 kg K/ha doses each year along with 0, 150, 300 and 450 kg N/ha doses, respectively. Soil samples were taken in four replicates from all treatments from the 0–20, 20–40, 40–60 cm soil layers in 1984, 1990, 1995, 2003, 2004, 2005, 2007 and 2008. Plants were sampled each year following harvest.
The nutrient content of plants was measured with ICP-OES method (Matula 2010) after plant digestion by cc. HNO3. Soil ammonium lactate soluble P fraction was determined according to the method of Egner et al. (1960): Add 100 mL ammonium-lactate solution, pH 3.70 (0.1 mol/L ammonium-lactate and 0.4 mol/L acetic acid) to 5 g air dried soil, shake for 2 h and filtrate, de-termine P using ICP-OES (Jobin Yvon Ultima 2
Manufactured by HORIBA Scientific, Longjumeau, France).
The changes of the phosphorus accumulation rate in the 0–20, 20–40 and 40–60 cm soil layers were investigated. A second order polynomial function (f) was fitted on the measured soil AL-P values (Figure 3). This function can be used for extrapolating the accumulation rate values beyond the ending date of the experiment. The date of saturation, when the accumulation rate becomes zero, can be determined by finding the date sat-isfying the f’ = 0 condition, where f’ denotes the first derivative of the f function.
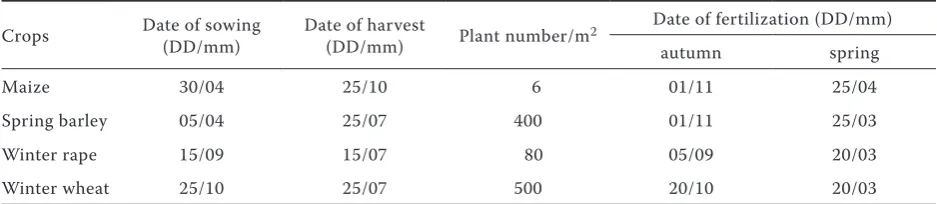
The plant production data (planting date, plant density, fertilization doses, etc.) were recorded in each year. In Table 2 only the characteristic values are presented since the actual dates were subject to change due to environmental (e.g. water content of the topsoil) and technical (e.g. availability of machinery) factors.
The plant specific parameters of the model were adjusted by inverse modeling (Soetaert and Petzoldt 2010) so that the simulated occurrence dates of the major phenological stages as well as the calculated yield and biomass values would be in the best agree-ment with the observed values. To carry out this procedure the length of the phenophases, the light use efficiency and the matter-area conversion factor for calculating LAI development were altered sys-tematically till the difference between the observed and calculated values reached its minimum.
[image:3.595.76.283.60.245.2]Measured soil AL-P contents of the N150 and N300 treatments were selected for NH (chernozem) and OB (sand), respectively, because the highest average yields were observed in these treatments. Four parameters (Table 3) of the P module were adjusted in order to achieve the smallest average Figure 2. Simplified flowchart of the soil-plant
phos-phorus module. (1A and 1B) plant nutrient uptake; (2) aging of ‘fresh’ soil phosphorus content; (3) nutrient immobilization and release of nutrients
Table 1. Parameters of the investigated soils in the 0–20, 20–40 and 40–60 cm soil layers at the beginning of the long-term experiment (1984, Nagyhörcsök (NH) and Őrbottyán (OB), Hungary)
Soil parameters Chernozem (NH) Sand (OB)
0–20 cm 20–40 cm 40–60 cm 0–20 cm 20–40 cm 40–60 cm
pHH2O 7.29 7.24 8.10 7.17 7.23 7.31
Humus content (%) 2.74 2.17 1.06 1.0 0.9 0.8
Bulk density (g/cm3) 1.38 1.42 1.40 1.65 1.67 1.59
CaCO3 content (%) 9.5 9.5 10.8 8.7 8.7 8.9
Clay content (%) 24 24 24 5 7 5
Field capacity (cm3/cm3) 0.323 0.323 0.328 0.155 0.189 0.172
Wilting point (cm3/cm3) 0.125 0.131 0.130 0.040 0.055 0.050
[image:3.595.71.532.591.762.2]difference between the measured and calculated soil AL-P contents.
The very same model parameter values that were determined during the calibration were used for validation. The simulation results and the observed soil P and plant uptake values were compared us-ing graphical and statistical indicators.
RESULTS AND DISCUSSION
The P accumulation rates in the topsoil changed significantly during the long-term fertilization experiments. According to the applied extrapo-lation method (polynomial fit) the saturation of the ‘extractable’ P-pool of the topsoil (0–20 cm) required about 26 years in both soils. The initial and the average rates were 6.5 and 3.7 mg P/kg/ year, respectively, for both soils. In the second layer (20–40 cm), the AL-P accumulation process differed significantly for the two soils. The phos-phorus accumulated almost 6 times faster in the sandy soil (average rate: 4.3 mg P/kg/year) than in the loamy, chernozem soil (average rate: 0.7 mg P/kg/year). Similar observations were made by Lásztity (1991) for sandy soils. In this layer, the accumulation rates were practically invariant during the time span of the experiment for both
soils. The AL-P content of the deeper (40–60 cm) soil layer did not change in the chernozem soil, but in the sandy soil it was increasing slowly but continuously.
Significant differences could be observed between the N0 and N150 treatments as far as the plant P uptake was concerned. In the N0 treatments 711 and 400 kg/ha total phosphorus uptakes were observed at the NH and OB sites, respectively dur-ing the 24 years of the experiments. In the N150 treatments the corresponding values were 1014 and 576 kg P/ha for the two sites. In the treatments with higher N doses no further significant change in the plant P uptake was observed. Total plant P uptakes from the applied amount (2400 kg P/ha in 24 years) were the following: OB – 16.7, 24.0, 26.7 and 26.8%; NH – 29.6, 42.3, 41.0 and 41.2% for the 0, 150, 300 and 450 treatments, respectively.
The similar rates (3.7 mg P/kg/year) of phos-phorus accumulation in the 0–20 layers did not reflect the different phosphate fixation capacity of the two soils. This could be explained by the higher phosphorus leaching rate in the sandy soil. The lower phosphate absorption capacity of the sandy soils together with the lower plant P uptake allow more phosphorus to freely migrate downward with the percolating soil water.
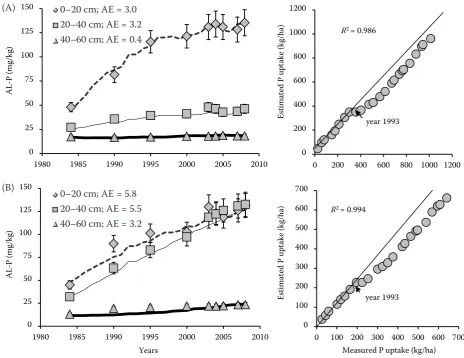
The parameter results of the model calibration are presented in Table 3. The model outputs were plotted against the measured values in Figure 4. The P module of the 4M crop model could simulate the trends of the soil phosphorus content and the plant uptake at an acceptable level. The model was successful in differentiating between the two soils regarding their phosphorus accumulation charac-teristics which are considerably different especially for the 20–40 cm layer. The calculated soil AL-P values were within the measurement error defined range of the observed values except for the bottom layer (40–60 cm) of the sandy soil in the first period of the experiment (Figure 4). This deviation could be explained by the overestimation of the plant P uptake in this period. Though, in general, the model slightly overestimated the plant P uptake, there was
y = –0.114x2 + 460x – 462392
R² = 0.996
0 25 50 75 100 125 150
1980 1985 1990 1995 2000 2005 2010
AL
-P
(m
g/
kg)
[image:4.595.66.291.62.213.2]Years
Figure 3. Measured soil AL-P values and the fitted poly-nomial function in the N450 treatment at Nagyhörcsök (chernozem), Hungary
Table 2. Agro-management data of the investigated crops. Dates are averages for the 1984–2008 period
Crops Date of sowing (DD/mm) Date of harvest (DD/mm) Plant number/m2 Date of fertilization (DD/mm)
autumn spring
Maize 30/04 25/10 6 01/11 25/04
Spring barley 05/04 25/07 400 01/11 25/03
Winter rape 15/09 15/07 80 05/09 20/03
[image:4.595.63.532.658.760.2]one particular year (1993, indicated in Figure 4) when the simulated crop was failed resulting in practically zero estimated phosphorus uptake. 1993 was a year with severe drought with only 166 mm precipitation in the vegetation period (maize; April 20th–September 20th). Despite this fact the real plants took up 56 and 30 kg/ha phosphorus at the NH and the OB sites, respectively.
Using the calibrated parameter values the model provided good estimations of the soil phosphorus ac-cumulation and plant phosphorus uptake (Figures 5
[image:5.595.68.529.76.182.2]and 6) for the rest of the treatments at both sites. The average relative difference between the ob-served and calculated uptakes for the 24 years of the experiments ranged between 5 and 17% for the 6 (3 + 3) treatments. The model was able to simulate the phosphorus saturation in the 0–20 cm at Nagyhörcsök (chernozem) as well as in the 0–20 and 20–40 cm layers at Őrbottyán (sand). The model was also able to predict the consider-able downward flow of phosphorus in the coarse textured sandy soil.
Table 3. Values of the calibrated parameters of the phosphorus module
Parameter Value
chernozem sand Maximum P transformation rate between the extractable and stabile pools (kg/ha/day) 0.00055 0.0001
Equilibrium ratio of the extractable/stabile pools 1/8 1/4
P release rate from the extractable pool (kg/ha/day) 0.0008 0.0012
P drainage rate (kg/ha/day/mm) 0.003 0.010
Figure 4. Measured (dots) and simulated (lines) soil AL-P values as well as the cumulative plant phosphorus uptake in the N150 treatment at (A) Nagyhörcsök (chernozem) and in the N300 treatment at (B) Őrbottyán (sand), Hungary. The dimension of the average error (AE) values is mg/kg. Vertical error bars on the soil AL-P graphs denote the measurement error (± 10%)
0 25 50 75 100 125 150
1980 1985 1990 1995 2000 2005 2010
AL
-P
(mg/
kg)
0-20 cm; AE=3.0 20-40 cm; AE=3.2 40-60 cm; AE=0.4
0 200 400 600 800 1000 1200
0 200 400 600 800 1000 1200
Est
im
at
ed
P
u
pt
ak
e (
kg
/h
a) R2 = 0.986
year 1993
0 25 50 75 100 125 150
1980 1985 1990 1995 2000 2005 2010
AL
-P
(mg/
kg)
Years 0-20 cm; AE=5.8
20-40 cm; AE=5.5 40-60 cm; AE=3.2
0 100 200 300 400 500 600 700
0 100 200 300 400 500 600 700
Est
im
at
ed
P
u
pt
ak
e (
kg
/h
a)
Measured P uptake (kg/ha)
R2 = 0.994
year 1993 (A)
(B)
0–20 cm; AE = 3.0 20–40 cm; AE = 3.2 40–60 cm; AE = 0.4
[image:5.595.62.527.351.709.2]On the other hand, the comparison of the model and experimental results revealed some weaknesses of the model. Possible explanations for the devia-tions that could be observed in the graphs are the following. (1) There is only a smaller amount of available measured data for the early but more dynamic period (1984–2000) of the accumulation process which made it more difficult to accurately calibrate the model. (2) Due to the crop rotation
[image:6.595.65.524.191.707.2](plants with early and late harvest alternated) the soil sampling could not be carried on the same date in each year. Differences in the environmen-tal circumstances (e.g. soil moisture content) at sampling may affect the soil AL-P content (Štípek et al. 2004). (3) Both soils have horizons with smooth transitions which had to be simplified by defining distinct soil layers with sharp boundar-ies for the simulations. (4) The model parameters
Figure 5. Measured (dots) and simulated (lines) soil AL-P values as well as the cumulative plant phosphorus uptake in the (A) N0; (B) N300, and (C) N450 treatments at Nagyhörcsök (chernozem), Hungary. The dimension of the average error (AE) values is mg/kg. Vertical error bars on the soil AL-P graphs denote the measurement error (± 10%)
0 25 50 75 100 125 150
1980 1985 1990 1995 2000 2005 2010
AL
-P
(mg/
kg)
0-20 cm; AE=8.4 20-40 cm; AE=2.6 40-60 cm; AE=0.5
0 200 400 600 800 1000 1200
0 200 400 600 800 1000 1200
Est
im
at
ed
P
u
pt
ak
e (
kg
/h
a) R2 = 0.980
0 25 50 75 100 125 150
1980 1985 1990 1995 2000 2005 2010
AL
-P
(mg/
kg)
0-20 cm; AE=4.9 20-40 cm; AE=2.4 40-60cm; AE=1.0
0 200 400 600 800 1000 1200
0 200 400 600 800 1000 1200
Est
im
at
ed
P
u
pt
ak
e (
kg
/h
a) R2 = 0.985
0 25 50 75 100 125 150
1980 1985 1990 1995 2000 2005 2010
AL
-P
(mg/
kg)
Years 0-20 cm; AE=5.1
20-40 cm; AE=4.4 40-60 cm; AE=1.4
0 200 400 600 800 1000 1200
0 200 400 600 800 1000 1200
Est
im
at
ed
P
u
pt
ak
e (
kg
/h
a)
Measured P uptake (kg/ha) R2 = 0.987
(A)
(B)
(C)
0–20 cm; AE = 8.4 20–40 cm; AE = 2.6 40–60 cm; AE = 0.5
0–20 cm; AE = 4.9 20–40 cm; AE = 2.4 40–60 cm; AE = 1.0
describing the phosphorus balance of the simulated soil-plant system were considered to be invariant for the 24-year-long experiments though these parameters could be subject to change as they are interdependent on other system variables (Helal and Dressler 1989).
During the timeframe of the experiment the measured humus content increased significantly in the highest N fertilizer treatment on sandy soil
[image:7.595.64.525.192.717.2](from 1% to 1.3%), but the simulated humus content of this treatment did not increase with the same intensity (from 1% to 1.15%) which could cause the underestimation of the soil P content as it can be seen in Figure 6. The higher soil organic matter content results in higher water storing capacity which affects (stimulates) soil microbial activ-ity (Szili-Kovács et al. 2007), plant growth and consequently the soil phosphorus balance as well.
Figure 6. Measured (dots) and simulated (lines) soil AL-P values as well as the cumulative plant phosphorus uptake in the (A) N0; (B) N150, and (C) N450 treatments at Őrbottyán (sand), Hungary. The dimension of the average error (AE) values is mg/kg. Vertical error bars on the soil AL-P graphs denote the measurement error (± 10%)
0 25 50 75 100 125 150
1980 1985 1990 1995 2000 2005 2010
AL
-P
(mg/
kg)
0-20 cm; AE=5.5 20-40 cm; AE=2.2 40-60 cm; AE=4.0
0 100 200 300 400 500 600 700
0 100 200 300 400 500 600 700
Est
im
at
ed
P
u
pt
ak
e (
kg
/h
a) R2 = 0.991
0 25 50 75 100 125 150
1980 1985 1990 1995 2000 2005 2010
AL
-P
(mg/
kg)
0-20 cm; AE=4.7 20-40 cm; AE=7.0 40-60 cm; AE=3.3
0 100 200 300 400 500 600 700
0 100 200 300 400 500 600 700
Est
im
at
ed
P
u
pt
ak
e (
kg
/h
a) R2 = 0.979
0 25 50 75 100 125 150
1980 1985 1990 1995 2000 2005 2010
AL
-P
(mg/
kg)
Years 0-20 cm; AE=11.2
20-40 cm; AE=14.3 40-60 cm; AE=6.7
0 100 200 300 400 500 600 700
0 100 200 300 400 500 600 700
Est
im
at
ed
P
u
pt
ak
e
(k
g/
ha
)
Measured P uptake (kg/ha)
R2 = 0.993 (A)
(B)
(C)
0–20 cm; AE = 5.5 20–40 cm; AE = 2.2 40–60 cm; AE = 4.0
0–20 cm; AE = 4.7 20–40 cm; AE = 7.0 40–60 cm; AE = 3.3
The accuracy of the P module is interdependent on other modules of the crop model, thus the predictions of the P balance could be enhanced by improving the interrelated modules or by better parametrization of the functions describing the connections between the modules. The model could be further developed by enabling it to use parameters changing in time. According to the results, the capability of the model to handle/simu-late extreme climatic events (e.g. severe drought) should be enhanced as it is a week point of crop models in general (Van der Velde et al. 2012).
REFERENCES
Blake L., Mercik S., Körschens M., Moskal S., Poulton P.R., Goulding K.W.T., Weigel A., Powlson D.S. (2000): Phosphorus content in soil, uptake by plants and balance in three European long-term field experiments. Nutrient Cycling in Agroecosystems, 56: 263–275. Daroub S.H., Gerakis A., Ritchie J.T., Friesen D.K., Ryan J. (2003):
Development of a soil-plant phosphorus simulation model for calcareous and weathered tropical soils. Agricultural Systems,
76: 1157–1181.
Dzotsi K.A., Jones J.W., Adiku S.G.K., Naab J.B., Singh U., Porter C.H., Gijsman A.J. (2010): Modeling soil and plant phosphorus within DSSAT. Ecological Modelling, 221: 2839–2849. Egner H., Riehm H., Domingo W. (1960): Unterschuchungen über
die chemische Bodenanalyse als Grundlage für die Beurteilung des Nährstoffzustandes der Böden II. Chemische Extraktions-methoden zur Phosphor- und Kaliumbestimmung. Kungliga Lantbrukshögskolans Annale, 26: 199–215. (In German) Fodor N., Kovács G.J. (2005): Sensitivity of crop models to the
inaccuracy of meteorological observations. Physics and Chem-istry of the Earth, Parts A/B/C, 30, 53–57.
Fodor N., Pásztor L. (2010): The agro-ecological potential of Hun-gary and its prospective development due to climate change. Applied Ecology and Environmental Research, 8: 177–190. Fodor N. (2012): Improving the S-shape solar radiation
estima-tion method for supporting crop models. The Scientific World Journal, Article ID 768530, doi:10.1100/2012/768530 Fodor N., Máthéné-Gáspár G., Németh T. (2012): Modeling
the nutrient balance of the soil-plant system using the 4M simulation model. Communications in Soil Science and Plant Analysis, 43: 60–70.
Helal M., Dressler A. (1989): Mobilization and turnover of soil phosphorus in the rhizosphere. Journal of Plant Nutrition and Soil Science, 152: 175–180.
Izsáki Z. (2009): Phosphorus turnover of chernozen meadow soil in a long-term mineral fertilisation field experiment. Cereal Research Communications, 37: 49–52.
Jones C.A., Cole C.V., Sharpley A.N., Williams J.R. (1984): A simplified soil and plant phosphorus model. I. Documentation. Soil Science Society of America Journal, 48: 800–805. Jones J.W., Hoogenboom G., Porter C.H., Boote K.J., Batchelor
W.D., Hunt L.A., Wilkens P.W., Singh U., Gijsman A.J., Ritchie J.T. (2003): The DSSAT cropping system model. European Journal of Agronomy, 18: 235–265.
Lásztity B., Csathó P. (1995): Studies on the effect of NPK fertiliza-tion in long-term experiments on pseudomyceliar chernozem soil in the Mezőföld region. Agrochemistry and Soil Science,
44: 47–62. (In Hungarian)
Lásztity B. (1991): Investigation of the after-effects of build-up rates of phosphorus and potassium fertilization on calcare-ous slightly humcalcare-ous sandy soils. Agrokémia és Talajtan, 40: 419–429. (In Hungarian)
Ma Y., Li Y., Li X., Tang X., Liang Y., Shaomin H.S., Wang B., Liu H., Yang X. (2009): Phosphorus accumulation and depletion in soils in wheat-maize cropping systems: Modeling and valida-tion. Field Crops Research, 110: 207–212.
Matula J. (2009): Possible phosphorus losses from the top layer of agricultural soils by rainfall simulations in relation to multi-nutrient soil tests. Plant, Soil and Environment, 55: 511–518. Matula J. (2010): Differences in available phosphorus evaluated
by soil tests in relation to detection by colorimetric and ICP-AES techniques. Plant, Soil and Environment, 56: 297–304. Ritchie J.T., Singh U., Godwin D.C., Bowen W.T. (1998): Cereal
growth, development and yield. In: Tsuji G.Y., Hoogenboom G., Thornton P.K. (eds): Understanding Options for Agricultural Production. Kluwer Academic Publishers, Amsterdam. Schröder J.J., Smit A.L., Cordell D., Rosemarin A. (2011):
Im-proved phosphorus use efficiency in agriculture: A key re-quirement for its sustainable use. Chemosphere, 84: 822–831. Soetaert K., Petzoldt T. (2010): Inverse modelling, sensitivity
and Monte Carlo analysis in R using package FME. Journal of Statistical Software, 33: 1–28.
Štípek K., Vaněk V., Száková J., Černý J., Šilha J. (2004): Temporal variability of available phosphorus, potassium and magnesium in arable soil. Plant, Soil and Environment, 50: 547–551. Szili-Kovács T., Török K., Tilston E.L., Hopkins D.W. (2007):
Promoting microbial immobilization of soil nitrogen during restoration of abandoned agricultural fields by organic addi-tions. Biology and Fertility of Soils, 43: 823–828.
Usherwood N.R., Segars W.I. (2001): Nitrogen interactions with phosphorus and potassium for optimum crop yield, nitrogen use effectiveness, and environmental stewardship. The Scientific World Journal, 1: 57–60.
van der Velde M., Tubiello F.N., Vrieling A., Bouraoui F. (2012): Impacts of extreme weather on wheat and maize in France: evaluating regional crop simulations against observed data. Climatic Change, 113: 751–765.
Received on May 2, 2012
Corresponding author:
Nandor Fodor, Ph.D., Centre for Agricultural Research of the Hungarian Academy of Sciences, Herman Ottó str. 15., H-1022 Budapest, Hungary