Weed control is a decisive and one of the most difficult agricultural arrangements in sugar beet (Beta vulgaris ssp. vulgaris var. altissima) growing. Main reasons include slow early growth of sugar beet, its very low competitive ability at the begin-ning of vegetation, high sensitivity to herbicides (mainly in early growth stages), and also high cost of special herbicides. Moreover, using herbicides in sugar beet usually induced a decrease of root yield, even in the cases when visual symptoms of injury are not evident (Abdollahi and Ghadiri 2004).
Competition can be defined as a contest of plants under limited supply of environmental factors (light, water, nutrients, etc.). Most of weeds can uptake nutrients and water better than crop (Mesbah 1993). In agrophytocoenosis, competi-tion is strongly affected by the time of single weed emergence in crop canopy and by the duration of weed viability (Keeley and Thullen 1991). Duration of that period is most often related to the sum of
effective temperatures of the crop (Dunan et al. 1996, Ferrero et al. 1996, Martinková and Honěk 2001) or to the crop growth stage (Chykoye et al. 1995). For example, Kropff et al. (1992) made an ecophysiologigal model for an effect of competi-tion of Chenopodum album on sugar beet – the main factor for reduced yield loss of sugar beet was an emergence timing of weeds compared to crop. The weeds, whose emergence before sprout-ing of crop is more competitive, can cause higher yield loss in low weed intensity.
To calibrate empirical models of crop yield loss based on relative weed green area to different grow-ing seasons, detailed knowledge of growth charac-teristics (RGR, NAR, LAR, etc.) of weeds and crops is necessary (Storkey 2004). Sugar beet yield is not influenced by early season competition when weeds are controlled within four to six weeks of planting. This term for controlling weeds may be shortened when weed density is high, or when soil nutrients
Competitive relationships between sugar beet and weeds
in dependence on time of weed control
M. Jursík, J. Holec, J. Soukup, V. Venclová
Department of Agroecology and Biometeorology, Czech University of Life Sciences,
Prague, Czech Republic
ABSTRACT
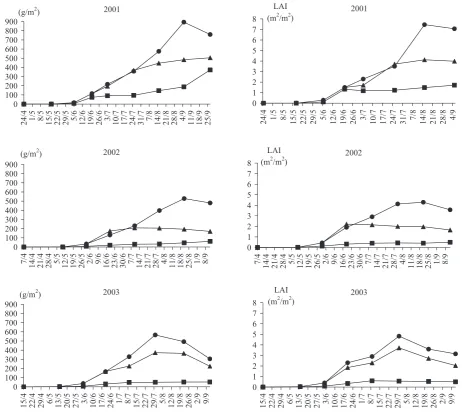
Small plot trials were carried out in years 2001–2003 with sugar beet. In the treatment without weed control, dry weight of sugar beet top and LAI of sugar beet were very low (approx. 50 g/m2 and 0.5 m2/m2, respectively). Yield
loss of sugar beet was 80–93%. Dominant weeds were Chenopodium album, Fumaria officinalis and Galium apari-ne. In the treatments where weeds were removed (by hand) until 4 leaf stage of sugar beet, dry weight of sugar beet top and LAI of sugar beet at first increased normally, but were markedly decreased from the half of the vegetation period. Yield loss of sugar beet was 54–28%. Dominant weed in this treatment was Amaranthus retroflexus. The development of sugar beet top dry weight and LAI of sugar beet was practically identical in the treatments where weeds were removed until 8–10 leaf stage of the crop and in those where weeds were removed during the whole vegetation period (500–900 g/m2, or 4–7 m2/m2, respectively). No yield loss of sugar beet was recorded. Dry weight
of weeds did not exceed 30 g/m2 and LAI 0.1 m2/m2. A. retroflexus and Mercurialis annua were the most frequent
weeds in this treatment.
Keywords: sugar beet; weed competition; yield loss; annual weeds; seed production; reproductive ability; time of emergence; competition
and moisture are limited (Mesbah 1993). Weeds can also lower the quality of sugar beet by reducing sucrose content (Mesbah 1993).
Environmental conditions throughout the grow-ing season may significantly impact the interaction between sugar beet and weeds. Moisture and light are probably the most important factors, but tem-perature also influences relations between sugar beet and weeds. Sugar beets generally are more sensitive to weeds under condition that favour high yield.
The intensity of competition is closely relat-ed to serelat-ed production of werelat-eds in single crop. Information about generative production of weeds is so far not available for many weed species un-der field conditions. If we want to predict weed population dynamics in agroecosystems, we must know the influence of crop on seed production of weeds (Norris 1996).
Understanding the emergence characteristics of weeds can be helpful in determining the opti-mum time to apply postemergence herbicide. This becomes especially important when using micro herbicide rates. A comparison of the germination temperature of common weed species with those of various crops including sugar beet shows why certain weeds may cause more problems in early sowing than in late sowing. The aim of our work was to determine critical period of sugar beet with regard to weeds, to measure possible competition of single weeds and evidence of influence of weed emergence time on sugar beet root yield and seed production of weeds.
MATERIAL AND METHODS
Small plot trials were carried out in Central Bohemia after winter wheat as fore crop in years 2001–2003. Plot size was 2.25 m (5 rows) × 20 m. The experiment fields were chosen with respect to weed infestation and therefore there were mi-nor agricultural differences among experimental years. Differences in sowing time of sugar beet
were caused by weather conditions (soil moisture) in experimental years. General information about experimental sugar beet stands is given in Table 1. The trial had four treatments in four replications. First treatment was without weed control (A). In the second treatment, weeds were removed (by hand) until 4 leaf stage of sugar beet (B). In the third treatment, weeds were removed until 8–10 leaf stage of sugar beet (C). In the fourth treatment, weeds were removed during the whole vegetation time (D).
Information about experimental canopy of sug-ar beet in individual yesug-ars is shown in Table 1. Observation and sampling were carried out at 3-week intervals. Number of weeds, dry weight and LAI of the aboveground biomass of weeds and sugar beet were observed. Size of samples was 1 m2 from each plot. Growth characteristics: relative growth rate (RGR), relative leaves growth rate (RLGR) and net assimilation rate (NAR) were calculated. Main weeds on experimental fields were Chenopodium album, Amaranthus retroflexus and Mercurialis annua (the latter only in years 2001 and 2003). Yield test was carried out before harvest; moreover, 5 plants of weeds were collected from each plot, in order to determine seed production from different treatments. Results were analysed in programme Statgraphic 4.0. by an analysis of variance accord-ing to the Tukey HSD (α = 0.05). Logistic regression function was used to create the dependence of weed aboveground biomass dry weight (g/m2) and weed aboveground biomass relative dry weight (g/g/m2) on relative yield loss of sugar beet.
RESULTS AND DISCUSSION
Growth and development of sugar beet top (shoot)
[image:2.595.64.536.646.761.2]In the treatment A (without weed control), dry weight of sugar beet top (aboveground) and LAI sugar beet increased throughout the vegetation
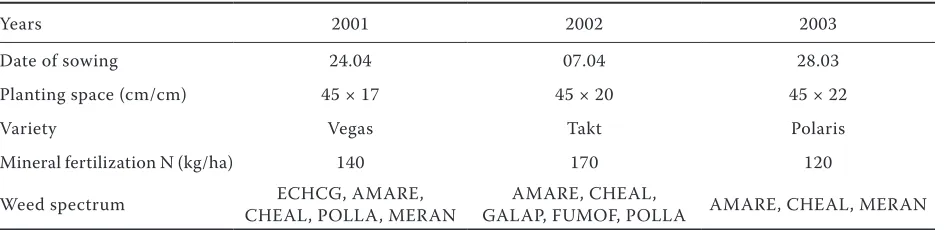
Table 1. General information about experimental canopy of sugar beet
Years 2001 2002 2003
Date of sowing 24.04 07.04 28.03
Planting space (cm/cm) 45 × 17 45 × 20 45 × 22
Variety Vegas Takt Polaris
Mineral fertilization N (kg/ha) 140 170 120
period only very slowly. In years 2002 and 2003, top of sugar beet dry weight was approx. 50 g/m2 and LAI of sugar beet was approx. 0.5 m2/m2. Only in 2001, top of sugar beet dry weight and LAI were higher (more than 200 g/m2 and 2.0 m2/m2, respectively).
Initial increase of sugar beet top dry weight and LAI in the treatments B, C and D were approxi-mately identical. However, from the half of the vegetation period, the rate of sugar beet top dry weight markedly decreased in the treatment B.
Development of sugar beet top dry weight and LAI of sugar beet were practically identical in the treatments C and D in all years. Sugar beet top dry weight and LAI were increasing throughout all the vegetation period. A slight decline came towards the end of August and in September. Sugar beet top
dry weight varied between 500–900 g/m2 and LAI of sugar beet varied between 4–7 m2/m2, depend-ing on the year. Dry weight and LAI of sugar beet top in the treatments C and D were 4–10 times higher than in the treatment A (Figure 1).
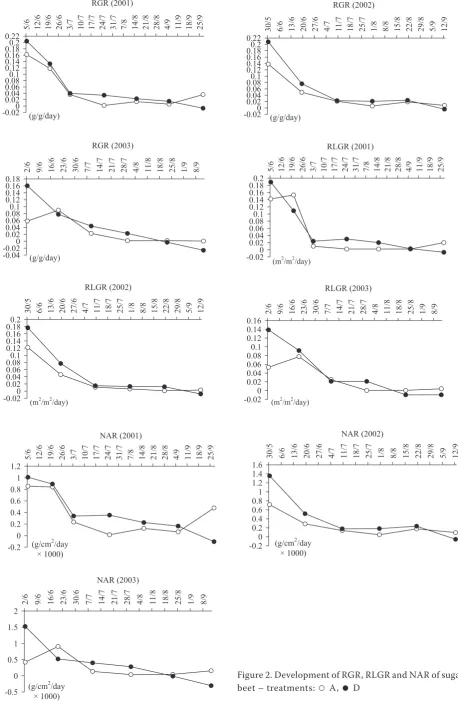
Differences between the treatments in the val-ues of RGR, RLGR and NAR of sugar beet top were minimal, nevertheless periodical in every experimental year. Important differences were observed only between the treatments A compared to C and D (Figure 2).
Growth and development of weeds
Chenopodium album dominated in the ment A, in all experimental years. In this
treat-Figure 1. Development of dry weight of sugar beet top from m2 (on the left) and LAI of sugar beet (on the right)
– treatments: ■ A, ▲ B, ● C
2002 0 100 200 300 400 500 600 700 800 900 7/ 4 14 /4 21 /4 28
/4 5/5 12/5
19
/5
26
/5 2/6 9/6 16/6
23
/6
30
/6 7/7 14/7
21
/7
28
/7 4/8 11/8
18
/8
25
/8 1/9 8/9
(g/m2) 2002
0 1 2 3 4 5 6 7 8 7/ 4 14 /4 21 /4 28
/4 5/5 12/5
19
/5
26
/5 2/6 9/6 16/6
23
/6
30
/6 7/7 14/7
21
/7
28
/7 4/8 11/8
18
/8
25
/8 1/9 8/9 LAI
(m2/m2)
2003 0 100 200 300 400 500 600 700 800 900 15 /4 22 /4 29
/4 6/5 13/5
20
/5
27
/5 3/6 10/6
17
/6
24
/6 1/7 8/7 15/7
22
/7
29
/7 5/8 12/8
19
/8
26
/8 2/9 9/9
(g/m2) 2003
0 1 2 3 4 5 6 7 8 15 /4 22 /4 29
/4 6/5 13/5
20
/5
27
/5 3/6 10/6
17
/6
24
/6 1/7 8/7 15/7
22
/7
29
/7 5/8 12/8
19
/8
26
/8 2/9 9/9 LAI
(m2/m2)
2001 0 100 200 300 400 500 600 700 800 900 24
/4 1/5 8/5 15/5
22
/5
29
/5 5/6 12/6
19
/6
26
/6 3/7 10/7
17
/7
24
/7
31
/7 7/8 14/8
21
/8
28
/8 4/9 11/9
18
/9
25
/9
(g/m2) 2001
0 1 2 3 4 5 6 7 8 24
/4 1/5 8/5 15/5
22
/5
29
/5 5/6 12/6
19
/6
26
/6 3/7 10/7
17
/7
24
/7
31
/7 7/8 14/8
21
/8
28
/8 4/9 LAI
[image:3.595.66.529.310.726.2]Figure 2. Development of RGR, RLGR and NAR of sugar beet – treatments: ○ A, ● D
RGR (2001) -0.020 0.02 0.04 0.06 0.080.1 0.12 0.14 0.16 0.180.2 0.22 5/ 6 12 /6 19 /6 26 /6 3/ 7 10 /7 17 /7 24 /7 31 /7 7/ 8 14 /8 21 /8 28 /8 4/ 9 11 /9 18 /9 25 /9 (g/g/day) RGR (2002) -0.020 0.02 0.04 0.06 0.080.1 0.12 0.14 0.16 0.180.2 0.22 30 /5 6/ 6 13 /6 20 /6 27 /6 4/ 7 11 /7 18 /7 25 /7 1/ 8 8/ 8 15 /8 22 /8 29 /8 5/ 9 12 /9 (g/g/day) RGR (2003) -0.04 -0.020 0.02 0.04 0.06 0.080.1 0.12 0.14 0.16 0.18 2/ 6 9/ 6 16 /6 23 /6 30 /6 7/ 7 14 /7 21 /7 28 /7 4/ 8 11 /8 18 /8 25 /8 1/ 9 8/ 9 (g/g/day) RLGR (2001) -0.020 0.02 0.04 0.06 0.080.1 0.12 0.14 0.16 0.180.2 5/ 6 12 /6 19 /6 26 /6 3/ 7 10 /7 17 /7 24 /7 31 /7 7/ 8 14 /8 21 /8 28 /8 4/ 9 11 /9 18 /9 25 /9
(m2/m2/day)
RLGR (2002) -0.020 0.02 0.04 0.06 0.080.1 0.12 0.14 0.16 0.180.2 30 /5 6/ 6 13 /6 20 /6 27 /6 4/ 7 11 /7 18 /7 25 /7 1/ 8 8/ 8 15 /8 22 /8 29 /8 5/ 9 12 /9
(m2/m2/day)
NAR (2001) -0.2 0 0.2 0.4 0.6 0.8 1 1.2 5/ 6 12 /6 19 /6 26 /6 3/ 7 10 /7 17 /7 24 /7 31 /7 7/ 8 14 /8 21 /8 28 /8 4/ 9 11 /9 18 /9 25 /9
(g/cm2/day
× 1000) NAR (2002) -0.20 0.2 0.4 0.6 0.81 1.2 1.4 1.6 30 /5 6/ 6 13 /6 20 /6 27 /6 4/ 7 11 /7 18 /7 25 /7 1/ 8 8/ 8 15 /8 22 /8 29 /8 5/ 9 12 /9
(g/cm2/day
× 1000) NAR (2003) -0.5 0 0.5 1 1.5 2 2/ 6 9/ 6 16 /6 23 /6 30 /6 7/ 7 14 /7 21 /7 28 /7 4/ 8 11 /8 18 /8 25 /8 1/ 9 8/ 9
(g/cm2/day
× 1000) RLGR (2003) -0.020 0.02 0.04 0.06 0.080.1 0.12 0.14 0.16 2/
6 9/6 16/6 23/6 30/6 7/7 14/7 /721 28/7 4/8 11/8 18/8 25/8 1/9 8/9
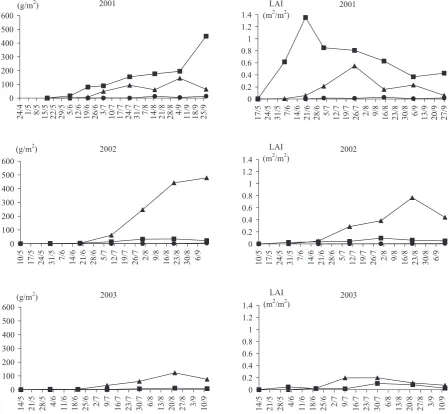
ment, Ch. album showed the highest dry weight of the aboveground biomass. In 2002, experimental field was highly infested by Fumaria officinalis and Galium aparine (winter annual weeds), which dominated in the first half of the vegetation period. In the second half of vegetation, F. officinalis as well as G. aparine were suppressed by summer annual weeds, especially by Ch. album. An in-crease of the aboveground biomass dry weight of Amaranthus retroflexus was slightly slower compared to Ch. album; only in 2001 (late sow-ing of sugar beet) A. retroflexus prevailed in the treatment A (Figure 3).
Sugar beet dominated in the treatment B till half of June. During July, dry weight of aboveground biomass and LAI of A. retroflexus increased rapidly. Ch. album occurred minimally (Figure 4).
Sugar beet dominated throughout the vegetation period in the treatment C in every experimental year. At any assessment, dry weight and LAI of weeds did not exceed 30 g/m2 and 0.1 m2/m2, re-spectively. A. retroflexus and Mercurialis annua (Figure 5) prevailed in this treatment. Ch. album was not successful.
Differences between the treatments in the values of RGR, RLGR and NAR of weeds were minimal and irregular.
Reproduction ability of weeds
Highest generative potential was determined for A. retroflexus and Ch. album. However, high generative ability of Ch. album declined with
in-Figure 3. Development of dry weight of aboveground biomass of Amaranthus retroflexus from m2 (on the left)
and LAI of A. retroflexus (on the right) – treatments: ■ A, ▲ B, ● C
2001
0 100 200 300 400 500 600
24
/4 1/5 8/5 15/5
22
/5
29
/5 5/6 12/6
19
/6
26
/6 3/7 10/7
17
/7
24
/7
31
/7 7/8 14/8
21
/8
28
/8 4/9 11/9
18
/9
25
/9
(g/m2) 2001
0 0.2 0.4 0.6 0.8 1 1.2 1.4
17
/5
24
/5
31
/5 7/6 14/6
21
/6
28
/6 5/7 12/7
19
/7
26
/7 2/8 9/8 16/8
23
/8
30
/8 6/9 13/9
20
/9
27
/9
LAI (m2/m2)
2002
0 100 200 300 400 500 600
10
/5
17
/5
24
/5
31
/5 7/6 14/6
21
/6
28
/6 5/7 12/7
19
/7
26
/7 2/8 9/8 16/8
23
/8
30
/8 6/9
(g/m2) 2002
0 0.2 0.4 0.6 0.8 1 1.2 1.4
10
/5
17
/5
24
/5
31
/5 7/6 14/6
21
/6
28
/6 5/7 12/7
19
/7
26
/7 2/8 9/8 16/8
23
/8
30
/8 6/9 LAI
(m2/m2)
2003
0 100 200 300 400 500 600
14
/5
21
/5
28
/5 4/6 11/6
18
/6
25
/6 2/7 9/7 16/7
23
/7
30
/7 6/8 13/8
20
/8
27
/8 3/9 10/9
(g/m2) 2003
0 0.2 0.4 0.6 0.8 1 1.2 1.4
14
/5
21
/5
28
/5 4/6 11/6
18
/6
25
/6 2/7 9/7 16/7
23
/7
30
/7 6/8 13/8
20
/8
27
/8 3/9 10/9 LAI
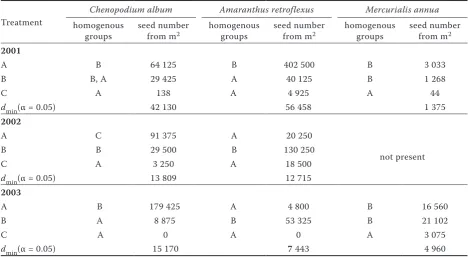
[image:5.595.73.522.310.724.2]creasing of time between sugar beet emergence and emergence of Ch. album. It was due to a very low emergence rate of Ch. album in second, third and other emergence waves. On the contrary, A. retroflexus was better established in the treat-ment B. Only in 2001, treattreat-ment A showed the highest seed production (late sowing of sugar beet). A. retroflexus and M. annua showed relatively a high seed production in the treatment C. On the contrary, Ch. album showed a low reproductive ability in this treatment (Table 2).
Yield loss of sugar beet and prediction of yield loss
The length of weed-free period affected yield of sugar beet very markedly. In the treatment A,
7–20% yield was reached compared to D (in average 7.99 t/ha). In the treatment B, 46–72% yield was reached compared to D (in average 38.89 t/ha). In the treatment C, 98–102% yield was reached compared to D (in average 62.82 t/ha). Differences between the treatments were significant; only between C and D no significant difference in any year was recorded (Table 3).
[image:6.595.69.527.62.467.2]Dry weight of weeds in the growth 8–10 true leaf-stage of sugar beet (BBA 25–27) was used to show dependence of dry weight aboveground biomass of weeds (g/m2) on relative yield loss of sugar beet (R2 = 89.79). For a closer relationship, dry weight of weeds was recomputed to relative dry weight of weeds (g/g/m2) – rate between dry weight of weeds and dry weight of sugar beet top (R2 = 91.6). Used data were taken from every plot with weeds (Figures 6 and 7).
Figure 4. Development of dry weight of aboveground biomass of Chenopodium album from m2 (on the left) and
LAI of Ch. album (on the right) – treatments: ■ A, ▲ B, ● C
2001
0 100 200 300 400 500 600 700 800 900
17
/5
24
/5
31
/5 7/6 14/6
21
/6
28
/6 5/7 12/7
19
/7
26
/7 2/8 9/8 16/8
23
/8
30
/8 6/9 13/9
20
/9
27
/9
(g/m2) 2001
0 0.5 1 1.5 2 2.5
17
/5
24
/5
31
/5 7/6 14/6
21
/6
28
/6 5/7 12/7
19
/7
26
/7 2/8 9/8 16/8
23
/8
30
/8 6/9 13/9
20
/9
27
/9
LAI (m2/m2)
2002
0 100 200 300 400 500 600 700 800 900
10
/5
17
/5
24
/5
31
/5 7/6 14/6
21
/6
28
/6 5/7 12/7
19
/7
26
/7 2/8 9/8 16/8
23
/8
30
/8 6/9
(g/m2) 2002
0 0.5 1 1.5 2 2.5
10
/5
17
/5
24
/5
31
/5 7/6 14/6
21
/6
28
/6 5/7 12/7
19
/7
26
/7 2/8 9/8 16/8
23
/8
30
/8 6/9 LAI
(m2/m2)
2003
0 100 200 300 400 500 600 700 800 900
14
/5
21
/5
28
/5 4/6 11/6
18
/6
25
/6 2/7 9/7 16/7
23
/7
30
/7 6/8 13/8
20
/8
27
/8 3/9 10/9
(g/m2) 2003
0 0.5 1 1.5 2 2.5
14
/5
21
/5
28
/5 4/6 11/6
18
/6
25
/6 2/7 9/7 16/7
23
/7
30
/7 6/8 13/8
20
/8
27
/8 3/9 10/9 LAI
Figure 5. Development of dry weight of aboveground biomass of Mercurialis annua from m2 (on the left) and
LAI of M. annua (on the right) – treatments: ■ A, ▲ B, ● C
Table 2. Influence of length of weed-free period in sugar beet on seed production of weeds
Treatment
Chenopodium album Amaranthus retroflexus Mercurialis annua
homogenous
groups seed number from m2 homogenous groups seed number from m2 homogenous groups seed number from m2
2001
A B 64 125 B 402 500 B 3 033
B B, A 29 425 A 40 125 B 1 268
C A 138 A 4 925 A 44
dmin(α = 0.05) 42 130 56 458 1 375
2002
A C 91 375 A 20 250
not present
B B 29 500 B 130 250
C A 3 250 A 18 500
dmin(α = 0.05) 13 809 12 715
2003
A B 179 425 A 4 800 B 16 560
B A 8 875 B 53 325 B 21 102
C A 0 A 0 A 3 075
dmin(α = 0.05) 15 170 7 443 4 960
On primary weed infestation of sugar beet in the Czech Republic participated mainly Chenopodium album and some winter and spring weeds (Galium aparine, Tripleurospermum maritimum, Fumaria
officinalis, etc.). If this primary weed infestation is not controlled, it may markedly decrease the yield of sugar beet roots and also increase weed soil seed bank. Mainly Ch. album has a very high 2001
0 10 20 30 40 50 60 70 80 90
17
/5
24
/5
31
/5 7/6 14/6
21
/6
28
/6 5/7 12/7
19
/7
26
/7 2/8 9/8 16/8
23
/8
30
/8 6/9 13/9
20
/9
27
/9
(g/m2) 2001
0 0.2 0.4 0.6 0.81 1.2 1.4 1.6
17
/5
24
/5
31
/5 7/6 14/6
21
/6
28
/6 5/7 12/7
19
/7
26
/7 2/8 9/8 16/8
23
/8
30
/8 6/9 13/9
20
/9
27
/9
LAI (m2/m2)
2003
0 10 20 30 40 50 60 70 80 90
15
/4
22
/4
29
/4 6/5 13/5
20
/5
27
/5 3/6 10/6
17
/6
24
/6 1/7 8/7 15/7
22
/7
29
/7 5/8 12/8
19
/8
26
/8 2/9 9/9
(g/m2) 2003
0 0.2 0.4 0.6 0.81 1.2 1.4 1.6
15
/4
22
/4
29
/4 6/5 13/5
20
/5
27
/5 3/6 10/6
17
/6
24
/6 1/7 8/7 15/7
22
/7
29
/7 5/8 12/8
19
/8
26
/8 2/9 9/9 LAI
[image:7.595.63.534.507.764.2]Table 3. Influence of length of weed-free period on sugar beet and years on yield of sugar beet roots
Effect of length of period without weeds
(treatments) on sugar beet yield Effect of years on sugar beet yield
treatment homogenous groups (t/ha)yield year homogenous groups (t/ha)yield
A A 7.99 2001 C 52.13
B B 38.89 2002 A 36.44
C C 62.82 2003 B 41.08
D C 63.16
dmin(α = 0.05) 5.23 dmin(α = 0.05) 4.11
reproductive ability. Late sowing canopy of sugar beet may be also markedly infested by Amaranthus retroflexus and Echinochloa crus-galli.
If primary weed infestation is controlled, mainly summer weeds that require high minimum tem-perature to germinate (A. retroflexus, E. crus-galli, etc.) may emerge in a number of waves (Jursík et al. 2004). This weed infestation may markedly de-cline yield of sugar beet roots, reduce crop quality (sugar content) and strongly increase soil seed bank (Mesbah 1993). Especially A. retroflexus has a very high reproductive ability in this case. The grass weeds that have large seeds and a higher invest-ment in roots in the seedling stage (E. crus-galli) are usually more competitive later in the season when resources become limiting (Storkey 2004).
Late weed infestation (weeds emerged after clos-ing of sugar beet canopy) has no negative effect on yield of sugar beet roots. Nevertheless, it should be mentioned that A. retroflexus and Mercurialis
annua can assert also in well closed canopies of sugar beet and produce relatively lots of seeds. On the contrary, winter and spring annual weeds, similar to Ch. album, assert badly in well-closed canopy (Wellmann 1999, Jursík et al. 2003). Weed infestation by these weeds is mostly caused by choice of unsuitable herbicide, wrong term of application or bad establishment of canopy.
REFERENCES
Abdollahi F., Ghadiri H. (2004): Effect of separate and combined applications of herbicides on weed control and yield of sugar beet. Weed Technol., 18: 968–976.
[image:8.595.66.531.90.226.2]Chikoye D., Weise S.F., Swanton C.J. (1995): Influence of common ragweed (Ambrosia artemisiifolia) time of emergence and density on white bean (Phasealus vulgaris). Weed Sci., 43: 375–380.
Figure 6. Effect of dry weight of aboveground biomass of weeds (g/m2), in sugar beet BBA 25–27, on relative
yield loss (0–1) – results from 2001–2003
[image:8.595.303.527.232.416.2]Dunan C.N., Westra P., Moore F., Chapman P. (1996): Modelling the effect of duration of weed competition, weed density and weed competitiveness on seeded, irrigated onion. Weed Res., 36: 256–269.
Ferrero A., Scanzio M., Acutis M. (1996): Critical period of weed interference in maize. In: 2nd Inter. Weed
Control Congr., Copenhagen, Denmark: 171–176. Jursík M., Holec J., Soukup J. (2004): Biology and
con-trol of sugar beet significant weeds – barnyard grass (Echinochloa crus-galli L.). Listy Cukrov. Řep., 120: 47–51.
Jursík M., Soukup J., Venclová V., Holec J. (2003): Seed dormancy and germination of Shaggy soldier ( Ga-linsoga ciliata Blake) and Common lambsquarter (Chenopodium album L.). Plant Soil Environ., 49: 511–518.
Keeley P.E., Thullen R.J. (1991): Growth and interaction of barnyard grass (Echinochloa crus-galli) with cotton (Gossypium hirsutum). Weed Sci., 39: 369–375. Kropff M.J., Spitters C.J.T., Schnieders B.J., Joenje W.,
De Groot W. (1992): An eco-physiological model for
interspecific competition, applied to the influence of Chenopodium album L. on sugar beet. II. Model evaluation. Weed Res., 32: 451–463.
Martinková Z., Honěk A. (2001): The effect of time of weed removal on maize yield. Rostl. Výr., 47: 211–217.
Mesbah A. (1993): Interference of broadleaf and grassy weeds in sugar beet. [Ph.D. Thesis.] University of Wyoming, USA.
Norris R.F. (1996): Weed population dynamics: seed production. In: 2nd Inter. Weed Control Congr.,
Co-penhagen, Denmark: 15–20.
Storkey J. (2004): Modelling seedling growth rates of 18 temperate arable weed species as a function of the environment and plant traits. Ann. Bot., 93: 681–689.
Wellmann A. (1999): Comparative study on the compe-tition of Chenopodium album (L.) and Chamomilla recutita (L.) Rauschert with sugar beet. Zuckerin-dustrie, 124: 227–228.
Received on November 9, 2007
Corresponding author:
Ing. Miroslav Jursík, Ph.D., Česká zemědělská univerzita v Praze, Katedra agroekologie a biometerologie, Kamýcká 129, 165 21 Praha 6-Suchdol, Česká republika