R E S E A R C H
Open Access
Identification of phlebotomine sand flies using
one MALDI-TOF MS reference database and two
mass spectrometer systems
Alexander Mathis
1*, Jérôme Depaquit
2, Vit Dvo
ř
ák
3, Holly Tuten
1,9, Anne-Laure Bañuls
4, Petr Halada
5, Sonia Zapata
6,
Véronique Lehrter
2, Kristýna Hlava
č
ková
3, Jorian Prudhomme
4, Petr Volf
3, Denis Sereno
4, Christian Kaufmann
1,
Valentin Pflüger
7and Francis Schaffner
1,8Abstract
Background:Rapid, accurate and high-throughput identification of vector arthropods is of paramount importance in surveillance programmes that are becoming more common due to the changing geographic occurrence and extent of many arthropod-borne diseases. Protein profiling by MALDI-TOF mass spectrometry fulfils these requirements for identification, and reference databases have recently been established for several vector taxa, mostly with specimens from laboratory colonies.
Methods:We established and validated a reference database containing 20 phlebotomine sand fly (Diptera: Psychodidae, Phlebotominae) species by using specimens from colonies or field-collections that had been stored for various periods of time.
Results:Identical biomarker mass patterns (‘superspectra’) were obtained with colony- or field-derived specimens of the same species. In the validation study, high quality spectra (i.e. more than 30 evaluable masses) were obtained with all fresh insects from colonies, and with 55/59 insects deep-frozen (liquid nitrogen/-80 °C) for up to 25 years. In contrast, only 36/52 specimens stored in ethanol could be identified. This resulted in an overall sensitivity of 87 % (140/161); specificity was 100 %. Duration of storage impaired data counts in the high mass range, and thus cluster analyses of closely related specimens might reflect their storage conditions rather than phenotypic distinctness. A major drawback of MALDI-TOF MS is the restricted availability of in-house databases and the fact that mass spectrometers from 2 companies (Bruker, Shimadzu) are widely being used. We have analysed fingerprints of phlebotomine sand flies obtained by automatic routine procedure on a Bruker instrument by using our database and the software established on a Shimadzu system. The sensitivity with 312 specimens from 8 sand fly species from laboratory colonies when evaluating only high quality spectra was 98.3 %; the specificity was 100 %. The corresponding diagnostic values with 55 field-collected specimens from 4 species were 94.7 % and 97.4 %, respectively.
Conclusions:A centralized high-quality database (created by expert taxonomists and experienced users of mass spectrometers) that is easily amenable to customer-oriented identification services is a highly desirable resource. As shown in the present work, spectra obtained from different specimens with different instruments can be analysed using a centralized database, which should be available in the near future via an online platform in a cost-efficient manner.
Keywords:Arthropod identification, Bruker, Centralized reference database, Cross reference, Phlebotominae, Protein Profiling, Shimadzu, Spectra processing, Validation
* Correspondence:[email protected]
1
Swiss National Centre for Vector Entomology, Institute of Parasitology, University of Zürich, Winterthurerstrasse 266a, 8057 Zürich, Switzerland
Full list of author information is available at the end of the article
Background
The geographic occurrence and extent of arthropod-borne diseases is changing, due to globalisation and environmen-tal alterations. Most spectacular is the emergence of inva-sive species, e.g. Aedesmosquitoes [1, 2], with associated new disease threats [3]. Other arthropod vectors such as ticks (Ixodida: Ixodidae) [4, 5], biting midges (Diptera: Ceratopogonidae) [6] and phlebotomine sand flies (Dip-tera: Psychodidae) [7–9] are gradually expanding their dis-tribution ranges in Europe. Because these changes in vector distribution are associated with changes in the risk of exposure to the pathogens they transmit, monitoring the presence and abundances of arthropod vectors is of growing importance in many regions. Guidelines for sur-veillance and options for control have so far only been de-veloped for mosquitoes, both native and invasive species [2, 10, 11]. Regularly updated distribution maps for Europe are provided by ECDC (www.ecdc.europa.eu) for a num-ber of vectors (eight sand fly species, fiveAedesmosquito species, four tick species).
Undoubtedly, reliable, rapid and cost-effective identifica-tion of vector arthropods is a key element of surveillance programmes. Morphological identification requires at least some degree of proficiency and can be time-consuming, e.g. requiring slide preparations and in-depth analysis of characteristics such as the morphology of pharynx and genitalia in the case of sand flies [12]. However, morpho-logical identification can be difficult or impossible in many instances (e.g. due to specimens of sibling or cryptic spe-cies; damaged or incomplete specimens; life stages with few morphological features like eggs or larvae; poor pres-ervation methods or damage during shipment). In the case of sand flies, which are the focus of this paper, morpho-logical identification is sometimes hampered by the lack of comprehensive keys, minute species-distinctive characters in some subgenera and the existence of phenotypic plasti-city among populations [13, 14]. PCR-based approaches are established in different formats for a number of phle-botomine species (compiled by [15, 16]), but their validity may be impaired due to genetic variability at the target locus [17, 18]. Further, these approaches are generally con-sidered expensive and time-consuming.
As an alternative, protein profiling by matrix-assisted laser desorption/ionization time of flight mass spectrom-etry (MALDI-TOF MS), which is routinely used in clinical diagnostics of bacteria and fungi [19, 20] with high interla-boratory reproducibility [21], has recently been applied for the identification of a number of arthropods, including adult stages of vector taxa [15, 22–33]. In addition, protein profiles have been determined for larvae of holometabo-lousCulicoides biting midges and Culicidae [34, 35], and for eggs of nine aedine mosquito species [36]. MALDI-TOF MS was capable of identifying sister taxa and cryptic species [26, 28], and the method proved reliable for large
scale species identification of Culicoides biting midges (correct identification of 98.9 % of 1,200 field-collected specimens) as well as in the surveillance of invasive mos-quito species (identification of eggs from ovitraps; [28]).
This paper elaborates on the suitability of MALDI-TOF MS to identify adult phlebotomine sand flies, the biological vectors of a number of important protozoan and viral pathogens of medical or veterinary importance [7, 37, 38], extending the method from identifying specimens from la-boratory colonies [15] to identifying specimens collected in the field and stored for a prolonged period of time. In addition, we evaluated whether raw mass spectra obtained with the instrument of one company (Ultraflex III, Bruker, Germany) allow species identification by using the software and the reference database established on an instrument of another company (Axima Confidence, Shimadzu, Japan), whereby the two most widespread instrument series were involved. The ability to cross-reference specimens with non-parent databases would strongly enhance the value and availability of in-house reference databases established at different institutions.
Methods
Sand fly collection and morphological identification
Mass spectra were determined from sand fly specimens of 20 species obtained from field collections (9 species), col-onies (7) or both (4) (see Table 1 for origin, year of collec-tion). Sand flies were captured using CDC miniature light traps (John W. Hock Co. FL, USA) or sticky papers. Speci-mens were killed using carbon dioxide or liquid nitrogen and stored as described in Table 1. For morphological identification, head and genitalia of each specimen were processed and mounted on slides following traditional procedures [39] and the species determined using stand-ard keys [40–42]. The taxonomic abbreviations used are as described [43].
Generation of MALDI-TOF MS biomarker mass sets, validation study
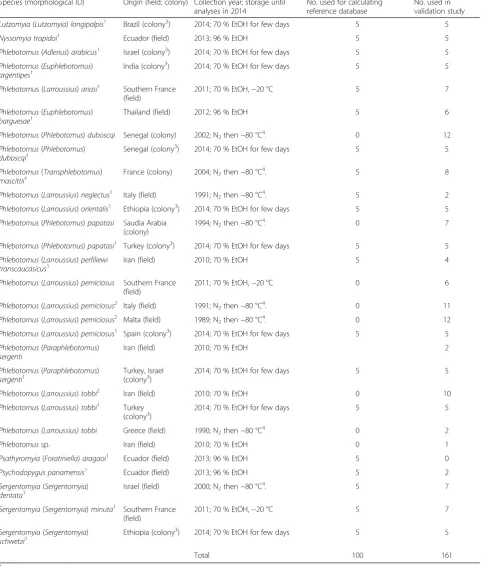
Table 1Features of the phlebotomine sand flies investigated in the experimental part of the study
Species (morphological ID) Origin (field; colony) Collection year; storage until analyses in 2014
No. used for calculating reference database
No. used in validation study
Lutzomyia(Lutzomyia)longipalpis1 Brazil (colony3) 2014; 70 % EtOH for few days 5 5
Nyssomyia trapidoi1 Ecuador (field) 2013; 96 % EtOH 5 5
Phlebotomus(Adlerius)arabicus1 Israel (colony3) 2014; 70 % EtOH for few days 5 5 Phlebotomus(Euphlebotomus)
argentipes1
India (colony3) 2014; 70 % EtOH for few days 5 5
Phlebotomus (Larroussius)ariasi1 Southern France (field)
2011; 70 % EtOH,−20 °C 5 7
Phlebotomus(Euphlebotomus)
barguesae1
Thailand (field) 2012; 96 % EtOH 5 6
Phlebotomus(Phlebotomus)duboscqi Senegal (colony) 2002; N2then−80 °C4. 0 12 Phlebotomus(Phlebotomus)
duboscqi1 Senegal (colony 3
) 2014; 70 % EtOH for few days 5 5
Phlebotomus(Transphlebotomus)
mascittii1
France (colony) 2004; N2then−80 °C4. 5 8
Phlebotomus(Larroussius)neglectus1 Italy (field) 1991; N2then−80 °C 4
. 5 2
Phlebotomus(Larroussius)orientalis1 Ethiopia (colony3) 2014; 70 % EtOH for few days 5 5
Phlebotomus(Phlebotomus)papatasi Saudia Arabia (colony)
1994; N2then−80 °C4. 0 7
Phlebotomus(Phlebotomus)papatasi1 Turkey (colony3) 2014; 70 % EtOH for few days 5 5 Phlebotomus(Larroussius)perfiliewi
transcaucasicus1
Iran (field) 2010; 70 % EtOH 5 4
Phlebotomus(Larroussius)perniciosus Southern France (field)
2011; 70 % EtOH,−20 °C 0 6
Phlebotomus(Larroussius)perniciosus2 Italy (field) 1991; N
2then−80 °C4. 0 11
Phlebotomus(Larroussius)perniciosus2 Malta (field) 1989; N
2then−80 °C4. 0 12
Phlebotomus(Larroussius)perniciosus1 Spain (colony3) 2014; 70 % EtOH for few days 5 5 Phlebotomus(Paraphlebotomus)
sergenti
Iran (field) 2010; 70 % EtOH 2
Phlebotomus(Paraphlebotomus)
sergenti1 Turkey, Israel(colony3) 2014; 70 % EtOH for few days 5 5 Phlebotomus(Larroussius)tobbi2 Iran (field) 2010; 70 % EtOH 0 10 Phlebotomus(Larroussius)tobbi1 Turkey
(colony3)
2014; 70 % EtOH for few days 5 5
Phlebotomus (Larroussius) tobbi Greece (field) 1990; N2then−80 °C4 0 2
Phlebotomussp. Iran (field) 2010; 70 % EtOH 0 1
Psathyromyia(Foratiniella)aragaoi1 Ecuador (field) 2013; 96 % EtOH 5 0
Psychodopygus panamensis1 Ecuador (field) 2013; 96 % EtOH 5 2
Sergentomyia(Sergentomyia)
dentata1 Israel (field) 2000; N2then−80 °C 4
. 5 7
Sergentomyia(Sergentomyia)minuta1 Southern France
(field)
2011; 70 % EtOH,−20 °C 5 7
Sergentomyia(Sergentomyia)
schwetzi1 Ethiopia (colony 3
) 2014; 70 % EtOH for few days 5 5
Total 100 161
1
Used for calculating reference database 2
Used for calculating alternative reference database (replacing spectra from colony insects, see also Fig.2) 3
Colonies maintained at Department of Parasitology, Charles University, Prague, Czech Republic [15] 4
SuperSpectra™. The threshold for identification was set at 75 % biomarker matches based on the reference data set, according to the SARAMIS™ user guideline. Spectra containing less than 30 data counts were considered low quality. A dendrogram was produced as described [27].
Analyses of raw data mass spectra obtained on Bruker mass spectrometer with Shimadzu software
Mass fingerprints generated using automatic routine proce-dures on an Ultraflex III MALDI TOF mass spectrometer (Bruker Daltonics, Bremen, Germany) [15] were analysed in a blinded manner with the SARAMIS™Premium soft-ware. Bruker mass lists were exported as mzXml files, adapted to the SARAMIS™Premium file format by use of an in-house phyton script and imported for automated identification. Mass lists obtained with insect thoraxes were available for 312 specimens ofPhlebotomus arabicus
(n = 13),Ph. argentipes(n = 20),Ph. duboscqi(n = 10),Ph. orientalis (n = 10), Ph. papatasi (n = 84), Ph. perniciosus
(n = 94),Ph. sergenti(n = 22),Ph. tobbi(n = 59) (from col-onies maintained in Prague and analysed after storage in 70 % EtOH overnight [15]) and from 55 field-collected (Karpathos island, Greece, stored in 70 % EtOH for several weeks)Ph. neglectus(n = 44); Ph. similis(n = 8);Ph. alex-andri(n = 1),Ph. galilaeus(n = 2) (total 367 specimens).
Genetic analyses
DNA was isolated from the remains of the abdomens with a kit (Qiamp DNA mini kit, Qiagen, Hildesheim, Germany) according to the manufacturer’s instruction and after mechanical homogenization as previously described [44]. Genetic characterisation by PCR/sequencing was mainly done at the mitochondrial cytochrome b gene (cyt b). The primers CB3_PDRmod (5’-CTC CYC ATA TYC AAC CWG AAT G-3’) and CB_R06mod (TAT CTA ATG KTT TCA AAA CAA TTG C-3’) were modified from described ones [45,46]. Species for which no corresponding cyt b se-quence was available in GenBank were characterized at the mitochondrial cytochrome c oxidase subunit I gene (COI) using primers LCO1490/HCO2198 [47] or at the small subunit nuclear ribosomal RNA gene using forward pri-mer F2 [48] and the new reverse pripri-mer R2_new (5’-GTC CTA TTC CAT TAT TCC ATG C-3’). Direct sequencing of the amplicons was performed by a private company (Synergene, Schlieren, Switzerland).
Results
Reference database
Biomarker mass patterns (‘superspectra’) were calculated for 20 sand fly species, by using 5 insects per species. Specimens from colonies (10 species) and insects collected in the field (10 species) were used (Table 1). Reference mass peaks were in the range of 4000 and, depending on the species, 9800 to 11400 Da. Identification of the
field-collected species could be confirmed by PCR/sequencing with 1 specimen per species for 8 of these 10 species. The two remaining species werePh. barguesae and Psathyro-myia aragaoi. In the case of Ph. barguesae, the partial (around 570 bp) sequence of the COI gene obtained from the field-collected specimens best matched with the two GenBank sequences ascribed to this species (acc. nos. FJ348734-5), but differed by 7 %. Another 5 specimens morphologically attributed to this species were then gen-etically characterized, yielding identical sequences. No single sequence was available in GenBank forPs. aragaoi, and partial cyt b and COI gene sequences have been de-posited [GenBank: KP763471, GenBank: KP763472].
Superspectra were calculated for the speciesPh. perni-ciosus and Ph. tobbi with 5 specimens each from either colonies or the field (Table 1), yielding identical masses.
Validation
The reference database was validated with 161 specimens from 19 species (Table 1). Eighty-four specimens were field-collected and stored in various media, 50 specimens were fresh from ongoing colonies of 10 species (that were also used to create the reference database), and 27 speci-mens were stored deep-frozen from earlier colonies. Altogether, 140 insects were correctly identified, including 77 specimens from colonies. Poor quality spectra (less than 30 data counts) were obtained with 20 field-collected spec-imens, of which 17 yielded no result upon automated iden-tification with SuperSpectra™. The analyses of the other 3 of these 20 low data count specimens produced discrepant identifications (in 2 of the 4 technical replicates, no identi-fication in the other two) as compared to morphological and genetic identification. Further, 2 insects probably were mislabelled asPh. perniciosus, as both mass spectrometry and DNA sequencing identified them as Ph. ariasi, and specimens of this species had been obtained from the same source. Finally, one specimen yielded a novel spectrum but was identified by morphology as Ph. perfiliewi, which is included in the database, and as belonging to thePh. perfi-liewicomplex by DNA analyses.
Thus, overall sensitivity of MALDI-TOF MS was 87 % (140/161); specificity (defined as 100 minus percentage of wrong identifications as compared to morphological iden-tification, all specimens considered that yielded an MS identification) was 97 % (139/144) or 100 % (when conse-quently omitting low data count specimens and consider-ing the probable mislabellconsider-ing in 2 cases).
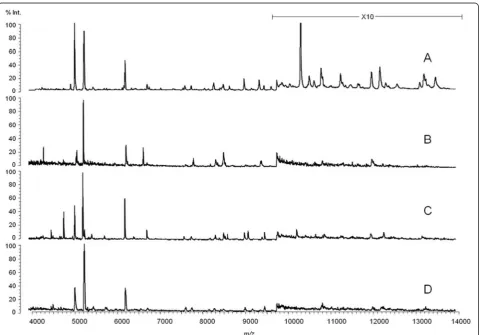
High quality spectra (i.e., equal to or more than 30 data counts) were obtained with all (n = 50) fresh insects from colonies, and with 55/59 insects from colonies or the field and stored deep-frozen (liquid nitrogen/-80 °C) for up to 25 years. In contrast, only 36/52 specimens stored in EtOH (70 or 95 %; room temperature or−20 °C) for only a few years could be identified (Table 1). Duration of storage impaired data counts in the high mass range as exemplified in Fig. 1.
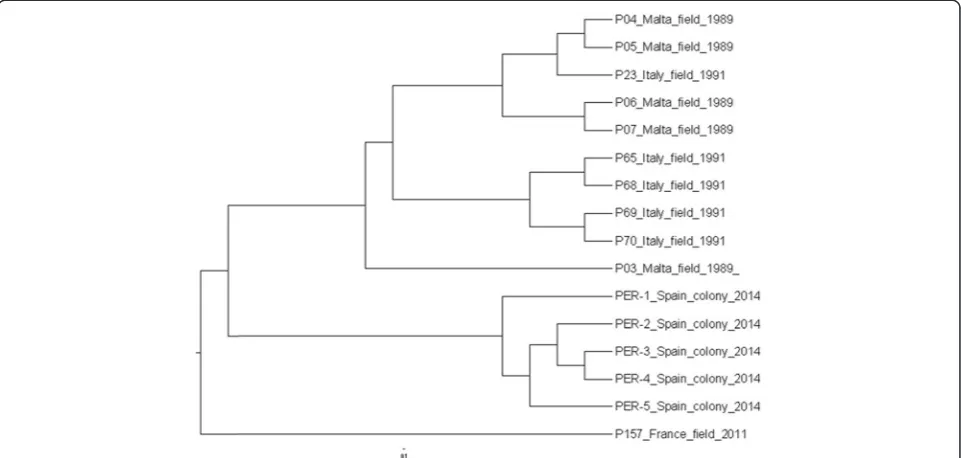
Different batches of sand fly specimens (colony, wild catches from different geographical origins and stored under different conditions and/or for different periods of time) were available for a few species. For example, a den-drogram of Ph. perniciosus groups is given in Fig. 2. The spectra from colony insects (originally from Spain) form a distinct cluster, whereas spectra of specimens from two geographical origins (Italy, Malta) and stored under com-parable conditions do not. A single spectrum available from a more recently collected Ph. perniciosus from France, which was stored differently, is placed on a distinct
branch, separated from both the colony- but also the other field-derived spectra.
Analyses of mass lists obtained on a Bruker instrument with a reference database (SARAMIS™) and reference spectra acquired on a Shimadzu instrument
Raw data from a total of 312 specimens from 8 sand fly species from laboratory colonies were analysed, resulting in the correct identification of 297 individuals. No identifi-cation was obtained for 15 specimens, of which 10 had low data count spectra (less than 30). Five spectra with a sufficient number of data counts (30 or more) could not be identified. No misidentification occurred (overall sensi-tivity 95.2; sensisensi-tivity considering only high quality spectra 98.3 %; specificity 100 %). Thirty-six of the 55 field-collected specimens from 4 species were identified in con-cordance with the morphological identification. The single specimen of Ph. alexandri had a high quality spectrum (data count of 57), but yielded no identification as this species was not included in the database. Seventeen
Fig. 1Matrix-assisted laser desorption/ionization time of flight (MALDI-TOF) mass spectra ofPhlebotomus perniciosus. (a) Fresh specimen from colony. (b) Field specimen stored in 70 % EtOH,−20 °C for 3 years. (c) Field specimen stored in N2then−80 °C since 1991. (d) Field specimen stored in N2
[image:5.595.59.542.357.692.2]spectra contained insufficient data counts and were not identified. One specimen morphologically identified asPh. galilaeusyielded a spectrum identified asPh. perniciosus. Thus, diagnostic parameters with the field-collected speci-mens differed slightly from laboratory collections (sen-sitivity considering only high quality spectra 94.7 %; specificity 97.4 %).
Discussion
MALDI-TOF MS reference database and validation
A MALDI-TOF MS database was established with 20 phlebotomine species. In selecting our study species, we took into account i) their vectorial role - in order to in-clude many species which are proven vectors of Leish-maniaspp., and ii) their taxonomic position - in order to compare closely related species and species belonging to different genera (Table 1). An evaluation of the database with 161 specimens revealed a robust sensitivity and a very high specificity of this approach. Twenty specimens were not (n = 17) or incorrectly (n = 3) identified due to low spectra quality (data count below 30). Thus, a thresh-old of 30 data counts, based on our experience with mass spectrometry analyses of Ceratopogonidae biting midges [26, 27], seems a useful criterion to exclude spectra from future analyses.
The major factor impairing mass spectrum quality seems to be the way the insects were stored rather than the dur-ation of storage, though this aspect has not systematically been addressed in the present study. Thus, e.g. 22/23 speci-mens ofPh. perniciosusstored for 25 years in liquid nitro-gen/-80 °C could be identified, but only 3/6 insects of the
same species stored since 2011 in 70 % EtOH at−20 °C could be identified. This confirms earlier findings that freezing is superior to EtOH as a storage medium, with EtOH at a concentration of 70 % being more suitable than higher concentrations, as experimentally determined with sand flies stored up to 75 days [15]. Thus, this ‘storage constraint’ limits the value of mass spectrometry for the identification of insects, as ethanol is the widely preferred storage medium. However, a high reliability of mass spec-trometry (98.9 % good quality spectra) was found with 1,200 field-collectedCulicoides specimens stored in 70 % EtOH at 4 °C for one year [49]. Most other studies on mass spectrometry as a tool for the identification of arthropods relied on fresh colony-derived specimens. Suc-cessful identification by MALDI-TOF MS with field-collected specimens was reported with ticks (stored in liquid nitrogen, [25]), tsetse flies (using air-dried wings, [50]; and mosquitoes (analysis of legs, storage conditions not described, [31]).
As also shown in our study, storage reduces the higher weight masses (Fig. 1). Identification to species level is un-affected by this constraint as reference masses are in the lower mass range. Identification of specimens from differ-ent geographic origins (given they were properly stored) was equally reliable by using superspectra derived with ei-ther insects fresh from colonies or wild-catches from stor-age (Table 1). However, higher resolution (e.g.,‘fine typing’ with regard to geographical origin of specimens or lower taxonomic levels) might be critical as the topography of a dendrogram created in cluster analyses could reflect the storage conditions of the analysed specimens rather than
[image:6.595.58.539.90.319.2]phenotypic distinctness (see also Fig. 2). The identification of cryptic insect species (Anophelesspp.) and even the clas-sification of specimens from different laboratory colonies were possible with a standardized approach (fresh speci-mens, same feed etc.) [28], but seem improbable with field-collected specimens. Thus, care should be taken not to over-interpret cluster analyses of mass spectra obtained from field-collected and stored specimens.
A novel spectrum was obtained for a specimen that morphologically was identified as a species (Ph. perfi-liewi) that is included in the database. This species is known to exist as a complex of species [12] which might explain variability in mass spectra. All morphologically identified Ph. barguesae specimens had considerable genetic differences at the barcoding locus from corre-sponding GenBank entries. Genetic variability of this species, which is characterized by a unique morphology of the female spermathecae [51], has been observed among populations from different caves (Depaquit, unpublished). Further studies employing mass spectrom-etry to different populations of freshly collected speci-mens and the comparison with results of DNA-based molecular approaches might contribute to elucidate taxonomic relationships. This technique shall be espe-cially considered when dealing with species complexes likePh. perfiliewiorPh. majorwhich are incriminated in transmission of medically importantLeishmania species and represent a taxonomic challenge.
Analyses of mass lists obtained on a Bruker instrument with a reference database (SARAMIS™) and reference spectra acquired on a Shimadzu instrument
Comparative studies have shown that the performance of the two systems (Shimadzu, Bruker) for the identifica-tion of microorganisms in clinical laboratories is com-parable [52, 53]. Exchangeability of data obtained on the two different instruments, however, has to the best of our knowledge not been reported so far. Here, we show that fingerprints of phlebotomine sand flies obtained by automatic routine procedure on a Bruker instrument allow for reliable (high values of diagnostic parameters) determination of species by using the database and the software (SARAMIS™) established on a Shimadzu instru-ment. The sensitivity of this analysis was high despite slight differences in sample preparation [15] and mass ranges considered (Bruker: 2–25 kDa; Shimadzu: 3– 20 kDa). Non-identifiable spectra mostly contained few data counts (n = 10) or low intensity peaks (n = 3), and these spectra could not be identified with the Bruker Biotyper software either. Two spectra of good quality did not have sufficient matches for automated identifi-cation with superspectra, though their identifiidentifi-cation (Ph. argentipes,Ph. perniciosus) was possible with man-ual full comparison.
Conclusions
The power of mass spectrometric identification of organ-isms depends on the quality of the available database (i.e., reference quality, taxonomic coverage) and its accessibility. The first aspect requires the participation of expert taxono-mists, particularly when dealing with closely related species, and experienced users of mass spectrometers who keep a high quality standard for generating the spectra. It further advocates for a centralized, comprehensive database, rather than scattered in-house ones. Accessibility (i.e., the analysis of specimens by third parties) might be an issue at scientific institutions where capacity for analysis, availability and will-ingness of an operator could be limiting factors. Therefore, a centralized database and analyses at a private company, which provides a customer-oriented service, is a valu-able alternative for greater sustainability. As shown in the present work, spectra obtained with different instruments can be analysed using such a centralized database, and this should be possible in the near future via an online platform in a cost-efficient manner.
Competing interests
V.P. is employed by Mabritec SA, a commercial service laboratory. The other authors declare that they have no competing interests.
Authors’contributions
AM, VP and FS conceived the study; JD, VD, ALB, SZ, VL, KH, JP, PV, DS performed field collections and morphological identification of specimens; VD, KH and PV were involved in insect rearing; AM and HT performed genetic identification; PH and VP carried out the mass spectrometry analyses; AM, HT, CK, VP and FS performed the data analyses; AM and HT drafted the manuscript. All authors contributed to writing the manuscript and have approved the final version.
Acknowledgments
We thank Jeannine Hauri for excellent technical support, and greatly acknowledge the Swiss Food Safety and Veterinary Office as sponsor of the Swiss National Centre for Vector Entomology. We also thank Bernard Pesson and Mohammad Akhoundi for providing us many specimens. The work of AM, VD, HT, CK and FS was done under the frame of EurNegVec COST Action TD1303. The work of VD, PH, PV and KH was supported by the Czech Science Foundation (project GACR 15-04329S). The work of PH was also supported by the Institutional Research Project of the Institute of Microbiology (RVO61388971). The work of ALB, JP and DS has been supported by the EDENext project (reference nr. EDENext329). We are also grateful to the PhDB group of Montpellier for the field collection.
Author details
1
Swiss National Centre for Vector Entomology, Institute of Parasitology, University of Zürich, Winterthurerstrasse 266a, 8057 Zürich, Switzerland.2Université de Reims
Champagne-Ardenne, ANSES, EA4688 - USC“transmission vectorielle et épidémiosurveillance de maladies parasitaires (VECPAR)”, SFR Cap Santé, 51, rue Cognacq-Jay, 51096 Reims, France.3Department of Parasitology, Faculty of Sciences, Charles University in Prague, Vinicna 7, 128 44 Prague 2, Czech Republic.
4
MIVEGEC, UMR CNRS-IRD-Université de Montpellier Centre IRD, 911 Avenue Agropolis, BP 64501, Cedex 34394 Montpellier, France.5Laboratory of Molecular
Structure Characterization, Institute of Microbiology, The Czech Academy of Sciences, Videnska 1083, 142 20 Prague 4, Czech Republic.6Instituto de
Microbiología, Universidad San Francisco de Quito, Diego de Robles S/N, Quito, Ecuador.7Mabritec SA, Lörracherstrasse 50, 4125 Riehen, Switzerland.8Avia-GIS,
Risschotlei 33, 2980 Zoersel, Belgium.9Current address: NSF Center for Integrated Pest Management, 1730 Varsity Drive, Suite 110, Venture IV Building, Raleigh, North Carolina 27606, USA.
References
1. Schaffner F, Kaufmann C, Hegglin D, Mathis A. The invasive mosquitoAedes japonicusin central Europe. Med Vet Entomol. 2009;23:448–51.
2. Medlock JM, Hansford KM, Schaffner F, Versteirt V, Hendrickx G, Zeller H, et al. A review of the invasive mosquitoes in Europe: ecology, public health risks, and control options. Vector Borne Zoonotic Dis. 2012;12:435–47.
3. Schaffner F, Mathis A. Dengue and dengue vectors in the WHO European region: past, present, and scenarios for the future. Lancet Infect Dis. 2014;14:1271–80.
4. Jaenson TGT, Jaenson DGE, Eisen L, Petersson E, Lindgren E. Changes in the geographical distribution and abundance of the tickIxodes ricinusduring the past 30 years in Sweden. Parasit Vectors. 2012;5:8.
5. Dergousoff SJ, Galloway TD, Lindsay LR, Curry PS, Chilton NB. Range expansion ofDermacentor variabilisandDermacentor andersoni(Acari: Ixodidae) near their northern distributional limits. J Med Entomol. 2013;50:510–20.
6. Nolan DV, Dallas JF, Piertney SB, Mordue Luntz AJ. Incursion and range expansion in the bluetongue vectorCulicoides imicolain the Mediterranean basin: a phylogeographic analysis. Med Vet Entomol. 2008;22:340–51. 7. Maroli M, Feliciangeli MD, Bichaud L, Charrel RN, Gradoni L. Phlebotomine
sandflies and the spreading of leishmaniases and other diseases of public health concern. Med Vet Entomol. 2013;27:123–47.
8. Poeppl W, Obwaller AG, Weiler M, Burgmann H, Mooseder G, Lorentz S, et al. Emergence of sandflies (Phlebotominae) in Austria, a Central European country. Parasitol Res. 2013;112(12):4231–7.
9. Medlock JM, Hansford KM, van Bortel W, Zeller H, Alten B. A summary of the evidence for the change in European distribution of phlebotomine sand flies (Diptera: Psychodidae) of public health importance. J Vector Ecol. 2014;39:72–7. 10. Schaffner F, Bellini R, PetrićD, Scholte E-J, Zeller H, Marrama Rakotoarivony L.
Development of guidelines for the surveillance of invasive mosquitoes in Europe. Parasit Vectors. 2013;6:209.
11. European Centre for Disease Prevention and Control: Guidelines for the surveillance of native mosquitoes in Europe. Stockholm: ECDC Technical Report; 2014. doi:10.2900/37227
12. Depaquit J, Bounamous A, Akhoundi M, Augot D, Sauvage F, Dvorak V, et al. A taxonomic study ofPhlebotomus(Larroussius)perfiliewis. l. Infect Genet Evol. 2013;20:500–8.
13. Prudhomme J, Gunay F, Rahola N, Ouanaimi F, Guernaoui S, Boumezzough A, et al. Wing size and shape variation ofPhlebotomus papatasi(Diptera: Psychodidae) populations from the south and north slopes of the Atlas Mountains in Morocco. J Vector Ecol. 2012;37:137–47.
14. Ready PD. Biology of phlebotomine sand flies as vectors of disease agents. Ann Rev Entomol. 2013;58:227–50.
15. Dvorak V, Halada P, Hlavackova K, Dokianakis E, Antoniou M, Volf P. Identification of phlebotomine sand flies (Diptera: Psychodidae) by matrix-assisted laser desorption/ionization time of flight mass spectrometry. Parasit Vectors. 2014;7:21.
16. Depaquit J. Molecular systematics applied to Phlebotomine sandflies: Review and perspectives. Infect Genet Evol. 2014;28:744–56.
17. Depaquit J, Ferte H, Leger N, Lefranc F, Alves-Pires C, Hanafi H, et al. ITS 2 sequences heterogeneity inPhlebotomus sergentiandPhlebotomus similis
(Diptera, Psychodidae): possible consequences in their ability to transmit
Leishmania tropica. Int J Parasitol. 2002;32:1123–31.
18. Dvorak V, Votypka J, Aytekin A, Alten B, Volf P. Intraspecific variability of natural populations ofPhlebotomus sergenti, the main vector ofLeishmania tropica. J Vector Ecol. 2011;36:S49–57.
19. Croxatto A, Prod'hom G, Greub G. Applications of MALDI-TOF mass spectrometry in clinical diagnostic microbiology. FEMS Microbiol Rev. 2012;36:380–407. 20. Posteraro B, De Carolis E, Vella A, Sanguinetti M. MALDI-TOF mass spectrometry
in the clinical mycology laboratory: identification of fungi and beyond. Expert Rev Proteomic. 2013;10:151–64.
21. Mellmann A, Bimet F, Bizet C, Borovskaya AD, Drake RR, Eigner U, et al. High interlaboratory reproducibility of matrix-assisted laser desorption ionization-time of flight mass spectrometry-based species identification of nonfermenting bacteria. J Clin Microbiol. 2009;47:3732–4.
22. Campbell PM. Species differentiation of insects and other multicellular organisms using matrix-assisted laser desorption/ionization time of flight mass spectrometry protein profiling. Syst Entomol. 2005;30:186–90. 23. Feltens R, Gorner R, Kalkhof S, Groger-Arndt H, von Bergen M. Discrimination
of different species from the genusDrosophilaby intact protein profiling using matrix-assisted laser desorption ionization mass spectrometry. BMC Evol Biol. 2010;10:95.
24. Hoppenheit A, Murugaiyan J, Bauer B, Steuber S, Clausen PH, Roesler U. Identification of Tsetse (Glossinaspp.) using matrix-assisted laser desorption/ionisation time of flight mass spectrometry. PLoS Negl Trop Dis. 2013;7, e2305.
25. Karger A, Kampen H, Bettin B, Dautel H, Ziller M, Hoffmann B, et al. Species determination and characterization of developmental stages of ticks by whole-animal matrix-assisted laser desorption/ionization mass spectrometry. Ticks Tick Borne Dis. 2012;3:78–89.
26. Kaufmann C, Schaffner F, Ziegler D, Pfluger V, Mathis A. Identification of field-caughtCulicoidesbiting midges using matrix-assisted laser desorption/ ionization time of flight mass spectrometry. Parasitology. 2012;139:248–58. 27. Kaufmann C, Ziegler D, Schaffner F, Carpenter S, Pfluger V, Mathis A.
Evaluation of matrix-assisted laser desorption/ionization time of flight mass spectrometry for characterization ofCulicoides nubeculosusbiting midges. Med Vet Entomol. 2011;25:32–8.
28. Muller P, Pfluger V, Wittwer M, Ziegler D, Chandre F, Simard F, et al. Identification of crypticAnophelesmosquito species by molecular protein profiling. PLoS One. 2013;8, e57486.
29. Perera MR, Vargas RDF, Jones MGK. Identification of aphid species using protein profiling and matrix-assisted laser desorption/ionization time-of-flight mass spectrometry. Entomol Exp Appl. 2005;117:243–7.
30. Yssouf A, Flaudrops C, Drali R, Kernif T, Socolovschi C, Berenger JM, et al. Matrix-assisted laser desorption ionization-time of flight mass spectrometry for rapid identification of tick vectors. J Clin Microbiol. 2013;51:522–8.
31. Yssouf A, Socolovschi C, Flaudrops C, Ndiath MO, Sougoufara S, Dehecq JS, et al. Matrix-assisted laser desorption ionization–time of flight mass spectrometry: an emerging tool for the rapid identification of mosquito vectors. PLoS One. 2013;8:e72380.
32. Yssouf A, Socolovschi C, Leulmi H, Kernif T, Bitam I, Audoly G, et al. Identification of flea species using MALDI-TOF/MS. Comp Immunol Microbiol Infect Dis. 2014;37:153–7.
33. Yssouf A, Parola P, Lindstrom A, Lilja T, LAmbert G, Bondesson U, et al. Identification of European mosquito species by MALDI-TOF MS. Parasitol Res. 2014;113:2375–8.
34. Steinmann IC, Pfluger V, Schaffner F, Mathis A, Kaufmann C. Evaluation of matrix-assisted laser desorption/ionization time of flight mass spectrometry for the identification of ceratopogonid and culicid larvae. Parasitology. 2013;140:318–27.
35. Dieme C, Yssouf A, Vega-Rúa A, Berenger J-M, Failloux A-B, Raoult D, et al. Accurate identification of Culicidae at aquatic developmental stages by MALDI–TOF MS profiling. Parasit Vectors. 2014;7:544.
36. Schaffner F, Kaufmann C, Pfluger V, Mathis A. Rapid protein profiling facilitates surveillance of invasive mosquito species. Parasit Vectors. 2014;7:142.
37. Alkan C, Bichaud L, de Lamballerie X, Alten B, Gould EA, Charrel RN. Sandfly-borne phleboviruses of Eurasia and Africa: epidemiology, genetic diversity, geographic range, control measures. Antiviral Res.
2013;100:54–74.
38. Alvar J, Velez ID, Bern C, Herrero M, Desjeux P, Cano J, et al. WHO Leishmaniasis Control Team: Leishmaniasis worldwide and global estimates of its incidence. PLoS One. 2012;7, e35671.
39. Zapata S, Mejia L, Le Pont F, Leon R, Pesson B, Ravel C, et al. A study of a population ofNyssomyia trapidoi(Diptera: Psychodidae) caught on the Pacific coast of Ecuador. Parasit Vectors. 2012;5:144.
40. Dedet JP, Addadi K, Belazzoug S. Les phlébotomes (Diptera, Psychodidae) d'Algérie. Cah ORSTOM, Sér Ent Méd Parasitol. 1984;22:99–127. 41. Lewis D. A taxonomic review of the genusPhlebotomus. Bull Brit Mus Nat
Hist (Entomol). 1982;45:121–209.
42. Young DG, Duncan MA: Guide to the identification and geographic distribution ofLutzomyiasand flies in Mexico, the West Indies, Central and South America (Diptera: Psychodidae). Memoirs of the American Entomological Institute, vol. 54. Associated Publishers, Gainesville, Florida, USA; 1994, 881 pp. www.dtic.mil/dtic/tr/fulltext/u2/a285737.pdf 43. Marcondes CB. A proposal of generic and subgeneric abbreviations for
Phlebotomine sandflies (Diptera: Psychodidae: Phlebotominae) of the World. Entomol News. 2007;118:351–6.
45. Esseghir S, Ready PD, Killick-Kendrick R, Ben-Ismail R. Mitochondrial haplotypes and phylogeography ofPhlebotomusvectors ofLeishmania major. Insect Mol Biol. 1997;6:211–25.
46. Parvizi P, Ready PD. Molecular investigation of the population differentiation ofPhlebotomus papatasi, important vector ofLeishmania major, in different habitats and regions of Iran. Iranian Biomed J. 2006;10:69–77.
47. Folmer O, Black M, Hoeh W, Lutz R, Vrijenhoek R. DNA primers for amplification of mitochondrial cytochrome c oxidase subunit I from diverse metazoan invertebrates. Mol Mar Biol Biotech. 1994;3:294–9.
48. Aransay AM, Scoulica E, Tselentis Y, Ready PD. Phylogenetic relationships of phlebotomine sandflies inferred from small subunit nuclear ribosomal DNA. Insect Mol Biol. 2000;9:157–68.
49. Kaufmann C, Steinmann IC, Hegglin D, Schaffner F, Mathis A. Spatio-temporal occurrence ofCulicoidesbiting midges in the climatic regions of Switzerland, along with large scale species identification by MALDI-TOF mass spectrometry. Parasit Vectors. 2012;5:246.
50. Hoppenheit A, Murugaiyan J, Bauer B, Clausen P-H, Roesler U. Analysis ofGlossina palpalis gambiensisandGlossina tachinoidesfrom two distant locations in Burkina Faso using MALDI TOF MS. Parasitol Res. 2014;113:723–6.
51. Depaquit J, Muller F, Léger N.Phlebotomus (Euphlebotomus) barguesaen. sp. from Thailand (Diptera-Psychodidae). Parasit Vectors. 2009;2:5.
52. Alby K, Gilligan PH, Miller MB. Comparison of matrix-assisted laser desorption ionization-time of flight (maldi-tof) mass spectrometry platforms for the identification of gram-negative rods from patients with cystic fibrosis. J Clin Microbiol. 2013;51:3852–4.
53. Lohmann C, Sabou M, Moussaoui W, Prevost G, Delarbre J-M, Candolfi E, et al. Comparison between the Biflex III-Biotyper and the Axima-SARAMIS systems for yeast identification by matrix-assisted laser desorption ionization-time of flight mass spectrometry. J Clin Microbiol. 2013;51:1231–6.
Submit your next manuscript to BioMed Central and take full advantage of:
• Convenient online submission
• Thorough peer review
• No space constraints or color figure charges
• Immediate publication on acceptance
• Inclusion in PubMed, CAS, Scopus and Google Scholar
• Research which is freely available for redistribution