DTSim at SemEval-2016 Task 1: Semantic Similarity Model Including
Multi-Level Alignment and Vector-Based Compositional Semantics
Rajendra Banjade, Nabin Maharjan, Dipesh Gautam, Vasile Rus Department of Computer Science / Institute for Intelligent Systems
The University of Memphis Memphis, TN, USA
{rbanjade, nmharjan, dgautam, vrus}@memphis.edu
Abstract
In this paper we describe our system (DT-Sim) submitted at SemEval-2016 Task 1: Se-mantic Textual Similarity (STS Core). We developed Support Vector Regression model with various features including the similarity scores calculated using alignment based meth-ods and semantic composition based methmeth-ods. The correlations between our system output and the human ratings were above 0.8 in three datasets.
1 Introduction
The task of measuring the Semantic Textual Sim-ilarity (STS) is to quantify the degree of semantic similarity between the given pair of texts. For exam-ple, the similarity score of 0 means that the texts are not similar at all and 5 means that they have same meaning (Agirre et al., 2015; Banjade et al., 2015). In this paper, we describe our system DTSim and the submitted three different runs in this year’s SemEval shared task on Semantic Textual Similarity English track (STS Core; Agirre et al. (2016)). We applied Support Vector Regression (SVR) with various fea-tures in order to predict the similarity score for the given sentence pairs. The features of the model included semantic similarity scores calculated us-ing individual methods (described in Section 3) and other general features. The pipeline of components in DTSim is shown in Figure 1.
2 Preprocessing
Hyphens were replaced with whitespaces if they were not composite verbs (e.g. video-gamed). The
Figure 1:Pipeline of components in DTSim system.
composite verbs were detected based on the POS tag assigned by the POS tagger. Also, the words starting with co-, pre-, meta-, multi-, re-, pro-, al-, anti-, ex-, and non- were left intact. Then, the hyphen-removed texts were tokenized, lemmatized, POS-tagged and annotated with Named Entity tags using Stanford CoreNLP Toolkit (Manning et al., 2014). We also marked each word as whether it was a stop word. We also created chunks using our own Conditional Ran-dom Fields (CRF) based chunking tool (Maharjan et al., 2016) which outperforms OpenNLP chunker when evaluated with human annotated chunks pro-vided in interpretable similarity shared task in 2015. We normalized texts using mapping data. For exam-ple,pctand%were changed topercent.
3 Feature Extraction
We used various features in our regression models including semantic similarity scores generated using individual methods. Before describing those indi-vidual methods, we present word similarity methods which were used for sentence similarity calculation.
3.1 Word-to-Word Similarity
We used vector based word representation models, PPDB 2.0 database (Pavlick et al., 2015), and Word-Net (Miller, 1995) in order to measure the similarity
between words as given below.
sim(w1, w2, m) =
1, if w1 and w2 are synonyms 0, if w1 and w2 are antonyms ppdb(w1,w2), if m = ppdb
X1.X2
|X1||X2|, otherwise
Wherem ∈ {ppdb, LSAwiki, word2vec, GloV e} X1and X2are vector representations of wordsw1
andw2respectively.
We first checked synonyms and antonyms in WordNet 3.0. If the word pair was neither synonym nor antonym, we calculated the similarity score based on the model selected. The word repre-sentation models used are: word2vec (Mikolov et al., 2013)1, Glove (Pennington et al., 2014)2,
and LSA Wiki (Stefanescu et al., 2014a)3. The
cosine similarity was calculated between the word representation vectors. We also used the similarity score found in PPDB database4.
Handling missing words: We checked for the representation of word in raw form as well as in base (lemma) form. If neither of them was found, we used vector representation of one of its synonyms in WordNet for the given POS category. The same strategy was used while using PPDB to retrieve similarity score.
3.2 Sentence-to-Sentence Similarity 3.2.1 Word Alignment Based Method
In this approach, all the content words (in lemma form) in two sentences (S1 and S2) were aligned optimally (OA) using Hungarian algorithm (Kuhn,
1955) as described in (Rus and Lintean, 2012) and implemented in SEMILAR Toolkit (Rus et al., 2013). The process is same as finding the maximum weight matching in a weighted bipartite graph. The nodes are words and the weights are the similarity scores between the word pairs. The sentence simi-larity is calculated as:
sim(S1, S2) = 2∗
P
(w1,w2)∈OAsim(w1, w2) |S1|+|S2|
1https://code.google.com/archive/p/word2vec/ 2http://nlp.stanford.edu/projects/glove/ 3http://semanticsimilarity.org
4http://paraphrase.org/
In order to avoid the noisy alignments, we reset the similarity score below 0.5 (empirically set thresh-old) to 0.
3.2.2 Chunk Alignment Based Method
We chunked texts (see Section 2) and aligned chunks optimally as described in (S¸tef˘anescu et al., 2014b). The difference is that the chunks containing Named Entities were aligned using rules: (a) the chunks were treated as equivalent if both were named enti-ties and at least one of the content words was match-ing, (b) they were treated as equivalent if one was the acronym of another. In other cases, chunk-to-chunk similarity was calculated using optimal word alignment method. The process is same as word alignment based method. First, the words in chunks were aligned to calculate chunk-to-chunk similarity. Finally, chunks in two sentences were aligned opti-mally for sentence level similarity. In order to avoid noisy alignments, we set similarity score to 0 below 0.5 for word alignment and 0.6 for chunk alignment. These thresholds were set empirically.
3.2.3 Interpretable Feature Based Method
We aligned chunks from one sentence to another and assigned semantic relations and similarity scores for each alignment. The semantic labels were EQUI, OPPO, SIMI, REL, SPE1, SPE2, and NOALI. For example, the semantic relation EQUI was assigned if the given two chunks were equivalent. The similarity score range from 0 (no similarity) to 5 (equivalent). We aligned chunks and assigned labels as described in (Maharjan et al., 2016). Once the chunks were aligned and semantic relation types and similarity scores were assigned, sentence level scores were calculated for each relation type as well as an overall score was calculated using all alignment types as shown next.
N orm count(alignment−type)
= (# alignments with type = alignment-type) Total # alignments including NOALI
Similarity(S1, S2)
=
P
{EQU I, OP P O, SIM I, REL, SP E1, SP E2, N OALI}.
3.2.4 Vector Algebra Based Method
In this approach, we combined vector based word representations to obtain sentence level representa-tions through vector algebra as:
RV(S) =Pw∈W Vw
Where W is the set of content words in
sen-tence S and Vwis the vector representation for word w. The cosine similarity was calculated between
the resultant vectors - RV(S1) and RV(S2). Word representations from LSA Wiki, word2vec and GloVe models were used.
3.2.5 Similarity Matrix Based Method
The approach is similar to the word alignment based method and similarity scores for all pairs of words from given two sentences are calculated. However, a key difference is that all word-to-word similari-ties are taken into account, not just the maximally aligned word similarities as described in (Fernando and Stevenson, 2008).
3.3 Features
All or subset of the following features was used for three different runs as described in Section 4. We used word2vec representation and WordNet antonym and synonym for word similarity unless anything else is mentioned specifically.
1. Similarity scores generated using word align-ment based methods where word-to-word sim-ilarity was calculated using methods described in Section 3.1.
2. Similarity score using optimal alignment of chunks where word-to-word similarity scores were calculated using representation from word2vec model.
3. Similarity scores using similarity matrix based methods. The similarities between words were calculated using different word similarity methods discussed in Section 3.1.
4. Similarity scores using chunk alignment types and alignment scores (interpretable features).
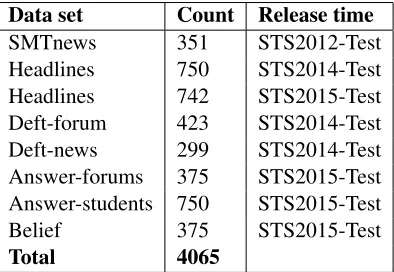
Data set Count Release time
SMTnews 351 STS2012-Test Headlines 750 STS2014-Test Headlines 742 STS2015-Test Deft-forum 423 STS2014-Test Deft-news 299 STS2014-Test Answer-forums 375 STS2015-Test Answer-students 750 STS2015-Test Belief 375 STS2015-Test
[image:3.612.328.525.60.196.2]Total 4065
Table 1:Summary of training data.
5. Similarity scores using the resultant vector based method using word representations from word2vec, GloVe, and LSA Wiki models.
6. Noun-Noun, Adjective-Adjective, Adverb-Adverb, and Verb-Verb similarity scores and similarity score for other types of words using word alignment based method.
7. Multiplication of noun-noun similarity scores and verb-verb similarity scores.
8. |Ci1−Ci2|
Ci1+Ci2 whereCi1 andCi2 are the counts of
i∈ {all tokens, adjectives, adverbs, nouns, and
verbs}for sentence 1 and 2 respectively.
9. Presence of adjectives and adverbs in first sen-tence, and in the second sentence.
10. Unigram overlap with synonym check, bigram overlap and BLEU score.
11. Number of EQUI, OPPO, REL, SIMI, and SPE relations in aligning chunks between texts rela-tive to the total number of alignments.
12. Presence of antonym pair among all word pairs between given two sentences.
4 Building Models
Models and Runs: Using the combination of fea-tures described in Section 3.3, we built three differ-ent Support Vector Regression (SVR) models corre-sponding to three runs (R1-3) submitted. In Run 1 (i.e. R1), all of the features except chunk alignment based features were used. The XL version of PPDB 2.0 was used. In Run 2, we selected the features us-ing Weka’s correlation based feature selection tool (Hall and Smith, 1998) which also included chunk alignment based similarity score. In Run 3, we took the representative features from all of the features described in Section 3.3. For example, alignment based similarity scores generated using word2vec model were selected as it performed relatively bet-ter in training set compared to GloVe and LSA Wiki models. Also, we used XXXL version of the PPDB 2.0 database (the precision maybe lower but the cov-erage is higher as compared to the smaller version of the database).
We used LibSVM library (Chang and Lin, 2011) in Weka 3.6.85to develop SVR models. We
evalu-ated our models in training data using 10-fold cross validation approach. The correlation scores in train-ing set were 0.791, 0.773 and 0.800 for R1, R2, and R3 respectively. The best results in training set was obtained using RBF kernel. All other parameters were set to Weka’s default.
5 Results
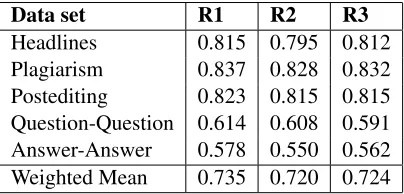
The test data contained 1186 sentence pairs as: Headlines (249), Plagiarism (230), Postedit-ing (244), Question-question (209), and Answer-Answer (254). The further details about the test data can be found in (Agirre et al., 2016).
Table 2 shows the correlation (Pearson) of our system outputs with human ratings. The correlation scores of all three runs are 0.8 or above for three datasets - Headlines, Plagiarism, and Postediting. However, the correlations are comparatively lower for Question-question and Answer-answer datasets. One of the reasons is that these two datasets are quite different from the texts we used for the training (we could not include them as such type of datasets were not available during model building). For example, the question pair (#24 in Question-question dataset):
How to select a workout plan? andHow to create a
5http://www.cs.waikato.ac.nz/ml/weka/
Data set R1 R2 R3
[image:4.612.325.527.60.157.2]Headlines 0.815 0.795 0.812 Plagiarism 0.837 0.828 0.832 Postediting 0.823 0.815 0.815 Question-Question 0.614 0.608 0.591 Answer-Answer 0.578 0.550 0.562 Weighted Mean 0.735 0.720 0.724
Table 2:Results of our submitted runs on test data.
workout plan?have high lexical overlap but they are asking very different things. Analyzing the focus of the questions may be needed in order to distinguish the questions, i.e. the similarity between such pairs may need to be modeled differently. With the release of this type of dataset will foster the development of similarity models where the text pair consists of questions. It should to be noted that we used a sin-gle set of training data in all models without tailoring our models to specific test data.
Another interesting observation is that the results of three different runs are similar to each other. The most predictive feature was the word alignment based similarity using word2vec model. The cor-relation in full training set was 0.725. It is not sur-prising considering that the alignment based systems were top performing systems in the past shared tasks as well (Han et al., 2013; Sultan et al., 2015; Agirre et al., 2015). Selecting smaller set of features that best predict the similarity scores should be consid-ered in the future which will reduce the complexity of the model and potential of overfitting.
6 Conclusion
References
Eneko Agirre, Carmen Baneab, Claire Cardiec, Daniel Cerd, Mona Diabe, Aitor Gonzalez-Agirrea, Wei-wei Guof, Inigo Lopez-Gazpioa, Montse Maritxalara, Rada Mihalceab, et al. 2015. Semeval-2015 task 2: Semantic textual similarity, english, spanish and pilot on interpretability. In Proceedings of the 9th inter-national workshop on semantic evaluation (SemEval 2015), pages 252–263.
Eneko Agirre, Carmen Baneab, Daniel Cer, Mona Diab, Aitor Gonzalez-Agirree, Rada Mihalceab, and Janyce Wiebe. 2016. Semeval-2016 task 1: Semantic textual similarity - monolingual and cross-lingual evaluation. InProceedings of the 10th international workshop on semantic evaluation (SemEval 2016).
Rajendra Banjade, Nobal B Niraula, Nabin Mahar-jan, Vasile Rus, Dan Stefanescu, Mihai Lintean, and Dipesh Gautam. 2015. Nerosim: A system for measuring and interpreting semantic textual similarity.
SemEval-2015, page 164.
Chih-Chung Chang and Chih-Jen Lin. 2011. Libsvm: a library for support vector machines. ACM Trans-actions on Intelligent Systems and Technology (TIST), 2(3):27.
Samuel Fernando and Mark Stevenson. 2008. A seman-tic similarity approach to paraphrase detection. In Pro-ceedings of the 11th Annual Research Colloquium of the UK Special Interest Group for Computational Lin-guistics, pages 45–52. Citeseer.
Mark A Hall and Lloyd A Smith. 1998. Practical feature subset selection for machine learning.
Lushan Han, Abhay Kashyap, Tim Finin, James May-field, and Jonathan Weese. 2013. Umbc ebiquity-core: Semantic textual similarity systems. In Proceed-ings of the Second Joint Conference on Lexical and Computational Semantics, volume 1, pages 44–52. Harold W Kuhn. 1955. The hungarian method for the
as-signment problem.Naval research logistics quarterly, 2(1-2):83–97.
Nabin Maharjan, Rajendra Banjade, Nobal Niraula, and Vasile Rus. 2016. Semaligner: A tool for aligning chunks with semantic relation types and semantic sim-ilarity scores. InLREC.
Christopher D Manning, Mihai Surdeanu, John Bauer, Jenny Rose Finkel, Steven Bethard, and David Mc-Closky. 2014. The stanford corenlp natural language processing toolkit. InACL (System Demonstrations), pages 55–60.
Tomas Mikolov, Ilya Sutskever, Kai Chen, Greg S Cor-rado, and Jeff Dean. 2013. Distributed representa-tions of words and phrases and their compositionality. InAdvances in neural information processing systems, pages 3111–3119.
George A Miller. 1995. Wordnet: a lexical database for english. Communications of the ACM, 38(11):39–41. Ellie Pavlick, Johan Bos, Malvina Nissim, Charley
Beller, Ben Van Durme, and Chris Callison-Burch. 2015. Ppdb 2.0: Better paraphrase ranking, fine-grained entailment relations, word embeddings, and style classification. InProc. ACL.
Jeffrey Pennington, Richard Socher, and Christopher D Manning. 2014. Glove: Global vectors for word representation. Proceedings of the Empiricial Meth-ods in Natural Language Processing (EMNLP 2014), 12:1532–1543.
Vasile Rus and Mihai Lintean. 2012. A comparison of greedy and optimal assessment of natural language student input using word-to-word similarity metrics. InProceedings of the Seventh Workshop on Building Educational Applications Using NLP, pages 157–162. Association for Computational Linguistics.
Vasile Rus, Mihai C Lintean, Rajendra Banjade, Nobal B Niraula, and Dan Stefanescu. 2013. Semilar: The se-mantic similarity toolkit. InACL (Conference System Demonstrations), pages 163–168. Citeseer.
Dan Stefanescu, Rajendra Banjade, and Vasile Rus. 2014a. Latent semantic analysis models on wikipedia and tasa.
Dan S¸tef˘anescu, Rajendra Banjade, and Vasile Rus. 2014b. A sentence similarity method based on chunk-ing and information content. In Computational Lin-guistics and Intelligent Text Processing, pages 442– 453. Springer.