Implementation and Analysis of Advanced
Clustering Algorithms
Prajakta Dhamanskar1, Dharmit Dalvi2, Nupura Hajare3, Rochana Cordeiro4
1, 2, 3, 4 Information Technology Department, Fr Conceicao Rodrigues College of Engineering Mumbai (India)
Abstract: Clustering is data mining technique of grouping objects or data into clusters in which objects within the cluster have high similarity, but are very dissimilar to objects in the other clusters. Similarities and dissimilarities are measured on the attribute values which describe the objects. Clustering methods are used to formulate and typecast the data, for data compression and model construction, for detection of outliers etc. Common approach of all clustering methods is to find clusters centre which represent each cluster. Data set can be numeric or categorical. Numeric data can be oppressed to naturally define distance function between data points, whereas categorical data can be borrowed from either quantitative or qualitative data where observations are directly observed from counts. The work done here revolves around the implementation of selected latest clustering algorithms, a study of various pros and cons of the same, and also a comparative analysis of these clustering techniques.
Keywords: Clustering, outlier, clustering algorithm-Kmode, BIRCH, CURE, ROCK
I. INTRODUCTION
As per the work stated in [1], clustering is the grouping of a particular set of objects based on their characteristics, aggregating them according to their similarities. Regarding to data mining, this methodology partitions the data implementing a specific join algorithm, most suitable for the desired information analysis. Since clustering is a very valuable data analysis technique, it has several different applications in the sciences world. Every large data set of information can be processed by this kind of analysis, producing great results with many distinct types of data. [10]. The personal data combined with shopping, location, interest, actions, and an infinite number of indicators, can be analyzed with this methodology, providing very important information and trends. Examples of this are the market research, marketing strategies, web analytics, and a lot of others. Following are the four advanced clustering algorithms, that have been selected for implementation in the project:
K-modes, Rock, BIRCH and CURE
II. LITERATURESURVEY
This paper presents comparison between various clustering algorithms by considering the parameters such as time, input format ,data type expected as input and outlier detection.
A. Partitioning Based Clustering
All objects are considered initially as a single cluster. The objects are divided into no of partitions by iteratively locating the points between the partitions.[5]
1) K-modes algorithm: Randomly select k unique objects as the initial cluster centres (modes). In this current implementation of K-modes algorithm there are two initial mode selection methods
2) The first method selects k-distinct records from the dataset as initial k-modes.In second method we,calculate the frequencies of all categories for all attributes and store them in category array in descending order of frequency.where Cij denotes category i of attribute j, where f(Ci,j) is frequency of category Ci,j.
3) Assume k=3,assign most frequent categories equal to the initial k-modes.Example Q1=[q1,1=c1,1, q1,2=c1,2 q1,3=c1,3 q1,4=c1,4], Q2=[q2,1=c2,1, q2,2=c2,2, q2,3=c2,3, q2,4=c2,4], Q3=[q3,1=c3,1, q3,3=c3,3, q3,4=c3,4
4) Start with Q1.Select the record most similar to Q1 and substitute Q1 with record as first initial mode.Continue this process until Q3 is substituted
B. Hierarchical Clustering
average. The process is continuous until a desired cluster is formed. The Divisive approach deals with set of objects as single cluster and divides the cluster into further clusters until desired no of clusters are formed.[5]
1) Birch: It is a hierarchical clustering algorithm which uses a CF tree structure to form clusters.[11] Following are the various phases in BIRCH:
a) Phase 1: Load data into memory by building a CF tree
b) Phase 2 (optional): Condense into desirable range by building smaller CF trees
c) Phase 3: Global Clustering
d) Phase 4 (optional): Cluster Refining[11]
2) Rock : It is a hierarchical clustering algorithm which uses a link strategy to form clusters.[11]ROCK method is divided into three parts are as follows:
a) First get a random sample of the data.
b) Obtain the goodness measure by performing link agglomerative approach on data to get the point which can be merged at each step
c) Assign the remaining data on disk by using these points which forms the clusters
d) Cure: CURE uses a set of representative points to cluster the data. The steps for CURE algorithm are:
i) Draw random sample
ii) Partition sample
iii) Partially cluster partitions
iv) Eliminate outliers
v) Cluster partial clusters
vi) Label data in disk. [12]
III.SYSTEMIMPLEMENTATION
A. Technologies Used
Python programming language for coding and flask technology is used for designing the Graphical User Interface (GUI). Python provides various libraries such as matplotlib, pyclustering, etc, that can be effectively used for designing and visualizing clusters. Flask is a web application framework written in Python. It is developed by Armin Ronacher, who leads an international group of Python enthusiasts named Pocco. Flask is based on the Werkzeug WSGI toolkit and Jinja2 template engine. The pages for the project are designed using HTML and CSS technologies.
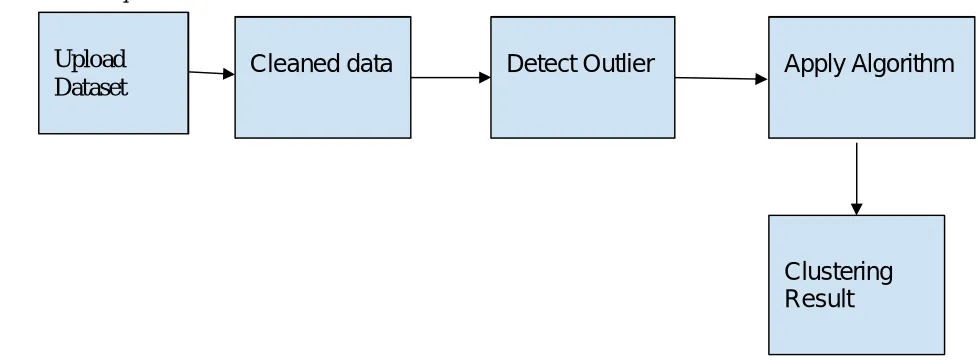
[image:2.612.52.541.473.655.2]B. Module Description
Fig. 1 Block diagram illustrating the flow of the system.
1) Data Cleaning: The datasets are cleaned, that is, the missing attributes are filled by finding the mean of the rest of the values in the particular column of the dataset. This is done only in case of numeric values, for categorical values, they are represented by a question mark.
.
Cleaned data
Detect Outlier
Apply Algorithm
Clustering
Result
2) Outlier Detection: The outliers in data mining can be detected using semi-supervised and unsupervised methods.Using outlier detection techniques, the distance based methods are used to detect outliers and label all the points as good outliers. The distance based method is one of the methods in anomaly detection. Anomalies: the set of objects are considerably dissimilar from the remainder of the data. They occur relatively infrequently. When they do occur, their consequences can be quite dramatic and quite often in a negative sense. Anomaly is a pattern in the data that does not conform to the expected behavior.
3) Applying Algorithms: Once dataset is cleaned, it is fed as input to each of the four clustering algorithms, Kmodes, ROCK, BIRCH and CURE.
4) Clustering Result: Results are then obtained for all the four clustering algorithms at once, displaying how the data from the dataset fed as input is grouped into clusters.
C. Implementation
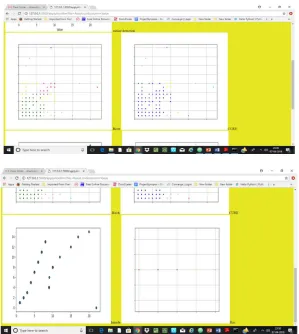
[image:3.612.172.440.234.362.2]1) First page:The first page provides a link to proceed with the uploading of the dataset file.
Fig. 2 First page of the system
[image:3.612.172.440.435.571.2]2) Dataset Selection Page: In this page, the user can choose any file containing datasets as input, and also a column on which clustering has to be performed. Further, a sample of data from that column is displayed, so that the user can find out whether the data is integer or string. Also, the data is cleaned simultaneously, and the dataset is now ready to be fed as input to each of the algorithms.
Fig. 3 Page to upload dataset.
Fig. 3,4,5 Page displaying all the four clustering outputs as well as box-plot representation of the data in the dataset.
The user can now view all the four clustering algorithms’ outputs, along with a box-plot representation of the data in the dataset, and can visually analyse and compare each of them.
IV.RESULTS
Following are the clustering outputs of each of the four algorithms
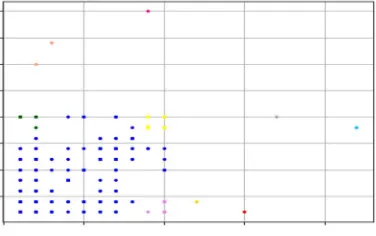
A. Birch
[image:4.612.157.456.73.407.2]BIRCH detects outliers, they can be seen evidently from fig. 6. The points scattered on the graph are of various colors, and the points with same colors represent the same cluster.
B. Rock
[image:5.612.213.403.145.285.2]ROCK algorithm clusters points using links, so in the output, only links are displayed. The points that are visible in the graph represent the links formed between the points, each link represents a cluster.
fig. 7 clustering output of rock.
C. Cure
[image:5.612.215.403.375.493.2]Similar to BIRCH, CURE output (fig. 8) also contains various points that are colored, and points with the same color belong to the same cluster.CURE also detects outliers.
Fig. 8 Clustering output of CURE.
D. Kmodes
Kmodes displays tiny circular blobs, each of these blobs represent a cluster. Kmodes does not detect outliers.
[image:5.612.199.409.576.712.2]V. RESULTANALYSIS
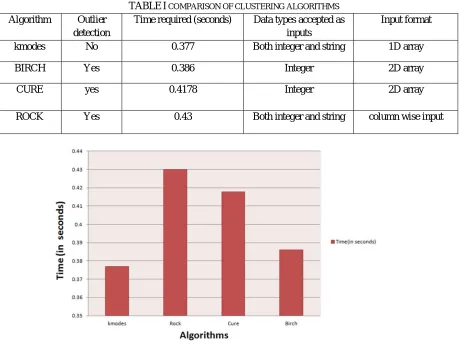
Following is the table that summarizes the observations obtained and inferences made about each of the four clustering algorithms, from the implementation of the system.
TABLEI COMPARISON OF CLUSTERING ALGORITHMS
Algorithm Outlier detection
Time required (seconds) Data types accepted as inputs
Input format
kmodes No 0.377 Both integer and string 1D array
BIRCH Yes 0.386 Integer 2D array
CURE yes 0.4178 Integer 2D array
ROCK Yes 0.43 Both integer and string column wise input
Fig. 10 Graphical representation of time required to for each algorithm to cluster data.
VI.CONCLUSIONS
Each clustering method has pros and cons over and is suitable in appropriate domain. The best approach is used for achieving best results. Comparative analysis table helps you to choose the most suited clustering method for a particular dataset depending on the type of output needed. Various important management decisions are taken based on the output given by these clustering methods. The work done here compares different clustering algorithms for datasets.
The inferences for the study on these clustering algorithms made are as follows
A. Kmodes is a partitioning based clustering algorithm, which takes both integers as well as string values as inputs. The input needs to be provided in the form of a 1D array. It is also a fast algorithm, takes very less time to cluster data. However, Kmodes algorithm does not detect outliers.
B. BIRCH is also a fast clustering algorithm, it takes less time for cluster formation, but more than Kmodes. BIRCH, however, takes only integer inputs, and not categorical. Also, input needs to be provided in the form of a 2D array. BIRCH is a hierarchical clustering algorithm. BIRCH detects outliers
C. CURE is another hierarchical clustering algorithm, with properties similar to BIRCH, except that CURE takes more time, but it also provides a more precise output than BIRCH.
[image:6.612.72.533.129.473.2]VII. FUTURESCOPE
The system designed and built can be used in the future to cluster various kinds of data, as it is a generic system, which can be executed on any dataset given as input. It can be further used to perform any research on a particular dataset, or on any of these four algorithms.
REFERENCES
[1] International Journal Of Engineering And Computer Science ISSN: 2319-7242 Volume 5 Issue 11 Nov. 2016, Page No. 19054-19062
[2] Volume 5, Issue 4, 2015 ISSN: 2277 128X International Journal of Advanced Research in Computer Science and Software Engineering Research Paper Available online at: www.ijarcsse.com Data Mining Clustering Methods: A Review Kavita Nagar Student of Master of Technology, Department of Computer science and Engineering Utter Pradesh Technical University, Gr. Noida, U.P., India
[3] International Journal of Computer Applications (0975 – 8887) Volume 128 – No.1, October 2015 1 A Survey of Data Mining Clustering Algorithms Mihika Shah Dwarkadas J. Sanghvi College of Engineering 400056 Maharashtra, India Sindhu Nair Dwarkadas J. Sanghvi College of Engineering Mumbai-400056 Maharashtra, India
[4] ndian Journal of Science and Technology, Vol 9(3), DOI: 10.17485/ijst/2016/v9i3/75971, January 2016 ISSN (Print) : 0974-6846 ISSN (Online) : 0974-5645 * Author for correspondence T. Sajana, C. M. Sheela Rani and K. V. Narayana KL University, Vaddeswaram – 522502, Guntur Dist., Andhra Pradesh, India; [email protected], [email protected], [email protected]
[5] A Comparative Analysis of Various Clustering Techniques used for Very Large Datasets Preeti Baser, Assistant Professor, SJPIBMCA, Gandhinagar, Gujarat, India – 382 007 Research Scholar, R. K. University, Rajkot [Email ID: [email protected]](2015)
[6] A fast Clustering Algorithm to Cluster Very Large Categorical Data Sets in Data Mining (2015) Zhexue Huang Cooperative Research Centre for Advanced Computational Systems CSIPRO Mathematical and Information Sciences GPO Box 664, Canberra 2601, AUSTRALIA
[7] Journal of Modern Applied Statistical Methods Volume 15 | Issue 1 Article 39 5-1-2016 Model-Based Outlier Detection System with Statistical Preprocessing D. Asir Antony Gnana Singh Anna University, Tiruchirappalli, India, [email protected] E. Jebalamar Leavline Anna University, Tiruchirappalli, India, [8] [email protected] Outline Outliers: Adding a Business Sense Alex Glushkovsky, BMO Financial Group
[9] International Journal Of Engineering And Computer Science ISSN: 2319-7242 Volume 5 Issue 1 January 2016, Page No. 15453-15456 Mr. Mukesh K. Deshmukh 1 , IJECS Volume 05 Issue 1 January 2016 Page No.15453-15456 Page 15453 A Survey On Outlier Detection Technique In Streaming Data Using Data Clustering Approach Mr. Mukesh K. Deshmukh 1 , Prof. A. S. Kapse 2 *1 M.E Scholar, Department of CSE, P. R. Patil College of Engg. & Technology, S.G.B. Amravati University, Amravati ( Maharashtra ) – India . E-mail : [email protected] & 2 Department of CSE , P. R. Patil College of Engg. & Technology, S.G.B. Amravati University, Amravati ( Maharashtra ) – India. E-mail :
[10] [email protected]
[11] https://www.slideshare.net/EdurekaIN/applications-of-clustering-in-real-lifeBIRCH: An Efficient Data Clustering Method for Very Large Databases Tian Zhang Raghu Ramakrishnan Miron Livny” (“lornputer Sciences Dept. Computer Sciences Dept. Computer Sciences Dept. [Jniv. of Wisconsin-Maciison [Jniv. of Wisconsin-Maciison LJniv. of Wisconsin-Maclison zhang@cs. wise.edu raghuf~cs.wise.edu mironf~cs. wise.eclu (2016)