Georgia State University
Georgia State University
ScholarWorks @ Georgia State University
ScholarWorks @ Georgia State University
EBCS Proceedings
Evidence-Based Cybersecurity Research Group
2018
Predicting Opioid Epidemic by Using Twitter Data
Predicting Opioid Epidemic by Using Twitter Data
Yubao Wu
Georgia State University
Pavel Skums
Georgia State University and Centers for Disease Control and Prevention
Alex Zelikovsky
Georgia State University
David Campo Rendon
Georgia State University and Centers for Disease Control and Prevention
Xueting Liao
Georgia State University
Follow this and additional works at: https://scholarworks.gsu.edu/ebcs_proceedings Part of the Computer Sciences Commons
Recommended Citation
Recommended Citation
Wu, Yubao, Pavel Skums, Alex Zelikovsky, David Campo Rendon, Xueting Liao. 2018. Predicting Opioid Epidemic by Using Twitter Data. In Bioinformatics Research and Applications, ISBRA 2018, eds. Fa Zhang, Zhipeng Cai, Pavel Skums, and Shihua Zhang. New York: Springer.
This Conference Proceeding is brought to you for free and open access by the Evidence-Based Cybersecurity Research Group at ScholarWorks @ Georgia State University. It has been accepted for inclusion in EBCS Proceedings by an authorized administrator of ScholarWorks @ Georgia State University. For more information, please contact [email protected].
Predicting Opioid Epidemic by Using Twitter Data
Yubao Wu1,3, Pavel Skums1,2,3, Alex Zelikovsky1,3, David Campo Rendon2,3, andXueting Liao1,3
1
Department of Computer Science, Georgia State University, Atlanta, GA, USA
2
Centers for Disease Control and Prevention, Atlanta, GA, USA
3
email: [email protected], [email protected], [email protected], [email protected], [email protected]
Abstract. Opioid crisis was declared as a public health emergency in 2017 by the President of USA. According to the Centers for Disease Control and Prevention, more than 91 Americans die every day from an opioid overdose. Nearly $4B is provided to address the opioid epidemic in the 2018 spending bill and help fulfill the President’s Opioid Initiative.
How to monitor and predict the opioid epidemic accurately and in real time? The traditional methods mainly use the hospital data and usually have a lag of several years. Even though they are accurate, the long lag period prevents us from mon-itoring and predicting the epidemic in real time. We observe that people discuss things related to the epidemic a lot in social media platforms. These user behavior data collected from social media platforms can potentially help us monitor and predict the epidemic in real time.
In this paper, we study how to use Twitter to monitor the epidemic. We collect the historic tweets containing the set of keywords related to the epidemic. We count the frequency of the tweets posted at each month and each state. We compare the frequency values with the real-world death rates at each month and each state. We identify high correlation between tweet frequency values and real-world death rates. The statistical significance demonstrates that the Twitter data can be used for predicting the death rate and epidemic in future.
Introduction
According to the Centers for Disease Control and Prevention, more than 91 Americans die every day from an opioid overdose. Opioid crisis is killing more people than car crashes and it is the deadliest drug crisis in American history. President Trump has de-clared the opioid crisis a public health emergency in October 2017. The 2018 spending bill provides nearly $4B to address the opioid epidemic and help fulfill the President’s Opioid Initiative.
How to predict and monitor the epidemic accurately and in real time? This is a fun-damental question that needs to be addressed urgently. The traditional methods mainly use the real-world death data collected from hospitals and usually have a lag of several years. We observe that people discuss things related to the epidemic and drugs a lot in social media platforms. “No family should EVER have to go through this. My cousin dies from a drug overdose” and “Apparently I am very into heroin and I overdose every night” are two real tweets about drug overdose. If we can infer the drug usage behaviors
Fig. 1: Software architecture
of users from the posted texts by using artificial intelligence, we potentially can monitor and predict the epidemic in real time.
In this project, we study how to use Twitter to monitor the opioid epidemic. We design and implement a novel distributed software system. The system collects the historic tweets and curates them in a distributed database. It then performs further data analysis to monitor and predict the epidemic. We have collected millions of historic tweets and compare them with the real-world death rates. We find that the frequency values of tweets significantly correlate with the real-world death rates. This demonstrates that social media data can be used to monitor and predict the epidemic in real time. Modern web scraping and data streaming techniques are used to collect the data from Twitter. Big data programming tools such as Spark and HBase are used to preprocess and curate the data. We also design distributed computing algorithms to perform the analysis on the large amount of tweets. The overall contributions are summarized as follows.
– We empirically prove that Twitter data can generally be used for monitoring and predicting the opioid epidemic.
– We design and implement a software system which can collect the historic tweets, perform analysis, and monitor and predict the epidemic.
The proposed software system is designed to monitor and predict the opioid epidemic. But it can also be used for other types of epidemics such as HIV, HCV, flu, and alco-holism.
Software Architecture
In order to process large amount of tweet data, we implement the software by using Apache Spark. Therefore, the software system can be deployed in a computer cluster. Figure 1 shows the software architecture of the system. From Figure 1, we can see that there are two stages. In the first stage, the system collects and pre-processes tweets from Twitter platform. The collected data is stored in HBase, a distributed database system. In the second stage, the system analyzes the tweets and predict the epidemic. In
both stages, multiple computer nodes run in parallel thus the system can process large amount of data efficiently.
All programs are written in Python. HBase Thrift APIs are used to access the database. Selenium is used to automate the Google Chrome web browser and crawl tweets from Twitter advanced search websites.
Query Conditions
We aim at crawling the historic tweets posted in USA related to opioid epidemic. To achieve this goal, we specify three concrete conditions.
– 30 keywords: opioid, alprazolam, amphetamine, antidepressant, benzodiazepine, buprenorphine, cocaine, diazepam, fentanyl, heroin, hydrocodone, meth, methadone, morphine, naloxone, narcan, opana, opiate, overdose, oxycodone, oxymorphone, percocet, suboxone, subutex, pill, rehab, sober, withdrawal, shooting up, track marks
– 144 cities in USA with large populations and minimum two cities in each state; the diameter is set to 45 miles
– 145 months: from March 21, 2006, to March 26, 2018
The set of 30 keywords are chosen by domain experts and are shown empirically to be associated with opioid epidemic. The selected 144 cities are chosen based on the population size. Minimum two cities are chosen in each state. The dates are from the date of first tweet to a recent date. There are 145 months in total. The algorithm thus submits one query for each city and each month. Since infinite scrolling is used in the Twitter advanced search website, the algorithm scrolls down the website in order to collect all tweets.
Results and Discussion
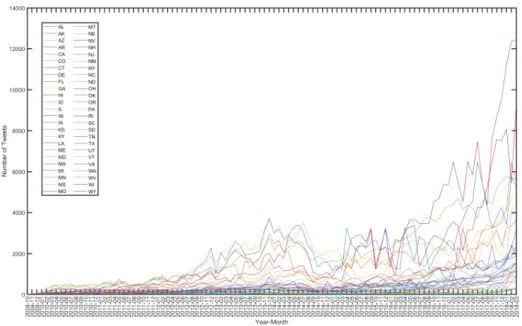
The system crawls1,896,961tweets in total. We design the distributed algorithm and count the number of tweets posted in each month and in each state. Figure 2 shows the frequency values. The x-axis represents the month from October 2009 to March 2018. There are no tweets satisfying the query conditions from March 2006 to September 2009 in any cities. Therefore, the x-axis starts from October 2009. The y-axis represents the number of tweets published in one month and in one state. Each line in the figure represents the number of tweets posted in one state. There are 50 states in total. From Figure 2, we can see that the number of tweets are generally increasing in the past 10 years. We also observe a peak from Dec 2012 to August 2014. In 2015, press reports that there was an outbreak of HIV caused by the use of Opana as an injectable recreational drug [1]. This event correlates with the peak in that period.
We also downloaded the national overdose death rate data. We aggregate the data into year and state level. Similarly, we also aggregate the tweet frequency values into year and state level. Then we compare the two sets of data by calculating the Pearson cor-relation. The overall correlation coefficient value is 0.83. This demonstrates that the overdose death rates correlate with the frequency values of tweets. Therefore, we can use the frequency of tweets to monitor and predict the death rates and the epidemic in real time.
Fig. 2: Frequency values of tweets
Conclusion
Opioid overdose crisis is an urgent societal issue to be solved. In this paper, we explore the possibility of monitoring and predicting the epidemic by using Twitter, a social media platform. We design the distributed software system and crawl millions of tweets containing the keywords about the epidemic. We observe meaningful patterns from the crawled tweets. We compare the tweet data with real-world overdose deaths and find that they highly correlate with each other. This demonstrates that the tweets can be used to predict the epidemic in real time.
Acknowledgements
AZ was partially supported by NSF Grant CCF-1619110.
References
1. Peters, P.J., Pontones, P., Hoover, K.W., Patel, M.R., Galang, R.R., Shields, J., Blosser, S.J., Spiller, M.W., Combs, B., Switzer, W.M.,et al.: HIV infection linked to injection use of oxymorphone in Indiana, 2014–2015. New England Journal of Medicine375(3), 229–239 (2016)