Abstract— in this paper, the effects of muscle active force and fiber orientation of the heart cells on the left ventricle ejection volume, wall thickening and stress distributions have been studied by finite element method (FEM). Three-dimensional left ventricle (LV) geometrical model was reconstructed from 65 transverse MRI tagging of a healthy human heart at the end of the diastole. Different muscle/fiber orientations were studied whereas muscle-active forces were directed along muscle fibers. Simulation results were very sensitive to the fiber orientation angles and the magnitude of the active force generated by LV-muscles during the isometric contraction and ejection phases. It was found that large magnitudes of active force almost lead to early start of contraction and delayed relaxation over one heart period. Mechanical response of the LV not only relies on the passive material resistance of the tissues but it mainly relies on the magnitude and direction of the muscle active force.
Index Terms— Heart mechanics, LV-contraction, active force, fiber orientation, FE-simulation
I. INTRODUCTION
ODELING realistic multi-dimensional mechanics of the heart is a very elusive and complicated problem. Nevertheless, left and/or right ventricular motions can be simulated by the finite element approach that is considered the most appropriate and dominant analysis technique because it is well established. From FE-analysis we can obtain a huge data about cardiac motion, especially stress and strain of the heart that are two of the most important determinants of many cardiac physiological and pathophysiological functions. These functions include: the pumping performance of the ventricle; the oxygen demand of the myocardium; the distribution of coronary blood flow; the vulnerability of the regions to ischemia and infarction; the stimuli to growth and remodeling during development and disease; and the risk of arrhythmia [1-4].
The stress and strain in the heart wall is not only governed by the heart passive material properties but also depend
Manuscript received March 01, 2011; revised March 22, 2011. This work was financially supported by the bio simulation national project of the Japanese Government, Japan.
M. A. Hassan is with the Engineering Design and Manufacturing Department, Faculty of Engineering, Center for Advanced Machining and Materials processing, University of Malaya, Kuala Lumpur, Malaysia, Leading project researcher, Kyoto University, Japan and Assiut University, Egypt (corresponding author mobile:+60176655047 phone: 603-555-5555; fax: 603-555-5555; e-mail: mohsenegypt@ um.edu.my).
Ahmed A. D. Sarhan S. is with the Engineering Design and Manufacturing Department, Faculty of Engineering, University of Malaya, Kuala Lumpur, Malaysia (e-mail: [email protected]).
A. Amano is with the Department of system science, Graduate School of Informatics, Kyoto University, Japan (e-mail: [email protected]).
mainly on the magnitude and directions of active forces generated by the muscle cells. This is in fact the central and serious problem in modeling cardiac mechanics, by the vibrational [5] or Galerkin [6] methods.
This paper, studied the effect of muscle-active force and fiber orientation on the left ventricle mechanics of a human heart. The implementation of muscle active force and fiber orientation in the finite element formulation and simulation were presented and explained. Three dimensional left vertical model of a healthy human heart was constructed from our measured MRI data whereas passive mechanical properties of tissues were taken from previous in vitro measurements [8]. Finally simulation results on ejection volume, thickness distributions and wall thickening of the left ventricle were discussed.
II. FINITE ELEMENT DESCRIPTION OF LV MECHANICS
A. Finite element equation
The dynamics of the finite element equation of heart mechanics was derived by using the variational formulation [9-10] and expressed as;
u
u
F
K
dt
du
o
(1)
e S e V
a T p T a p e e
dV
f
N
dS
f
N
F
F
F
aF
is the active force generated by the myocardium muscles whereasF
p is the force generated by the blood pressure in the left ventricular cavity.D
is the element elasticity matrix that contains the mechanical properties and relates nodal stresses with nodal strains.B
is the elemental strain displacement matrix that relates nodal strain to nodal displacement andN
is the element shape function.The variational formulation permits us to treat complicated natural boundary conditions such as blood pressure and active force which are implicitly imposed in each element in the variational statement as seen in the left hand side Eq. (1) that contains two terms for F. Therefore, we need only to explicitly impose the geometric boundary conditions in the finite element equation [9].
B. Geometric and initial boundary conditions
Effect of Muscle Active Force and Fiber
Orientation on the Left Ventricle Mechanics of
the Human Heart
Hassan
M A,Ahmed A. D
.
Sarhan
,Amano
AIn case of the heart left ventricle FE-simulation, the number of the degrees of freedom to be specified for geometric boundary conditions is dictated by the physics of the heart and is not precisely known till now. This is because of the current lack in the MRI tagging resolution and image artifact due to body and chest movements [7]. Heart geometrical model obtained from MRI data, was discretized and established in the XYZ coordinate. Four nodes at the equatorial section were made to move only in one degrees of freedom, namely two nodes on Y-axis move only in y direction while the others two nodes on Z-axis were constrained to move in Z-direction only as shown in schematically Fig 1(a). The heart apex was constrained to move axially on x-axis as shown in Fig. 1(b). These prescribed points are sufficient to prevent rigid body rotation and translation of the LV and keep equilibrium with stable simulation process. For initial conditions, most ventricular mechanics models have approximated the reference state as stress-free state using the unloaded, but residually stressed configuration. To obtain more accurate deformation and stresses in the beating heart we have to account for the residual (initial) stress in the FE model. The heart model should be solved for initial zero loads with the pre-measured residual [11-14] strains as initial boundary conditions and consequently the initial stress tensor which represents the residual stresses (initial stress state) could be obtained. In our simulation, after we got the initial stress tensor of the LV, we wrote a user subroutine called UINSTR and was implemented in MARC to modify the stress tensor at each deformation step during contraction and relaxation phases.
III. MODEL GENERATION AND SOLUTION TECHNIQUE
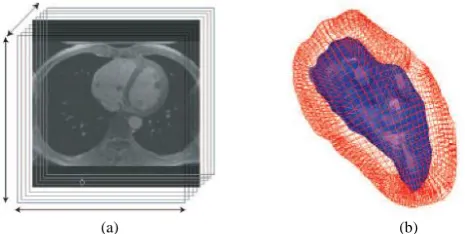
The 3D left ventricle geometrical model used in the present simulation was reconstructed from 65 transverse MRI tagging of a health human heart at the end of the diastole. The in plane resolution of MRI shown in Fig. 2(a) was 1mmx1mm for each pixel, while the transverse slice interval was 2mm. The model was adopted to align the long axis of LV with X-axis in the reference coordinates shown in Figs. 1. The model has 7638 nodes and 5612 eight-nodded elements distributed in three layers in the wall thickness as shown in Fig. 1(b). Passive resistance of the muscle –tissues was calculated assuming passive elastic mechanical properties with elastic modulus E = 2.5 N/mm2 and Poisson ratio =0.49.
To study of effect of muscle ordination it is necessary to determine a spatial fiber orientation at each element. To achieve this goal, a computer code program was developed
and a well defined representative fiber orientation could be determined for any arbitrary mesh. The algorithm
determines the fiber orientation at the central point of each element. The fiber orientation model was generated for alpha helix α =00, 300, 450, 600 and 900 using a simple orientation model and the Huyghe model [15]. The fibers were assumed to be parallel to the endocardial and pericardial surfaces and active stresses are directed along fibers. The geometric boundary conditions were taken as discussed in section four and shown in Fig.1.
LV-blood pressure or inner face pressure and pericardial sac pressure (outer pressure) were considered zero in this analysis. The active force versus time was taken from the electromechanical model of one cell known as Kyoto cell model [16]. Active contraction force per mm3 generated by this model was multiples by the volume of each element in the mesh and divided by 8 to calculate the nodal force at each element. In other words, the incremental nodal forces or loads at each simulation time step were calculated by a subroutine converting the cell force to elemental force acting at the center of each element and its components were distributed at the 8-nodes of each element. The heart cycle, was incremented into 3300 steps to give time step of 0.12ms. MARC open source code was used for modeling and simulation, while the calculation was run on OS Red Hat Linux 8, CPU Pentium4 (3GHz) and 1GByte memory machine.
IV. RESULTS AND DISSUASIONS
A. Effect of muscle active force on ejection volume
The deformation behavior of left ventricle was studied with different active muscle force. This was done by assuming proportional factor k which magnifies or demagnefies the cell contraction force estimated by Kyoto model. The equilibrium between internal stresses and active contraction force was calculated assuming linear elastic mechanical properties of the heart. The proportional factor k was changed to take the values 1.0x10⁻³, 2.0x10⁻³ and 5.0x10⁻⁴ respectively. When k is small the deformation quantity of the left cardiac ventricle is small, while deformation increases with increasing k value as shown in Fig.3. It was found that the value of largest k almost returns to early start of contraction and delayed relaxation over one heart period. As a result large deformation was obtained for k=2.0x10⁻³. The effect of active/contraction force on ejection volume with k= 1.0x10⁻³ and k = 5.0x10⁻⁴ was found to be 50% and 25% of these values obtained with k=2.0x10⁻³, respectively.
(a) (b)
Fig. 1, Imposed geometrical boundary conditions on Lv; (a) constraint of four nodes at the equatorial section, (b) Apex constraint
[image:2.595.307.540.84.201.2]
(a) (b)
[image:2.595.45.291.635.756.2]B. Effect of muscle active force on LV wall thickness
At the equatorial plane of the left ventricle, Fig. 4 shows the change in wall thickness at septal (posterior) and anterior directions with increasing active contraction force that is represented by the factor k. For simple orientation models (0, 30, 45, 60, and 90 degrees) septal wall thickness
increases significantly with increasing the contraction factor k from 5.0x10⁻⁴, 1.0x10⁻³ to 2.0x10⁻³ as shown in Fig. 4(a), (b) and (c) respectively. Under the same values of k and
fiber orientations, LV-wall thickness at the anterior direction was strongly increased with increasing k as shown Fig. 4(d), (e) and (f). On the contrary with Huyghe orientation model (helix angle α=300), septal (posterior) wall exhibits more thickening than that of the anterior direction for similar contraction conditions. This difference can be attributed to the imposed geometrical boundary conditions at the equatorial plane as shown schematically in Fig. 1(a).
45 degree
60 degree
90 degree
Huyghe model
Zero degree
30 degree
(a) Anterior
(b)
Anterior(c) Anterior
(d) Anterior
Posterior
Posterior
Posterior
Posterior
Huyghe
Huyghe
30 degrees
30 degrees
60 degrees
60 degrees
Zero degree
(e) Anterior
(f) Anterior
Fig.3, Effect of the active force (represented by k factor) on ejection volume under constant fiber orientations (0, 30, 45, 60, 90 degrees) and Huyghe orientation model
C. Stress distributions over LV
Stress distributions in one contraction cycle of left ventricle are shown in Fig. 5. As we can see from the images most radial and longitudinal stresses are positive, while most circumferential stresses are negative. However, some elements do not follow this rule because of the imposed geometric boundary constraints or adjacent elements’ influence. These elements are found around the four constrained nodes at the equatorial plane and exhibit stress concentration as shown by colormap in Fig. 5. This means the present geometric boundary conditions are not the realistic one and we have to find out the more realistic one to get more uniform stress distributions.
V. CONCLUSION
The effect of muscle active force and fiber orientation on the performance of the left ventricular has been studied by FE-simulation. The LV-heart model was constructed in the Cartesian Coordinates and imposed geometric constrains were used to prevent rigid body motion. The fiber orientation model was generated for alpha helix α=00, 300, 450, 600 and 900 using a simple orientation model and Huyghe model. Nodal forces due active force were calculated by a subroutine converting the cell force to elemental force acting at the center of each element and its components were distributed at the 8-nodes of each element.
Posterior
Magnitude and orientations of the active force has a strong effect on the ejection volume, wall thickening and stress distributions.
It was found that the value of largest k (magnitude of active force) almost returns to early start of contraction and delayed relaxation over one heart period. Wall thickness and stress distribution of the LV not only rely on the passive material resistance of the tissues, the magnitude and direction of the active force but also on the imposed boundary conditions. To get more realistic deformation mechanics of the left ventricle, the effects of haemodynamic pressure of the ventricular cavities pericardial sac pressure, pericardial and endocrinal constrains should not be neglected. These effects will be considered in another future work.
ACKNOWLEDGMENT
M. A. Hassan would like to thank Prof. Akiro Noma and Prof. H. Kotera for their fruitful discussions on this paper.
REFERENCES
[1] L. Glass, P. Hunter, A.D. McCulloch, Theory of the heart: biomechanics, biophysics, and nonlinear dynamics of cardiac functions, Springer New York, 1991.
45 degrees
45 degrees
90 degrees
90 degrees
EDT (ref.) EST
(a)
(b)
(c)
[image:6.595.105.492.70.440.2]+0.028 -0.042
Fig. 5, LV stress distributions; (a) radial, (b) circumferential, (c) longitudinal components from end diastole (left) to end of systole (right).
[2] D. B. Ennis et al., Myofiber angle distributions in the ovine left ventricle do not conform to computationally optimized predictions Original Research Article, Journal of Biomechanics, Volume 41, Issue 15, 14 November 2008, P. 3219-3224
[3] R. Kerckhoffs, P. Bordachar, S. Healy, J. Omens, A. McCulloch, Myocardial mechanics during epicardial versus endocardial left ventricular pacing: simulations and experiments Journal of Biomechanics, Volume 39, Supplement 1, 2006, P. S291-S292 [4] H.F. Choi, J. D’hooge, F.E. Rademakers, P. Claus, Influence of
left-ventricular shape on passive filling properties and end-diastolic fiber
stress and strain Original Research Article
Journal of Biomechanics, Volume 43, Issue 9, 18 June 2010, P.1745-1753.
[5] P.J. Hunter, B.H. Smaill, The analysis of cardiac function: a continuum approach, Prog Biophys Molec Biol. 52, 1988), P. 101-164.
[6] T.P. Usyk, R. Mazhari, A.D. McCulloch, Effect of laminar orthotropic myofiber architecture on regional stress and strain in the canine left ventricle, J. Elasticity 61 , 2000, P.143-164.
[7] R.S. Schechter; The variational method in engineering; McGraw-Hill, New York, 1967.
[8] J.T. Oden; Finite element of nonlinear continua, McGraw-Hill, New York, 1972.
[9] M. Nash; Mechanics and material properties of the heart using an anatomically accurate mathematical model; New Zealand, the University of Auckland, 1998.
[10] K. Bathe, Finite element procedure in engineering analysis, Prentic-Hall, Englewood Cliffs, NJ ,1982.
[11] J.H. Omens, Y.C. Fung; Residual strain in Rate left ventricle; Circ Res. 66 ,1990, P.37-45.
[12] K. Costa, K. May-Newman, D. Farr, W.G. O’dell A.D. McCulloch, J.H. Omens; Three dimensional residual strain in midanterior canine left ventricle. Am J. Physiol. 273, 1997, P.1968-1976.
[13] J.H. Omens, Y.C. Fung; Residual strain in Rate left ventricle; Circ Res. 66 , 1990, P.37-45.
[14] J.H. Omens; Left ventricle strain in the no-load state due to the existence of residual stress; PhD thesis, Univesity of California , 1988.
[15] J. Huyghe, D. van Campen, T. Art, R. Heethar; A two Phase finite element model of the diastolic left ventricle, J Biomech 24, 1991, P.527-583.