Comparative Analysis of Seismic Behaviour of
Multi-Storey Composite, Steel and Conventional
RC Structure
Harish K N1, Prof. Vahini M2
1
P.G. Student, Department of Civil Engineering, Govt engineering college, Devagiri, Haveri, Karnataka, India
2
Assistant Professor, Department of Civil Engineering, Govt engineering college, Devagiri, Haveri, Karnataka, India
Abstract: The present work seeks to investigate the seismic behaviour of a typical ordinary moment resisting framed structure with composite columns and conventional steel columns and examine the key design issues involved.
The present study deals with seismic behaviour of a typical (G+12) storey framed concrete, steel and composite structure assessed through equivalent static method of analysis as per IS: 1893:2002 for moderate seismic zone III using ETABS software package. The analyses are performed on a suite of 3 types of ordinary moment resisting framed 3D space models with different column types – steel, concrete and composite.
The analysis is carried out and the results are compared in terms of critical earthquake response parameters such as base shear, storey drifts, roof displacements, and storey overturning moments. The main aim is to compare three different models which is subjected same load and other loading conditions.
Dynamic analysis and along with this response spectrum carried in order to compare the results and similar conditions and criteria.
At last pushover sample analysis in order to find the column failures has been carried out. Displacement for RCC and steel is more as compared with that of the composite structure. So while considering the displacement as the major criteria composite structure shows better performance.
Keywords: Composite columns, steel columns, seismic behaviour, multi-storey structure, column fracture.
I. INTRODUCTION
The buildings in India are constructed with RCC and the adoption of steel structures is generally confined to industrial buildings and of late multi-storey buildings, which have acquired prominence by adopting composite structural elements. However, in recent times, the composite columns are gaining popularity for use in multi-storey buildings by virtue of their excellent static and earthquake resistant properties such as lower mass, high strength, rigidity and stiffness, significantly high toughness and ductility, large energy dissipation capacity.
Also, the composite systems are lighter in weight (about 20 to 40% lighter than concrete construction). Thus, the composite system is a more complete structural system than simple reinforced concrete or steel elements. When adopting a composite section, the amount of structural steel, reinforcing steel and concrete area, and the geometry as well as the position of the three materials represent relevant design parameters.
Indeed, a number of different combinations are possible thus leading to a flexible design. A steel concrete composite column is a compression member, comprising either a concrete encased hot rolled steel section or a concrete filled tubular section of hot rolled steel and is generally used as a loadbearing member in a composite framed structure. The load carrying capacity of composite columns is more than that of the bare reinforced column and the structural steel column included in the system.
II. OBJECTIVEOFTHEPROJECT
A. To study the comparison of seismic behaviour of three types of multi-storey framed structures consisting of RCC, steel and
composite columns.
B. To study displacement, drift and base shear of these structures subjected to dynamic analysis.
C. To compare the results for structures with RCC, steel and composite columns.
III. METHODOLOGY
The structure resting on the ground starts vibrating when an earthquake occurs. Because it induces inertia forces in the structure. So in order to find out these forces and behaviour of the structure during the seismic activity, several researches have been conducted all over the world. This research involves the analysis techniques to determine the lateral forces purely from linear analysis. In India the Standardized method of analysis is followed by using a code – IS1893 (Part 1):2002 – “Criteria for Earthquake resistant design of structures”. Analysis of the structures are mainly categorized as,
A. Linear Static Analysis
1) Equivalent static lateral force method
B. Linear Dynamic Analysis
1) Response spectrum analysis
C. Non-linear Static Analysis
1) Time history analysis
D. Non-linear Dynamic Analysis
1) Pushover analysis
Table 1: Load Combinations and Load Factors as Per Is 1893 (Part-1)
IV. ANALYSISANDRESULTS
A. Data for Analysis
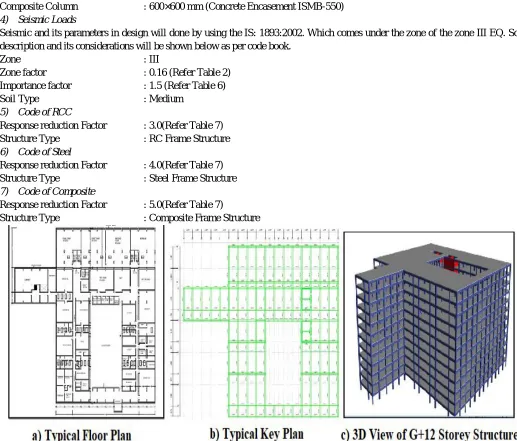
This study deals with the seismic behaviour of multi-storey structure. The work includes analysis of G+12 storey structure with RCC, steel and composite.
Plan Dimension : 83×74m
Total Height : 37.5m
Grade of concrete : M25
Grade of steel : Fe415
One-way slab : 200mm
Floor Finish load : 1kN/M2
Live Load : 3kN/M2
Density of concrete : 25kN/m3
1) RCC Structure
Beam : 400×600 mm
Column : 600×600 mm.
2) Steel Structure
Beam : ISMB-500
3) Composite Structure
Composite Beam : 400×600 mm (Concrete Encasement ISMB-500)
Composite Column : 600×600 mm (Concrete Encasement ISMB-550)
4) Seismic Loads
Seismic and its parameters in design will done by using the IS: 1893:2002. Which comes under the zone of the zone III EQ. Some description and its considerations will be shown below as per code book.
Zone : III
Zone factor : 0.16 (Refer Table 2)
Importance factor : 1.5 (Refer Table 6)
Soil Type : Medium
5) Code of RCC
Response reduction Factor : 3.0(Refer Table 7)
Structure Type : RC Frame Structure
6) Code of Steel
Response reduction Factor : 4.0(Refer Table 7)
Structure Type : Steel Frame Structure
7) Code of Composite
Response reduction Factor : 5.0(Refer Table 7)
[image:3.612.41.558.103.544.2]Structure Type : Composite Frame Structure
Figure 1: Typical Plans View of G+12 Storeys for Composite, Steel and Conventional RC Structure
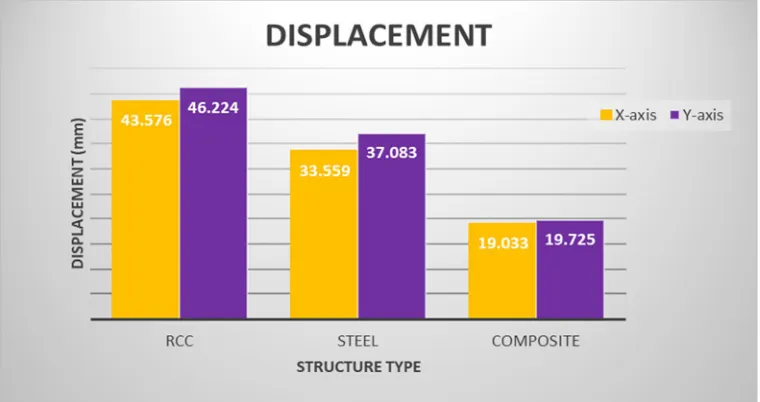
B. Maximum Displacement
Table 2: Maximum Displacement Values @ X and Y Direction Type Of
Structure
Displacement Along X-Direction (mm)
Displacement Along Y-Direction(mm)
RCC 43.576 46.224
Steel 33.559 37.083
[image:3.612.152.460.603.678.2]Figure 2: Maximum Displacement
[image:4.612.124.492.330.580.2]C. Maximum Drift
Table 3: Maximum Drift Values @ X and Y Direction
Type Of Structure Drift Along X- Direction Drift Along Y-Direction
RCC 0.00105 0.000768
Steel 0.000944 0.000937
Composite 0.000391 0.000319
[image:4.612.162.450.620.710.2]Figure 3: Maximum Drift D. Story Shear
Table 4: Maximum Shear Values @ X and Y Direction
Type Of Structure
Shear Along X- Direction (kN)
Shear Along Y-Direction (kN)
RCC 25109.4209 24801.8956
Steel 8391.2641 8692.3050
Figure 4: Maximum Shear E. Comparative Percentage (%) Variation for Displacement
Table 5: Maximum Displacement Comparison Compare to RCC Increase (%) Decrease (%) Compare to Steel Increase (%) Decrease (%) Compare to Composite Increase (%) Decrease (%)
Steel - 19.775 RCC 19.775 - RCC 56.332 -
Composite - 56.332 Composite - 43.289 Steel 43.289 -
1) Displacement reduces by 56.332% and 43.289% for composite structure when compared to RCC and steel structure
respectively.
2) Displacement reduces by 19.775% for steel structure when compared to RCC structure and increases by 43.289% when
compared to composite structure.
3) RCC structure experiences a displacement increase of 19.775% and 56.332% when compared to steel and composite structures
respectively.
F. Comparative Percentage (%) Variation for Drift
Table 6: Maximum Drift Comparison
Compare to RCC Increase (%) Decrease (%) Compare to Steel Increase (%) Decrease (%) Compare to Composite Increase (%) Decrease (%)
Steel - 18.036 RCC 18.036 - RCC 62.761 -
Composite - 62.761 Composite - 58.580 Steel 58.580 -
1) Drift reduces by 62.761% and 58.580% for composite structure when compared to RCC and steel structure respectively.
2) Drift reduces by 18.036% for steel structure when compared to RCC structure and increases by 58.580% when compared to
composite structure.
3) Storey drift of composite structures are comparatively less than RCC structures and steel structures.
G. Comparative Percentage (%) Variation for Shear
Table 7: Storey Shear Comparison Compare
to RCC
Increase (%)
Decrease (%)
Compare to Steel
Increase (%)
Decrease (%)
Compare to
Composite
Increase (%)
Decrease (%)
Steel - 61.430 RCC 61.430 - RCC 28.550 -
Composite - 28.550 Composite 46.044 - Steel - 46.044
1) Story shear reduces by 28.5% and increases by 46.04% for composite structure when compared to RCC and steel structures
respectively.
2) Story shear reduces by 61.4% and 46.04% for steel structure when compared to RCC structure and composite structure.
3) Story shear of composite structures are comparatively less than RCC structures and more of steel structures.
4) An increase of Storey shear by 61.43% and 28.55% is observed for RCC structures when compared with steel and composite
structures respectively.
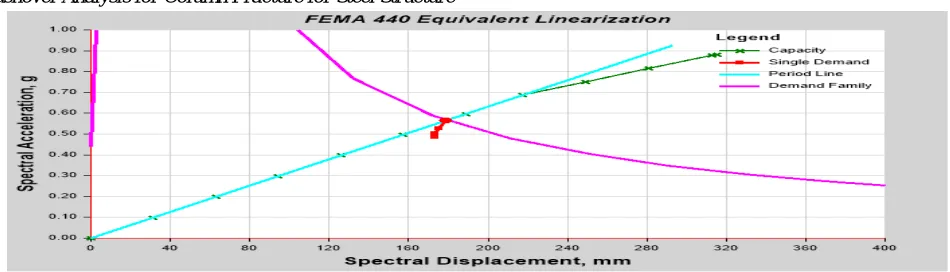
H. Pushover Analysis for Column Fracture for RCC Structure
Figure 5: Pushover Plot
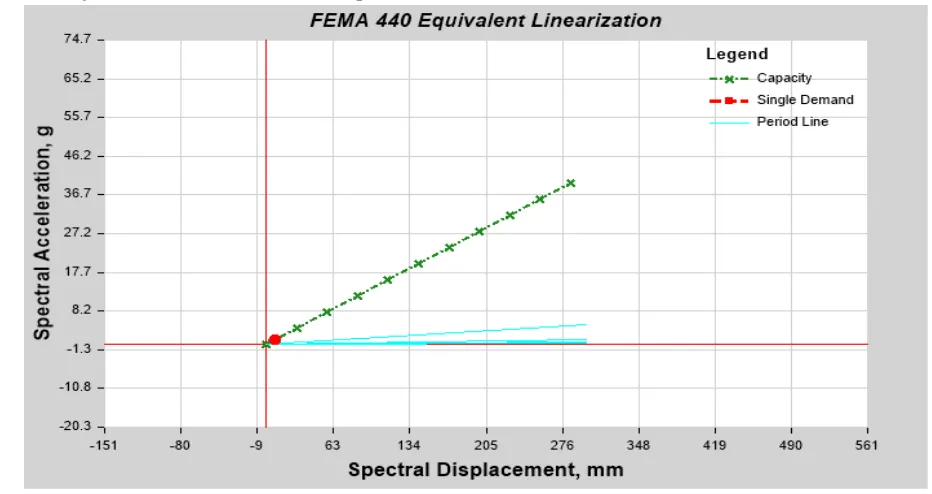
From above analysis, figure 5 shows the hinge patterns. Plastic hinge formation starts with the yielding of structural members of above pushover plot shows the most of the hinges formed the RCC structure are in between the proportionality limit and the yielding state. The capacity curve shows the in order to approve apply the proper seismic values are the demand the structure above will be representing those criteria’s. the ground motion which will be of the earthquake will be going to be represented as a curve which is known as and demand curve. the capacity curve will be represented as the point of performance curve at the intersections level shown as in figure. during the consideration of the analysis in the earth structure the basic is considered to be as value 4655.5914 KN and the performance obtained at the displacement of 122.215mm.
[image:6.612.67.542.584.720.2]From above analysis, figure 6 shows the hinge patterns. Plastic hinge formation starts with the yielding of structural members of ground stories which will be going to be then travels under the consideration to upper stories which will comes under the yielding of elements like the columns. Under theses analysis the base shear which will be of the structure value will be 2286.4967 KN and the performance obtained at the displacement of 204.927mm.
[image:7.612.75.541.153.400.2]J. Pushover Analysis for Column Fracture for Composite Structure
Figure 7: Pushover Plot
From above analysis, figure 7 shows the hinge patterns. Plastic hinge formation which will be going to be then travels under the consideration to upper stories which will comes under the yielding of elements like the columns. Under theses analysis the base shear which will be of the structure value will be 9950.5976 KN and the performance obtained at the displacement of 99.520mm.
V. CONCLUSION
In this work an attempt has been made to check the performance of structure for the different structures such as Composite, Steel and RCC. The dynamic analysis is carried out and along with the response spectrum is carried in order to compare the results and criteria.
Totally G+12 storey are considered for the analysis. The conclusions based on the analysis presented here,
A. Under displacement the composite structure shows remarkable reduction in displacement when compared with all other
structures.
B. Displacement reduces by 56.332% and 43.289% for composite structure when compared to RCC and steel structure, but it is
within the permissible limits by H/500, where H is storey height for both X and Y direction along longitudinal and transverse direction.
C. Storey drift of composite structures are less than RCC structures and steel structures.
D. Drift reduces by 62.761% and 58.580% for composite structure when compared to RCC and steel structure respectively it is
also within permissible limits by 0.004H, where H is storey height along for the transverse and longitudinal direction.
E. Story shear of composite structures are comparatively less than RCC structures and steel structures.
F. Story shear reduces by 28.5% and increases by 46.04% for composite structure when compared to RCC and steel structures
respectively.
G. Composite structures are efficient when compared to RCC and steel structures.
H. Under pushover analysis shows the real behavior of columns of the structures. It could help the grasp of the structural capacity
REFERENCES
[1] Chapman.J.C.and Yam.L.C. P, “The inelastic behavior of simply supported composite beams of steel and concrete”, Vol. 41, Issue. 4: Pages. 651-683, December (1968).
[2] LIU Jingbo, LIU Yangbing, “Seismic behavior analysis of steel-concrete composite frame structural systems”, Tsingua University, The 14th World Conference on Earthquake Engineering, Beijing, China, October 12-17, (2008).
[3] D. R. Panchal and P. M. Marathe, “Comparative Study of R.C.C., Steel and Composite (G+30) storey building”, Institute of Technology, Nirma University, Ahmedabad-382 481, pp- 1-6, December, (2011).
[4] Anwar Shamkhi Jabbar Alkhazali, Dr.N.V. Ramana Rao, “Seismic Analysis and Comparison of Different Models of Multi-Story Buildings”, ISSN 2319-8885 Vol.03, Issue.21, September-2014, Pages:4317-4326, (2014).
[5] Shweta A. Wagh and Dr. U. P. Waghe, “Comparative Study of R.C.C and Steel Concrete Composite Structures”, International Journal of Engineering Research and Applications, Vol. 4, Issue 4(Version 1), April 2014, pp.369-376, (2014).
[6] S. S. Charantimath and Swapnil B. Cholekar, Manjunath M. Birje, “Comparative Study on Structural Parameter of R.C.C and Composite Building”, Civil and Environmental Research, Vol.6, Issue.6, 2014, pp.2224-5790, (2014).
[7] D. R. Panchal, Dr. S. C. Patodi, “Steel-Concrete Composite Building Under Seismic Forces”, Applied Mechanics Department, M. S. University of Baroda, Vadodara and Professor, Civil Engineering Dept., Parul Institute of Engineering & Technology, Limda Vadodara.
[8] PankajAgarwal, Manish Shrikhande, " Earthquake resistant design of structures", published by Asoke k. Ghosh, PHI learning Private Limited Rimjhim house, Delhi (2009).
I S CODES:
[9] IS:875 (1987-Part 2), “Code of practice for live loads”. Bureau of Indian Standards (BIS): New Delhi; 1987.
[10] IS:456, “Code of practice for plain and reinforced concrete code of practice”. Bureau of Indian Standards: New Delhi; 2000.