Optimization of Resistance Spot Welding Process
Parameters for CR2 513 Material using Taguchi
Method
Sansarsagar P Jadhav1, Madhavi S Harne2
1
PG Scholar, 2Assistant Professor, Department of Mechanical Engineering, Government College of Engineering Aurangabad, Maharashtra, India
Abstract: This paper represents the optimization of various parameters of resistance spot welding. The experimental studies have been conducted under varying welding current, Electrode Force, and welding time. In this investigation the quality characteristic (tensile strength) has been considered using Taguchi Method. The experimental studies have been carried out varying welding currents, Electrode Force and Welding Time for joining two sheets
Keywords: Resistance spot welding (RSW), Process parameter, Mild steel CR2 513, Taguchi method, Tensile Strength, Signal to Noise Ratio (S/N Ratio), Analysis of variance (ANOVA)
I. INTRODUCTION
Resistance spot welding (RSW) process is a major sheet metal joining processes. Used in Automobile, Aerospace and Home appliances Industries. Because it has the advantage of high speed operation, high-production assembly lines and suitability for automation. In any car nearly about 3000 - 4000 spot weld joining is used, which shows the importance of resistance spot welding processes. In RSW the joining of sheet metal is combination of mechanical, electrical, thermal and metallurgical phenomenon. The strength of spot weld is depending on the parameters and their levels used for welding process. This paper presents an experimental investigation for the Tensile strength of spot weld by using Taguchi method. An experimental study is conducted under various levels of process parameters. Spot welds are carried out on mild steel CR2 513 material. Welding current, Electrode force and weld time are selected as process parameters with three levels of each. Taguchi quality design concept of L9 orthogonal array has been used to determine S/N Ratio, Analysis of Variance (ANOVA). The level of importance of welding parameters for Tensile strength is determined by ANOVA in Minitab 19 software.
A. Literature Review
Manoj Raut ,Vishal Achwal [1] has studied the effect of parameters on resistance spot weld of mild steel material. He investigated that welding parameters are the important factors for the strength of the welded joint. Which may increase or decrease the strength of the welding joint so we can say that the combination of the suitable parameters is necessary for the maximum strength of the spot welded joint.
Ugur Esme [2] has studied optimization of RSW process parameters for SAE 1010 steel using Taguchi method. He investigated that increasing welding current and electrode force are prime factors controlling the weld strength. He concluded that Taguchi method can be effectively used for optimization of spot welding parameters.
Manjunath R. Rawal, Dr. K .H. Inamdar [4] has studied optimization of RSW process parameters for CRCA material .the welding Current was found to be the major factor affecting the tensile strength (85.26%), Electrode force was found to be the second ranking factor (5.27%), whereas Welding Time being (3.76%) respectively.
A.K. Pandey, M.I. Khan. K.M. Moeed [5] investigation indicate the welding current to be the most significant parameter controlling the weld tensile strength as well as the nugget diameter for AISI-1008 steel sheets .Also they effectively use taguchi method for optimization of spot welding parameters.
B. Spot Welding Parameters And Heat Generation
The three main parameters in resistance spot welding are current, contact resistance and weld time. In order to produce good quality weld the above parameters must be controlled properly. The amount of heat generated in this process is governed by the formula,
Q = I² R T [2]
Q = heat generated, Joules R = resistance of the work piece, Ohms
I = current, Amperes T = time of current flow, second
II. EXPERIMENTAL DETAILS
A. Taguchi Approach
The quality engineering methods of Dr. Taguchi is one of the important statistical tools of total quality management for designing high quality systems at reduced cost. Taguchi recommends a three stage process to achieve desirable product quality by system design, parameter design and tolerance design. While system design helps to identify working levels of the design parameters, parameter design seeks to determine levels of parameter that provide the best performance of product or process under study. The optimum condition is selected so that the influence of uncontrollable factors (noise factors) causes minimum variation to system performance. Orthogonal arrays, ANOVA, S/N ratio analysis are the essential tools for parameter design. Tolerance design is a step to fine-tune the results of parameter design [10].
B. Material and Method
[image:2.612.60.560.376.421.2]The material used in the present work is mild steel CR2 Grade IS 513 sheet of 1.2 mm thickness. The chemical composition for each element of the above material is listed below in table 2.1
Table 2.1 Chemical analysis of Work piece Materials: Percent Composition
(%)
C Mn S P Si Al
0.045 0.22 0.003 0.020 0.015 0.025
Method - The following input and output parameters are considered: Input parameters selected are welding current, Electrode Force, and Welding Time. Output parameter predicting strength of weld joint is Tensile strength. The input parameters are shown in Table-2.2.
Table-2.2 Process parameters and Their Levels
Level Welding Current (KA) Electrode Force (KN) Welding Time (Cycle)
1 6 2.5 5
2 6.5 2.7 6
3 7 3 7
C. Size and Dimensions of Specimen
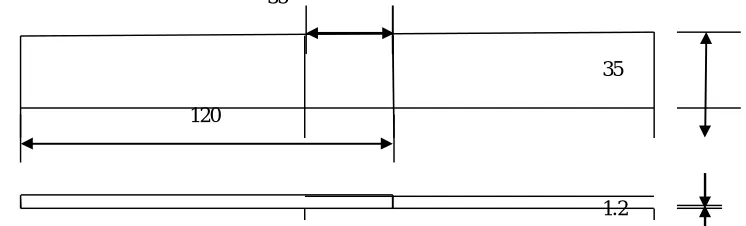
The specimens were cut from a sheet of 1.5 m x 2.5 m. The Specimens were cut parallel to the rolling action of the sheets. The dimensions are 120 mm length and 35 mm width, the overlap being equal to the width of the specimen. This overlap was chosen as per AWS recommendation [10].as shown if below figure 1.
[image:2.612.82.455.603.716.2]Figure 2.2 Resistance spot welding (RSW) Specimen.
III. ANALYSIS OF EXPERIMENTAL RESULTS BASED ON TAGUCHI METHOD
A. Analysis of S/N Ratio
In the Taguchi Method the term Signal represents the desirable value (mean) for the output characteristic and the term Noise represents the undesirable value (standard deviation) for the output characteristic. Therefore, the S/N ratio to the mean to S.D.S/N ratio used to measure the quality characteristic deviating from the desired value [9].
The S/N ratio is defined as n =10 log (M.S.D.)
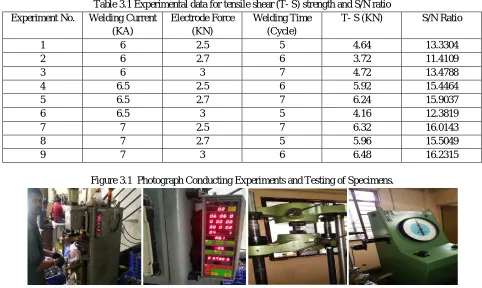
Where, M.S.D. is the mean square deviation for the output characteristic. To obtain optimal welding performance, higher the better quality characteristic can be taken and S/N ratio is calculated for each experiment and placed in corresponding column as shown in table3.1
Table 3.1 Experimental data for tensile shear (T- S) strength and S/N ratio
Experiment No. Welding Current
(KA)
Electrode Force (KN)
Welding Time (Cycle)
T- S (KN) S/N Ratio
1 6 2.5 5 4.64 13.3304
2 6 2.7 6 3.72 11.4109
3 6 3 7 4.72 13.4788
4 6.5 2.5 6 5.92 15.4464
5 6.5 2.7 7 6.24 15.9037
6 6.5 3 5 4.16 12.3819
7 7 2.5 7 6.32 16.0143
8 7 2.7 5 5.96 15.5049
9 7 3 6 6.48 16.2315
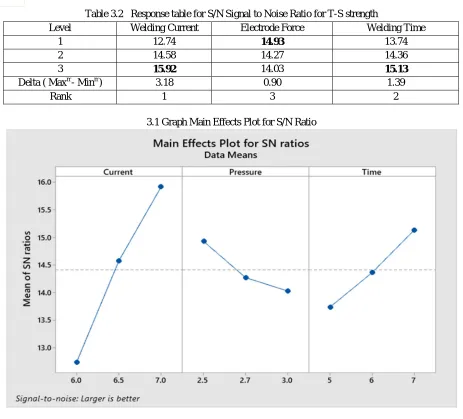
[image:3.612.64.546.434.722.2]Table 3.2 Response table for S/N Signal to Noise Ratio for T-S strength
Level Welding Current Electrode Force Welding Time
1 12.74 14.93 13.74
2 14.58 14.27 14.36
3 15.92 14.03 15.13
Delta ( Maxm- Minm) 3.18 0.90 1.39
Rank 1 3 2
3.1 Graph Main Effects Plot for S/N Ratio
IV. ANALYSIS OF VARIANCE
[image:4.612.75.538.69.488.2]A better feel for the relative effect of the different welding parameters on the tensile shear strength (TS) was obtained by decomposition of variance, which is called analysis of variance (ANOVA) . The relative importance of the welding parameters with respect to the TS was investigated to determine more accurately the optimum combinations of the welding parameters by using ANOVA. The results of ANOVA for the welding outputs are presented in Table 4.1 Statistically; F-test provides a decision at some confidence level as to whether these estimates are significantly different. Larger F-value indicates that the variation of the process parameter makes a big change on the performance.
Table 4.1 Analysis of variance for SN ratios
Source DOF SS MS F - Value P -
Value
V. CONCLUSIONS
This paper is presented an investigation on the optimization and the effect of welding parameters on the tensile strength of resistance spot welding for mild steel CR2 Grade IS 513 sheet of 1.2 mm thickness. The experimental results show that the right section of the input parameters are high current, medium electrode force and high weld time.
A. The response of S/N ratio with respect to tensile strength indicates the welding current to be the most significant parameter that controls the weld time are comparatively less significant in this regard.
B. The contribution of welding current, welding time and electrode force towards tensile strength is 66.91%, 15.25 %, 2.96 % respectively as determined by the ANOVA method.
C. Optimal results have been found by taguchi method using high current 7 KA, medium electrode force 2.5 KN, and high welding
time of 7 cycle.
VI. ACKNOWLEDGEMENT
Author would like to thankful to guide Prof Madhavi S Harne who rendered assistance continuously as promoter and advisor in all phases of its progress, I am thankful to Dr. S. B Chikalthankar, Head of Department Mechanical for his encouragement in all respect. I am thankful Mr. Dahihande D. K., General Manager, Rushikesh Pressing, Gut No. 43, Plot no 38/1, Behind Siemense, Rajangaon, MIDC, Waluj, Aurangabad who have permitted to conduct this experimental work in their organization.
REFERENCES
[1] Fundamentals of American Welding Society. 1980. Welding Handbook Volume 1. [2] American Welding Society. 1980. Welding Handbook Volume 3.
[3] Manoj Raut ,Vishal Achwal optimization of spot welding process parameter for maximum tensile strength.Vol. 3, No. 4, October 2014 © 2014 IJMERR. [4] Ugur Esme. 2009. Application of Taguchi method for the optimization of resistance spot welding process. The Arabian Journal for Science and Engineering.
34(28): 519-528.
[5] Manjunath R. Rawal, Dr. K .H. Inamdar. Optimization of Spot Welding Process Parameters for CRCA Material using Taguchi Method, 2014 IJEDR | Volume 2, Issue 2 | ISSN: 2321-9939
[6] A.K. Pandey, M.I. Khan. K.M. moeed, Optimization of the welding parameters in resistance spot welding. International Journal of Engineering Science and Technology,2013,234-240.
[7] Thakur A G, Rao T E, Mukhedkar M S and Nandedkar V M (2010), “Application of Taguchi Method for Resistance Spot Welding of Galvanized Steel”, November, ARPN Journal of Engineering and Applied Sciences.
[8] D.S. Sahota, Ramandeep Singh, Rajesh Sharma, Harpreet Singh, Study of effect of parameters on resistance spot weld of ASS316 material, Mechanica Confab 2013, 67-78.
[9] Montgomery, Design and Analysis of Experiments. Singapore: Wiley, 2001.