Plant Disease Identification using Machine
Learning Approach
Shwetambari C. Jadhav
1, Diksha S. Sathe
2, Jyoti M. Shirahatti
3, Rutuja R. Patil
4,
Pooja K. Akulwar
51, 2, 3 ,4Student, 5Asst. Professor, Computer Science and Engineering, Sanjay Ghodawat Group of Institutions, Atigre, India
Abstract: In this world Agriculture plays an important role not only in farmers life also plays the importance in the economy. Most important fact related to agriculture is reduction in crop quantity is disease attack. Most used technique to identify the disease is manual identification which is time consuming and need of labor for manual identification is more. Plant disease can be easily identified using machine learning approach. Images will be captured by android application and then image processing is done and machine learning approach is applied to identify disease.
Keywords: GLCM, KMeans clustering, SVM Algorithm
I.INTRODUCTION
Agriculture is one of the important source of income for farmer. Farmers can grow variety of plants but diseases hamper the growth of plants. One of the major factors that leads the destruction of plant is disease attack. Disease attack may reduce the productivity plants from 10%-95%.[1] At present there are different strategies to get rid of plant diseases such as removing the affected plants manually, mechanical cultivation and last is using different pesticides. The easy method to detect to plant disease is taking help of agricultural expert. But this method of manual detection of diseases takes lot of time and is laborious work. Next method is using pesticide but excess use of pesticide may increase growth of plants but it reduces the quality of plant. But using more pesticide for plants without analysing how much quantity of pesticide is needed for particular crop because excess use of pesticide may lead adverse effect on environment and human health. Classification of Plant and Diseased Plants using digital image processing and Machine Learning approach which can help to control growth of diseases on Plants using the pesticides in the quantity needed so that excess use of pesticides can be avoided.
Automatic identification of plant diseases is an important task as it may be proved beneficial for farmer to monitor large field of plants, and identify the disease using machine learning approach .As compared to image processing technique using machine learning approach manual disease identification is less accurate and time consuming.
Fig1.1: Diseased Plant leaves
II.LITERATURESURVEY
In order to know in detail about this survey the previous research work done in this direction, several studies dedicated to the topic were referred. The literature survey is done in chronological order from 2012-2016.
F Ahmed in 2012, [1] has stated that in most agricultural systems, one of the major concerns is to reduce the growth of Unwanted Plants .In most cases, removal of the Unwanted Plants population in agricultural fields involves the application of chemical herbicides, which may lead to huge productivity but adverse effect on environment and human health. The ability of locating and classifying plants and Unwanted Plants in digital images could lead to development of autonomous vision guided agricultural equipment’s for site-specific herbicide application.
Suhaili Beeran Kutty in 2013, [2] have considered an artificial neural network (ANN) based system to classify the watermelon leaf diseases of Downney Mildew and Anthracnose .This classification is based on the colour feature extraction from RGB colour model which is obtained from the identified pixels in the region of interest. Result of this work showed that the leaf disease achieved 75.9% of accuracy based on its RGB colour component
Godliver Owomugisha in 2014, [3] has stated that Machine learning is one of the approach which has been applied in Agriculture but also in other fields including crop disease detection for some crops. No machine learning techniques has been used to detect banana plant such as banana bacterial wilt (BBW) and etc. There are various computer vision techniques which led to the development of an algorithm that consists of three main phases .1) images of banana leaves where taken using a standard digital camera.2) It involves different feature extraction techniques to extract features of taken image. 3) After feature extraction images are classified as either healthy or diseased .Extremely randomized trees performed best in identifying the diseases achieving 0.96 AUC for BBW and 0.91 for BBS.
Mrunmayee Dhakte in 2015, [4] has stated that Pomegranate is the one of the fruit grown in large quantity in many states of India and one of the most profit gaining fruit. But due to various reasons plants are infected by various diseases which destroys the crop. The work proposes an image processing and neural network methods to deal with main issues of phytopathology. In this system GLCM feature extraction techniques and k-means machine learning approach are used. Accuracy of this system to detect disease is 90%.
Arti Singh in 2016, [5] has stated that Advances in automated and high throughput images has resulted in deluge of high-resolution images and sensor data of plants. Extracting patterns and features from this set of data requires the use of machine learning techniques to find out data assimilation and feature identification. Different steps in which machine learning approaches can be deployed are Identification, classification, quantification and prediction.
Sharada P.Mohanty in 2016,[6] has stated that crop diseases are the main threat to food security, but their rapid detection remains difficult in many parts of the world due to lack of required infrastructure. The combination of Increase in use of smartphone and advances in the computer researches made possible by deep learning have made way for smartphone based disease detection. If the system is trained properly the success rate is 95%-99% accuracy.
A. Existing System
In existing system there is lot of manual work where image is given manually to the system and each and every algorithm used in system executed to detect disease. Existing system can detect only one disease and this system leads to excess costing. Existing system can detect disease but cannot provide solution to farmer and is not user friendly.
III.PROPOSEDSYSTEM
.
In this system architecture, firstly image of crop is captured using android application. After that image is uploaded to server side. At server side image pre-processing is carried out, features are extracted and compared with the training set. After comparison disease is classified and information about disease is given to farmer.
A.Modules
Android app is used to upload plant leaf image and get the results from the server. Once the image comes at the server end numerical values of the image histogram are extracted using GLC M and KMeans clustering algorithm. Before starting actual work of system we need to train the system so we need to give some train images, extract numerical value and give disease class and save it in .csv file. Test set consist of the features extracted of the actual image after grd file is generated using GLCM algorithm.we need to classify to classify the disease so comparison of training set and test set is done after comparison result is provided to farmer on android app.
B.Algorithm 1) Start
2) Upload the image to server using android application. 3) Prepare train set to train the system using steps 4 and 5. 4) Generate GRD file of image features using GLCM algorithm.
5) Extract min value of the features from GRD file using KMeans Clustering algorithm. 6) Save the features of the actual image in test set using steps 4 and 5.
7) Compare training set and test set using SVM algorithm 8) Classify the disease
9) Display the disease information on android app when result button is clicked. 10) stop
IV.TECHNIQUESUSED
A. GLCM
A co-occurrence occurrence matrix, also referred to as a co-occurrence distribution is defined over an , is defined over an image to be the distribution of to be the distribution of co-occurring values at a given offset or Represents the distance and angular spatial relationship over an image sub-region of specific region of specific size. The GLCM is created from a gray The GLCM is created from a scale image. The GLCM is calculates how often a pixel The GLCM is calculates how often a pixel with gray with gray-level (grayscale intensity or gray-level (grayscale intensity or Tone) value i occurs either horizontally, occurs either horizontally, vertically, or diagonally to adjacent pixels vertically, or diagonally to adjacent pixels with the value with the value j.
B. K-Means Clustering
Clustering could be a methodology to divide a collection of information into a selected range of teams. It’s one of the popular method is k-means clustering. In k-means clump, it partitions a set} of information into a k range group of data11, 12.
It classifies a given set of data into k number of disjoint cluster. K-means algorithm consists of two separate phases.
In the initial part it calculates the k center of mass and within the second part it takes every purpose to the cluster that has nearest centroid from the respective data point. There area unit totally different strategies to outline the gap of the closest centre of mass and one of the foremost used strategies is geometrician distance. Once the grouping is completed it calculate the new centre of mass of every cluster and supported that centre of mass, a new Euclidean distance is calculated between each center and each data point and assigns the points within the cluster that have minimum geometrician distance. Each cluster within the partition is outlined by its member objects and by its center of mass.. The centre of mass for every cluster is that the purpose to that the total of distances from all the objects in that cluster is minimized. So K-means is A repetitive formula within which it minimizes the total of distances from every object to its cluster centre of mass, over all clusters.
Let us think about a picture with resolution of x×y and also the image should be cluster into k range of cluster. Let
p(x, y) be AN input pixels to be cluster and ck be the cluster centers. The algorithm for k-means13 clustering is following as: 1) Initialize number of cluster k and centre.
2) For every constituent of a picture, calculate the Euclidean distance d, between the center and each pixel of an image using the relation given below.
3) Assign all the pixels to the closest centre supported distance d.
4) Finally pixels are appointed, recalculate new position of the centre using the relation given below. ck = 1
k y∈ck x∈ck p(x, y)
5) Repeat the method till it satisfies the tolerance or error worth. 6) Reshape the cluster pixels into image.
Although k-means has the good advantage of being simple to implement, it has some drawbacks. The quality of the final clump results is depends on the absolute choice of initial centre of mass. So if the initial centroid is randomly chosen, It’ll get totally different result for various initial centers. So the initial center are going to be rigorously chosen in order that we tend to get our desire segmentation. And conjointly process complexness is another term that we want to contemplate whereas designing the K-means clustering. It depends on the amount of information parts, range of clusters and range of iteration.
C. SVM Algorithm
“Support Vector Machine” (SVM) can be a supervised machine learning formula which will be used for each classification or regression challenges. However, it is mostly used in classification problems. In this algorithmic program, we tend to plot every information item as a degree in n-dimensional house (where n is variety of options you have) with the worth of every feature being the value of a particular coordinate.
Support Vector Machines are supported by the conception of call planes that outline call boundaries. A choice plane is one that separates between a collections of objects having completely different category memberships.
Fig 4.1 SVM Classification
The on top of may be a classic example of a linear classifier, i.e., a classifier that separates a collection of objects into their individual teams (GREEN and RED during this case) with a line. Most classification tasks however, don't seem to be that easy, and sometimes additional advanced structures are required so as to create An optimal separation, i.e., properly classify new objects (test cases) on the idea of the examples that are available (train cases). This situation is depicted in the illustration below. Compared to the previous schematic, it's clear that a full separation of the inexperienced and RED objects would require a curve (which is additional advanced than a line). Classification tasks based on drawing separating lines to differentiate between objects of various category memberships are referred to as hyperplane classifiers. Support Vector Machines are significantly suited to handle such tasks.
Fig 4.2 SVM Classification
V.COMPARATIVE STUDY AND RESULTS
Existing system consist of the system which can detect the disease but for one crop and accuracy level is low, is not user friendly and image is given manually and at server side also the process to detect the disease is done manually. All this work is done using basis of the texture of the plant image and change in color of the diseased part. Existing system use SVM algorithm but only SVM is not enough for classification as some times accuracy level of classification may get affected. In existing color features of the image are extracted and based on features extracted classification is done
Proposed system consist of the android app where farmer only needs to upload the image of the plant of which he want to get details once the image is uploaded it goes to the server where the processing is done automatically, where the numerical values of the image uploaded are extracted and on basis of the numerical values and class of disease, disease is detected and information about disease is delivered to farmer on the same android app.
This system gives proper output if and only if the image uploaded by farmer is good and clear so that Machine learning algorithms can be applied and proper output is given to farmer. Machine learning algorithms help to extract the features of image uploaded by the farmer and then the extracted features are compared with the features available in the training set and disease is classified. Proper output about disease is given to farmer.
[image:5.595.133.489.327.736.2]This system helps us to achieve some part of the organic farming or the crops grown with less use of chemical controls as chemical controls helps to increase the quantity of crop but excess use of chemical control leads to decrease the quality of crops grown. Excess use of chemicals lead to degradation of soil quality.
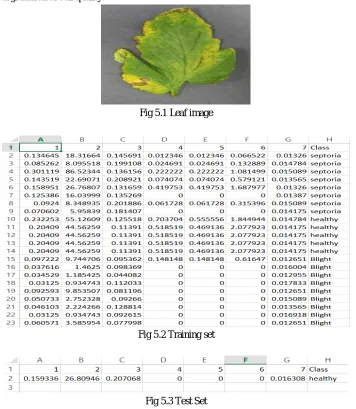
Fig 5.1 Leaf image
Fig 5.2 Training set
Fig 5.4 Predicted Result
In fig 5.1 we can notice one leaf image consist of septoria disease which is given as input after image is given features are extracted and as we notice in fig 5.3 which is test set where class is shown as healthy but after comparing the test set with training set result is predicted as septoria. Once the disease is predicted disease name and solution is provided to farmer.
A.Advantages
1) Fast and accurate detection and classification of plant disease. 2) Manual Work is reduced.
3) SVM is the best algorithm used for image processing. 4) Predict the disease, if any on the plant.
5) Send message to farmer with image and solution for the problem through Android Application. 6) Time requirement to detect disease is less.
7) Bio-medical control will be provided to reduce the use of chemical control 8) This system is low cost as compared to manual system
VI.CONCLUSION
Machine learning technique can be implemented using different programming languages such as R programming, Python, Java, etc. As per research done by researchers R programming is the most used programming language by programmers to implement machine learning approaches.
This system helps in understanding the creation of an System that will do image processing and identify the plant diseases using machine learning approach.
These machine learning methods will help system to identify disease occurred on plant by image processing and system will inform farmer about disease in detail and specify the medicine to get rid of plant disease, increase the productivity of crops and achieve organic farming to some extinct.
REFERENCES
[1] F Ahmed, HA AI-Mamun, ASMH Bari, E Hossain, “Classification of crops and weeds from digital images: A SVM approach”, Elsevier-2012
[2] Suhaili Beeran Kutty, Noor Ezan Abdullah, Dr. Hadzli Hashim, A’zraa Afhzan Ab Rahim, Aida Sulinda Kusim,Tuan Norjihan Tuan Yaakub, Puteri Nor Ashikin Megat Yunus, Mohd Fauzi Abd Rahman “Classification of Watermelon Leaf Diseases Using Neural Network Analysis” 2013 IEEE Business Engineering and Industrial Applications[BEIAC].
[3] Godliver Owomugisha, John A. Quinn, Ernest Mwebaze and James Lwasa, “Automated Vision-Based Diagnosis of Banana Bacterial Wilt Disease and Black Sigatoka Disease”, Proceedings of the International conference on the use of mobile ICT in Africa 2014, ISBN: 978-0-7972-1533-7.
[4] Dhakte Mrunmayee, and A. B. Ingole. "Diagnosis of pomegranate plant diseases using neural network." Computer Vision, Pattern Recognition, Image Processing and Graphics (NCVPRIPG), 2015 Fifth National Conference on. IEEE, 2015.
[5] Singh Arti, “Machine learning for high-throughput stress phenotyping in plants." Trends in plant science 21.2 (2016): 110-124.
[6] Mohanty Sharada P., David P. Hughes, and Marcel Salathé. "Using deep learning for image-based plant disease detection." Frontiers in plant science 7 (2016): 1419.
[7] Mahlein, Anne-Katrin. "Plant disease detection by imaging sensors–parallels and specific demands for precision agriculture and plant phenotyping." Plant Disease 100.2 (2016): 241-251
[8] Behmann, Jan, et al. "A review of advanced machine learning methods for the detection of biotic stress in precision crop protection." Precision Agriculture 16.3 (2015): 239-260
[9] Prince, Gillian, John P. Clarkson, and Nasir M. Rajpoot. "Automatic detection of diseased tomato plants using thermal and stereo visible light images." PloS one 10.4 (2015): e0123262.